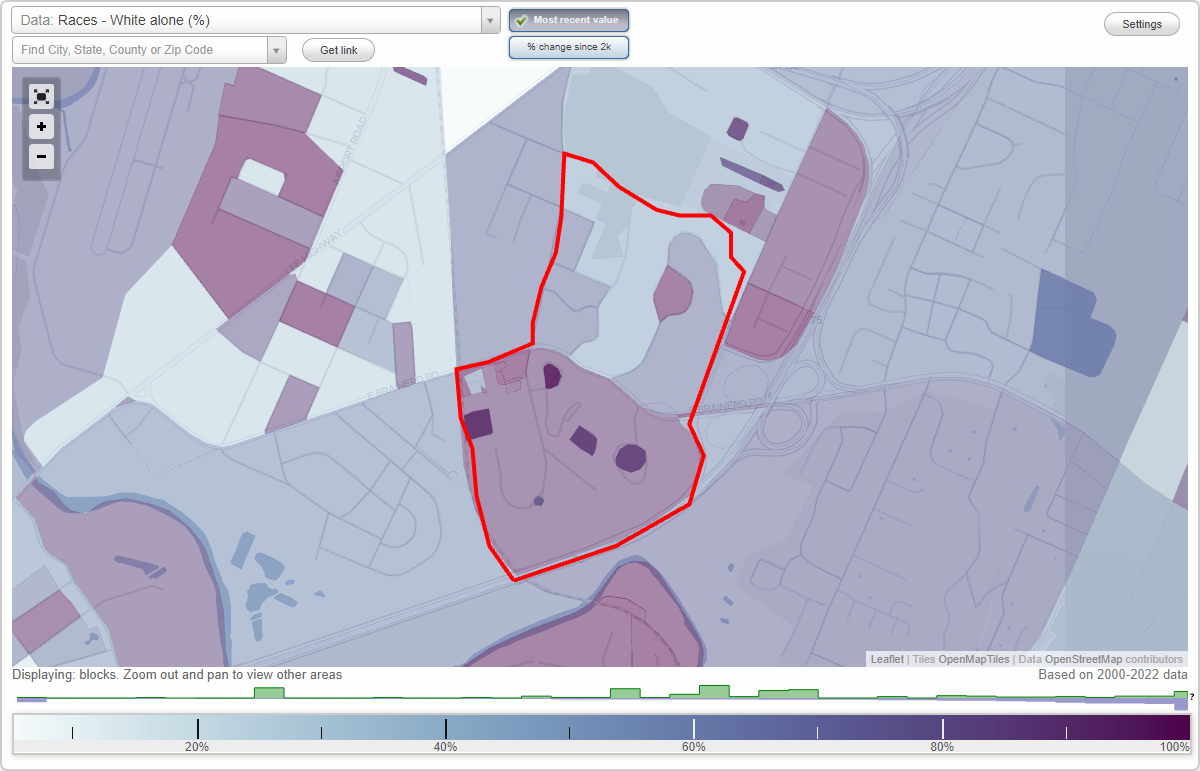
Marimont neighborhood in Chattanooga, Tennessee (TN), 37421 detailed profile
Settings
X

Business Search - 14 Million verified businesses
Area: 0.431 square miles
Population: 1,030
Population density:
| Marimont: | 2,393 people per square mile |
| Chattanooga: | 1,361 people per square mile |

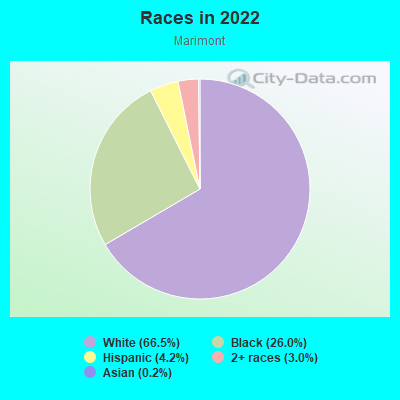
- 68666.5%White
- 26826.0%Black
- 434.2%Hispanic or Latino
- 313.0%Two or more races
- 20.2%Asian
- 10.10%American Indian
Median household income in 2022:
| Marimont: | $62,224 |
| Chattanooga: | $64,340 |
Distribution of median household income
![Distribution of median household income]()
- 7Less than $10,000
- 11$10,000 to $19,999
- 43$20,000 to $29,999
- 58$30,000 to $39,999
- 35$40,000 to $49,999
- 89$50,000 to $59,999
- 43$60,000 to $74,999
- 85$75,000 to $99,999
- 117$100,000 to $124,999
- 15$125,000 to $149,999
- 7$150,000 to $199,999
- 4$200,000 or more

Distribution of owner-occupied house/condo value
![Distribution of owner-occupied house/condo value]()
- 6Less than $50,000
- 6$50,000 to $99,999
- 24$100,000 to $149,999
- 67$150,000 to $199,999
- 29$200,000 to $249,999
- 81$250,000 to $299,999
- 10$300,000 to $399,999

Distribution of rent paid by renters
![Distribution of rent paid by renters]()
- 14Less than $100
- 17$200 to $299
- 35$400 to $499
- 21$500 to $599
- 90$600 to $699
- 22$700 to $799
- 22$800 to $899
- 22$900 to $999
- 130$1,000 to $1,249
- 17$1,250 to $1,499
- 13$1,500 to $1,999

Median rent in 2022:
| Marimont: | $1,077 |
| Chattanooga: | $1,009 |
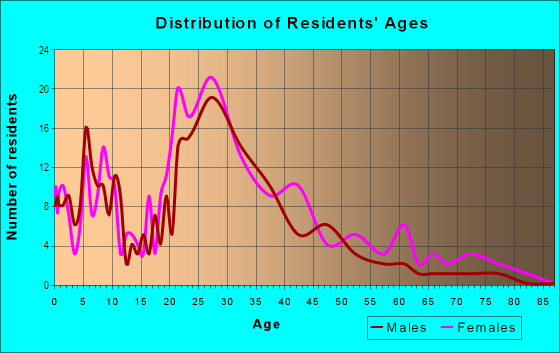
| Males: | 493 |
| Females: | 537 |
Males:
| This neighborhood: | 34.7 years |
| Whole city: | 35.0 years |
| This neighborhood: | 45.8 years |
| Whole city: | 37.5 years |
Average household size:
| Marimont: | 2.5 people |
| Chattanooga: | 2.3 people |
Percentage of family households:
| Marimont: | 55.7% |
| Chattanooga: | 38.2% |
| Here: | 35.6% |
| Chattanooga: | 38.8% |
Percentage of married-couple families with children (among all households):
| Marimont: | 30.1% |
| Chattanooga: | 26.7% |
Percentage of single-mother households (among all households):
| Marimont: | 7.2% |
| Chattanooga: | 13.0% |
Percentage of never married males 15 years old and over:
Percentage of never married females 15 years old and over:
| Marimont: | 29.4% |
| Chattanooga: | 19.0% |
Percentage of never married females 15 years old and over:
| Marimont: | 22.2% |
| city: | 17.6% |
Percentage of people that speak English not well or not at all:
| Marimont: | 3.6% |
| Chattanooga: | 2.8% |
Percentage of people born in this state:
Percentage of people born in another U.S. state:
Percentage of native residents but born outside the U.S.:
Percentage of foreign born residents:
| Here: | 52.2% |
| Chattanooga: | 54.4% |
Percentage of people born in another U.S. state:
| Marimont: | 39.7% |
| Chattanooga: | 37.8% |
Percentage of native residents but born outside the U.S.:
| Here: | 1.2% |
| city: | 0.8% |
Percentage of foreign born residents:
| Here: | 6.9% |
| Chattanooga: | 6.9% |
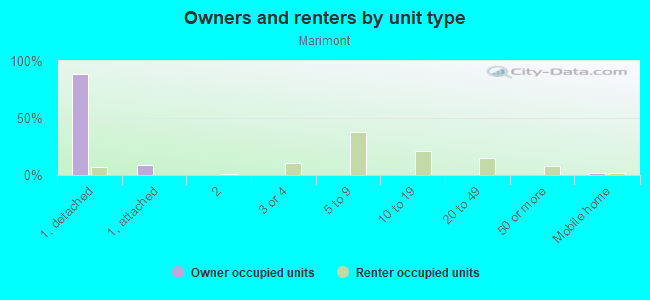
Owner-occupied
Renter-occupied

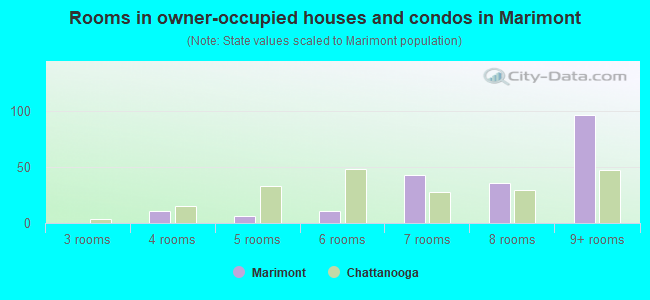
- Rooms in owner-occupied houses and condos in Marimont
- 01 room
- 02 rooms
- 03 rooms
- 114 rooms
- 65 rooms
- 116 rooms
- 437 rooms
- 368 rooms
- 969+ rooms
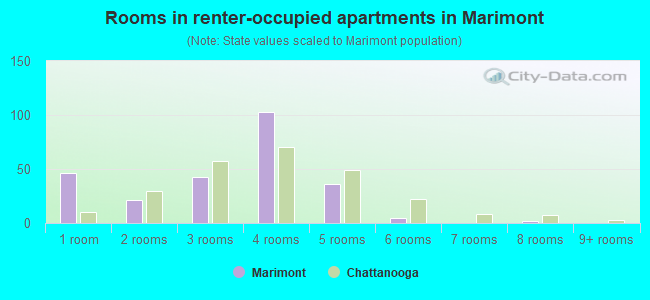
- Rooms in renter-occupied apartments in Marimont
- 461 room
- 212 rooms
- 433 rooms
- 1034 rooms
- 365 rooms
- 56 rooms
- 07 rooms
- 28 rooms
- 09+ rooms
Owner-occupied
Renter-occupied
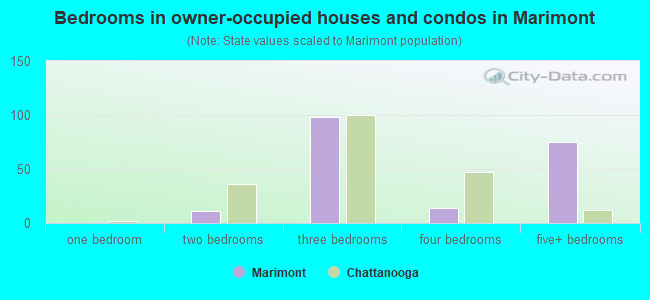
- Bedrooms in owner-occupied houses and condos in Marimont
- 0no bedroom
- 01 bedroom
- 112 bedrooms
- 983 bedrooms
- 144 bedrooms
- 755+ bedrooms
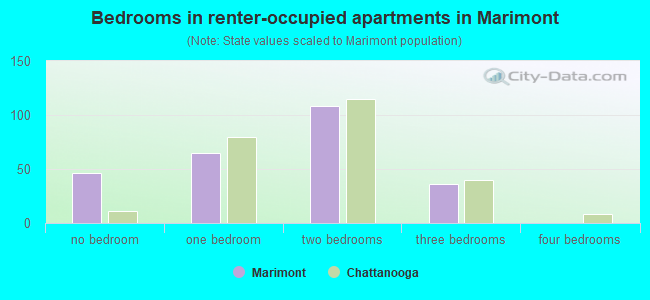
- Bedrooms in renter-occupied apartments in Marimont
- 46no bedroom
- 651 bedroom
- 1082 bedrooms
- 363 bedrooms
- 04 bedrooms
- 05+ bedrooms
Average number of cars or other vehicles available in houses/condos:
Average number of cars or other vehicles available in apartments:
| This neighborhood: | 3.1 |
| Chattanooga: | 2.1 |
Average number of cars or other vehicles available in apartments:
| Here: | 1.4 |
| city: | 1.3 |
Percentage of units with a mortgage:
| Marimont: | 85.6% |
| Chattanooga: | 57.5% |
Housing prices:
- Average estimated value of detached houses in 2022 (57.0% of all units):
Marimont: $207,457 Tennessee: $374,382
- Average estimated value of townhouses or other attached units in 2022 (3.3% of all units):
This neighborhood: $193,900 Tennessee: $354,101
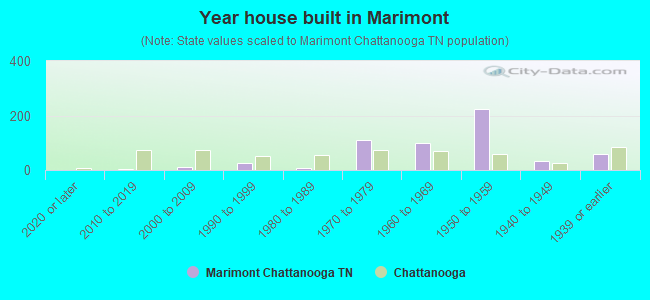
- Year house built in Marimont
- 02020 or later
- 32010 to 2019
- 112000 to 2009
- 251990 to 1999
- 61980 to 1989
- 1111970 to 1979
- 1001960 to 1969
- 2251950 to 1959
- 341940 to 1949
- 581939 or earlier
City-data.com crime index for city in 2020 (higher means more crime):
| City: | 696.9 |
| U.S. average: | 219.5 |
Travel time to work (commute)
![Travel time to work (commute)]()
- 7Less than 5 minutes
- 1535 to 9 minutes
- 7610 to 14 minutes
- 14615 to 19 minutes
- 10020 to 24 minutes
- 6425 to 29 minutes
- 3930 to 34 minutes
- 735 to 39 minutes
- 1745 to 59 minutes
- 160 to 89 minutes

Means of transportation to work
![Means of transportation to work]()
- 73.8%540Drove a car alone
- 7.5%55Carpooled
- 7.1%52Taxi
- 6.0%44Bicycle
- 0.1%1Walked
- 2.9%21Other means
- 2.0%15Worked at home

Time leaving home to go to work
![Time leaving home to go to work]()
- 7312:00 a.m. to 4:59 a.m.
- 75:30 a.m. to 5:59 a.m.
- 576:00 a.m. to 6:29 a.m.
- 706:30 a.m. to 6:59 a.m.
- 787:00 a.m. to 7:29 a.m.
- 417:30 a.m. to 7:59 a.m.
- 318:00 a.m. to 8:29 a.m.
- 188:30 a.m. to 8:59 a.m.
- 669:00 a.m. to 9:59 a.m.
- 110:00 a.m. to 10:59 a.m.
- 1311:00 a.m. to 11:59 a.m.
- 4912:00 p.m. to 3:59 p.m.
- 954:00 p.m. to 11:59 p.m.

Occupations of males:
- Percentage of males in management occupations (except farmers):
Here: 9.0% city: 10.9%
- Percentage of males in business and financial operations occupations:
Here: 2.0% city: 5.8%
- Percentage of males in legal occupations:
Here: 3.2% city: 1.4%
- Percentage of males in education, training, and library occupations:
Here: 2.2% city: 3.2%
- Percentage of males in healthcare practitioners and technical occupations:
Here: 9.2% city: 3.8%
- Percentage of males in service occupations:
Here: 22.6% city: 15.6%
- Percentage of males in sales and office occupations:
Here: 5.5% city: 15.6%
- Percentage of males in construction, extraction, and maintenance occupations:
Here: 16.6% city: 7.1%
- Percentage of males in production occupations:
Here: 19.0% city: 9.6%
- Percentage of males in transportation occupations:
Here: 20.4% city: 5.4%
- Percentage of males in material moving occupations:
Here: 18.0% city: 6.7%
Occupations of females:
- Percentage of females in management occupations (except farmers):
Here: 17.8% city: 8.1%
- Percentage of females in business and financial operations occupations:
Here: 8.9% city: 6.7%
- Percentage of females in community and social services occupations:
Here: 12.3% city: 4.0%
- Percentage of females in arts, design, entertainment, sports, and media occupations:
Here: 1.6% city: 2.6%
- Percentage of females in healthcare practitioners and technical occupations:
Here: 1.6% city: 11.4%
- Percentage of females in service occupations:
Here: 26.5% city: 21.6%
- Percentage of females in sales and office occupations:
Here: 26.0% city: 25.1%
- Percentage of females in production occupations:
Here: 5.3% city: 4.9%
- Percentage of females in material moving occupations:
Here: 3.7% city: 2.2%
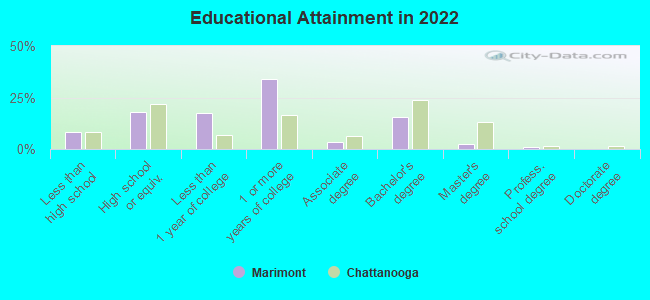
Education in this neighborhood (subdivision or community):
- Percentage of people 3 years and older in K-12 schools:
Marimont: 24.8% Chattanooga: 14.8%
- Percentage of people 3 years and older in undergraduate colleges:
Marimont: 2.5% Chattanooga: 6.2%
- Percentage of people 3 years and older in grad. or professional schools:
Marimont: 1.2% Chattanooga: 0.9%
- Percentage of students K-12 enrolled in private schools:
Marimont: 7.5% Chattanooga: 15.8%
Percentage of population below poverty level:
| Marimont: | 29.8% |
| Chattanooga: | 15.3% |
Median year owner moved in (as recorded in 2022):
Median year renter moved in (as recorded in 2022):
| Marimont: | 2013 |
| Chattanooga: | 2012 |
Median year renter moved in (as recorded in 2022):
| Marimont: | 2019 |
| Chattanooga: | 2021 |
Percentage of married-couple families with both working:
| Marimont: | 100.0% |
| Chattanooga: | 77.2% |
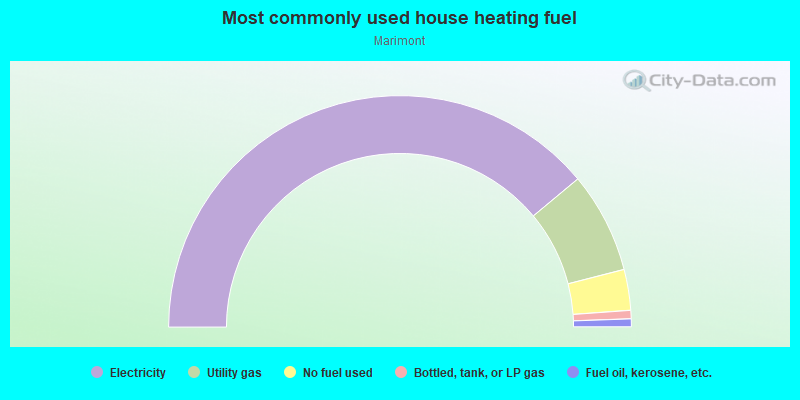
- 78.0%Electricity
- 14.1%Utility gas
- 5.7%No fuel used
- 1.2%Bottled, tank, or LP gas
- 1.1%Fuel oil, kerosene, etc.
Limited-access highways (interstate or state) in this neighborhood:
I- 75
Length: 0.93 miles
Directions: E-W, SW-NE
Directions: E-W, SW-NE
Highways in this neighborhood:
E Brainerd Rd (State Hwy 320)
Length: 0.71 miles
Directions: E-W, SE-NW
Directions: E-W, SE-NW
Roads and streets:
Franklin Dr
Length: 0.47 miles
Directions: E-W, N-S, SW-NE
Address range: 1200 to 1399
Directions: E-W, N-S, SW-NE
Address range: 1200 to 1399
Mari Jon Dr
Length: 0.46 miles
Directions: E-W, N-S, SE-NW, SW-NE
Address range: 1200 to 1399
Directions: E-W, N-S, SE-NW, SW-NE
Address range: 1200 to 1399
Timber Knoll Dr
Length: 0.36 miles
Directions: E-W, N-S, SE-NW, SW-NE
Address range: 100 to 299
Directions: E-W, N-S, SE-NW, SW-NE
Address range: 100 to 299
Roselawn Dr
Length: 0.35 miles
Directions: E-W, N-S, SE-NW, SW-NE
Address range: 1000 to 1199
Directions: E-W, N-S, SE-NW, SW-NE
Address range: 1000 to 1199
Timber Knoll Cir
Length: 0.25 miles
Directions: E-W, N-S, SE-NW, SW-NE
Address range: 104 to 199
Directions: E-W, N-S, SE-NW, SW-NE
Address range: 104 to 199
Dave L Brown Rd
Length: 0.24 miles
Directions: N-S, SE-NW
Address range: 1100 to 1199
Directions: N-S, SE-NW
Address range: 1100 to 1199
Danby Dr
Length: 0.18 miles
Directions: E-W, SE-NW, SW-NE
Address range: 6600 to 6699
Directions: E-W, SE-NW, SW-NE
Address range: 6600 to 6699
Alhambra Dr
Length: 0.17 miles
Directions: E-W, SE-NW, SW-NE
Address range: 1000 to 1099
Directions: E-W, SE-NW, SW-NE
Address range: 1000 to 1099
la Brea Dr
Length: 0.16 miles
Direction: SW-NE
Address range: 1300 to 1499
Direction: SW-NE
Address range: 1300 to 1499
Mari Mont Dr
Length: 0.15 miles
Directions: N-S, SW-NE
Address range: 1300 to 1399
Directions: N-S, SW-NE
Address range: 1300 to 1399
Glenbury Cir
Length: 0.12 miles
Directions: E-W, SE-NW
Address range: 6700 to 6799
Directions: E-W, SE-NW
Address range: 6700 to 6799
Green Rd
Length: 0.11 miles
Directions: E-W, SE-NW
Address range: 6611 to 6699
Directions: E-W, SE-NW
Address range: 6611 to 6699
Hickory Valley Rd
Length: 0.02 miles
Directions: N-S, SE-NW
Directions: N-S, SE-NW
Railroad features:
Louisville and Nashville RR
Length: 0.02 miles
Direction: SE-NW
Direction: SE-NW