Max Serlin neighborhood in Trenton, Michigan (MI), 48183 detailed profile
Settings
X


Business Search - 14 Million verified businesses
Area: 0.310 square miles
Population: 1,132
Population density:
| Max Serlin: | 3,648 people per square mile |
| Trenton: | 2,523 people per square mile |

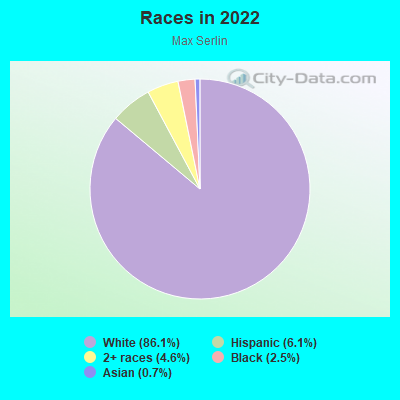
- 97386.1%White
- 696.1%Hispanic or Latino
- 524.6%Two or more races
- 282.5%Black
- 80.7%Asian
Median household income in 2022:
| Max Serlin: | $89,688 |
| Trenton: | $74,267 |
Distribution of median household income
![Distribution of median household income]()
- 12Less than $10,000
- 24$10,000 to $19,999
- 65$20,000 to $29,999
- 16$30,000 to $39,999
- 66$40,000 to $49,999
- 27$50,000 to $59,999
- 37$60,000 to $74,999
- 73$75,000 to $99,999
- 97$100,000 to $124,999
- 39$125,000 to $149,999
- 55$150,000 to $199,999
- 16$200,000 or more

Distribution of owner-occupied house/condo value
![Distribution of owner-occupied house/condo value]()
- 6Less than $50,000
- 7$50,000 to $99,999
- 21$100,000 to $149,999
- 175$150,000 to $199,999
- 94$200,000 to $249,999
- 83$250,000 to $299,999
- 25$300,000 to $399,999

Distribution of rent paid by renters
![Distribution of rent paid by renters]()
- 22$500 to $599
- 14$600 to $699
- 62$700 to $799
- 31$800 to $899
- 5$900 to $999
- 6$1,500 to $1,999

Median rent in 2022:
| Max Serlin: | $755 |
| Trenton: | $722 |
| Males: | 576 |
| Females: | 555 |
Males:
| This neighborhood: | 47.0 years |
| Whole city: | 46.1 years |
| This neighborhood: | 52.8 years |
| Whole city: | 52.8 years |
Average household size:
| Max Serlin: | 2.2 people |
| Trenton: | 2.3 people |
Percentage of family households:
| Max Serlin: | 41.9% |
| Trenton: | 41.2% |
| Here: | 47.3% |
| Trenton: | 45.9% |
Percentage of married-couple families with children (among all households):
| Max Serlin: | 33.3% |
| Trenton: | 31.1% |
Percentage of single-mother households (among all households):
| Max Serlin: | 1.6% |
| Trenton: | 8.9% |
Percentage of never married males 15 years old and over:
Percentage of never married females 15 years old and over:
| Max Serlin: | 19.9% |
| Trenton: | 13.7% |
Percentage of never married females 15 years old and over:
| Max Serlin: | 9.6% |
| city: | 11.4% |
Percentage of people that speak English not well or not at all:
| Max Serlin: | 0.0% |
| Trenton: | 0.2% |
Percentage of people born in this state:
Percentage of people born in another U.S. state:
Percentage of native residents but born outside the U.S.:
Percentage of foreign born residents:
| Here: | 84.4% |
| Trenton: | 84.5% |
Percentage of people born in another U.S. state:
| Max Serlin: | 12.5% |
| Trenton: | 11.0% |
Percentage of native residents but born outside the U.S.:
| Here: | 0.3% |
| city: | 0.8% |
Percentage of foreign born residents:
| Here: | 2.8% |
| Trenton: | 3.7% |
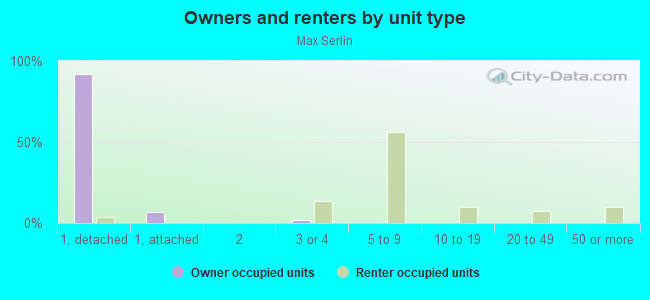
Owner-occupied
Renter-occupied

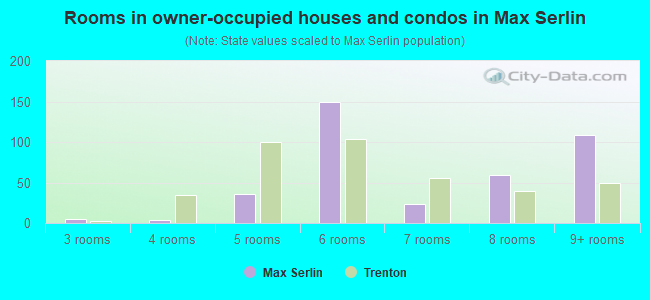
- Rooms in owner-occupied houses and condos in Max Serlin
- 01 room
- 02 rooms
- 53 rooms
- 44 rooms
- 365 rooms
- 1496 rooms
- 247 rooms
- 598 rooms
- 1099+ rooms
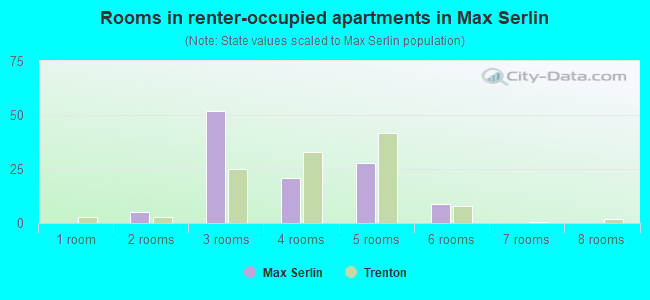
- Rooms in renter-occupied apartments in Max Serlin
- 01 room
- 52 rooms
- 523 rooms
- 214 rooms
- 285 rooms
- 96 rooms
- 07 rooms
- 08 rooms
- 09+ rooms
Owner-occupied
Renter-occupied
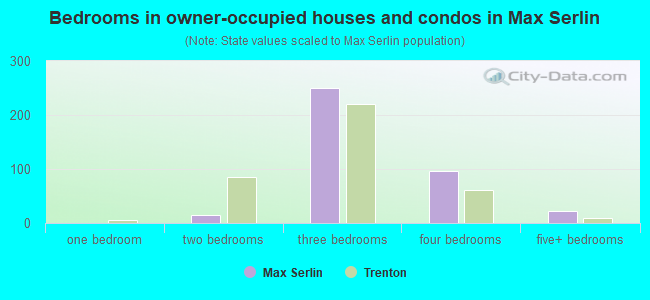
- Bedrooms in owner-occupied houses and condos in Max Serlin
- 0no bedroom
- 01 bedroom
- 142 bedrooms
- 2503 bedrooms
- 974 bedrooms
- 225+ bedrooms
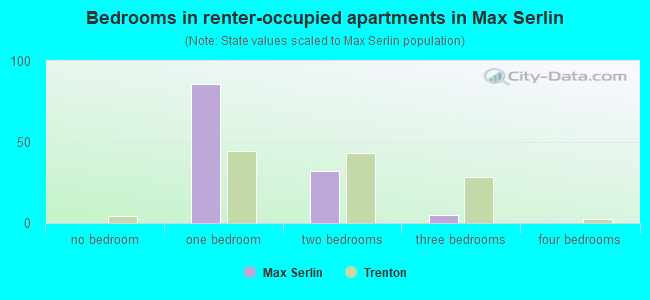
- Bedrooms in renter-occupied apartments in Max Serlin
- 0no bedroom
- 861 bedroom
- 322 bedrooms
- 53 bedrooms
- 04 bedrooms
- 05+ bedrooms
Average number of cars or other vehicles available in houses/condos:
Average number of cars or other vehicles available in apartments:
| This neighborhood: | 2.0 |
| Trenton: | 1.8 |
Average number of cars or other vehicles available in apartments:
| Here: | 1.0 |
| city: | 1.3 |
Percentage of units with a mortgage:
| Max Serlin: | 47.6% |
| Trenton: | 53.5% |
Average estimated value of detached houses in 2022 (76.5% of all units):
| Max Serlin: | $214,072 |
| Michigan: | $280,038 |
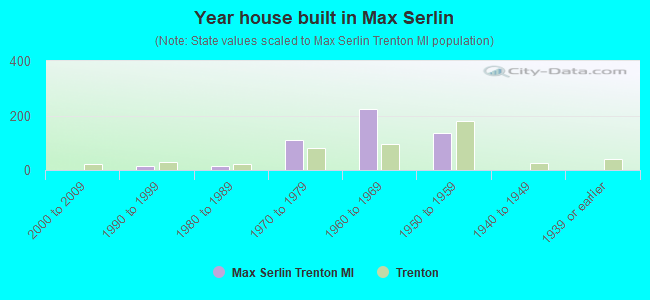
- Year house built in Max Serlin
- 02020 or later
- 02010 to 2019
- 02000 to 2009
- 161990 to 1999
- 151980 to 1989
- 1111970 to 1979
- 2231960 to 1969
- 1341950 to 1959
- 01940 to 1949
- 01939 or earlier
City-data.com crime index for city in 2020 (higher means more crime):
| City: | 78.1 |
| U.S. average: | 219.5 |
Travel time to work (commute)
![Travel time to work (commute)]()
- 915 to 9 minutes
- 10610 to 14 minutes
- 7415 to 19 minutes
- 8720 to 24 minutes
- 4225 to 29 minutes
- 8930 to 34 minutes
- 535 to 39 minutes
- 2240 to 44 minutes
- 2245 to 59 minutes
- 3160 to 89 minutes
- 490 or more minutes

Means of transportation to work
![Means of transportation to work]()
- 74.4%422Drove a car alone
- 5.5%31Carpooled
- 3.9%22Walked
- 15.9%90Worked at home

Time leaving home to go to work
![Time leaving home to go to work]()
- 1112:00 a.m. to 4:59 a.m.
- 295:00 a.m. to 5:29 a.m.
- 395:30 a.m. to 5:59 a.m.
- 426:00 a.m. to 6:29 a.m.
- 466:30 a.m. to 6:59 a.m.
- 607:00 a.m. to 7:29 a.m.
- 867:30 a.m. to 7:59 a.m.
- 268:00 a.m. to 8:29 a.m.
- 588:30 a.m. to 8:59 a.m.
- 319:00 a.m. to 9:59 a.m.
- 2510:00 a.m. to 10:59 a.m.
- 311:00 a.m. to 11:59 a.m.
- 7612:00 p.m. to 3:59 p.m.
- 414:00 p.m. to 11:59 p.m.

Occupations of males:
- Percentage of males in management occupations (except farmers):
Here: 24.8% city: 10.5%
- Percentage of males in business and financial operations occupations:
Here: 1.3% city: 5.0%
- Percentage of males in computer and mathematical occupations:
Here: 1.9% city: 3.2%
- Percentage of males in architecture and engineering occupations:
Here: 3.5% city: 5.3%
- Percentage of males in life, physical, and social science occupations:
Here: 1.7% city: 0.2%
- Percentage of males in community and social services occupations:
Here: 2.8% city: 1.6%
- Percentage of males in arts, design, entertainment, sports, and media occupations:
Here: 2.6% city: 1.7%
- Percentage of males in service occupations:
Here: 9.9% city: 15.4%
- Percentage of males in sales and office occupations:
Here: 13.4% city: 15.5%
- Percentage of males in construction, extraction, and maintenance occupations:
Here: 7.3% city: 8.9%
- Percentage of males in production occupations:
Here: 15.8% city: 10.8%
- Percentage of males in transportation occupations:
Here: 3.5% city: 4.9%
- Percentage of males in material moving occupations:
Here: 8.9% city: 6.0%
Occupations of females:
- Percentage of females in management occupations (except farmers):
Here: 5.3% city: 8.5%
- Percentage of females in business and financial operations occupations:
Here: 3.7% city: 5.9%
- Percentage of females in computer and mathematical occupations:
Here: 2.3% city: 1.8%
- Percentage of females in community and social services occupations:
Here: 5.8% city: 1.9%
- Percentage of females in legal occupations:
Here: 5.3% city: 1.3%
- Percentage of females in education, training, and library occupations:
Here: 14.4% city: 10.9%
- Percentage of females in healthcare practitioners and technical occupations:
Here: 11.9% city: 9.8%
- Percentage of females in service occupations:
Here: 12.1% city: 18.7%
- Percentage of females in sales and office occupations:
Here: 32.3% city: 30.3%
- Percentage of females in transportation occupations:
Here: 6.7% city: 2.6%
Education in this neighborhood (subdivision or community):
- Percentage of people 3 years and older in K-12 schools:
Max Serlin: 17.2% Trenton: 15.4%
- Percentage of people 3 years and older in undergraduate colleges:
Max Serlin: 3.7% Trenton: 4.1%
- Percentage of people 3 years and older in grad. or professional schools:
Max Serlin: 0.4% Trenton: 0.9%
- Percentage of students K-12 enrolled in private schools:
Max Serlin: 0.0% Trenton: 12.0%
Percentage of population below poverty level:
| Max Serlin: | 2.4% |
| Trenton: | 6.7% |
Median year owner moved in (as recorded in 2022):
Median year renter moved in (as recorded in 2022):
| Max Serlin: | 1997 |
| Trenton: | 2005 |
Median year renter moved in (as recorded in 2022):
| Max Serlin: | 2015 |
| Trenton: | 2014 |
Percentage of married-couple families with both working:
| Max Serlin: | 90.2% |
| Trenton: | 76.3% |
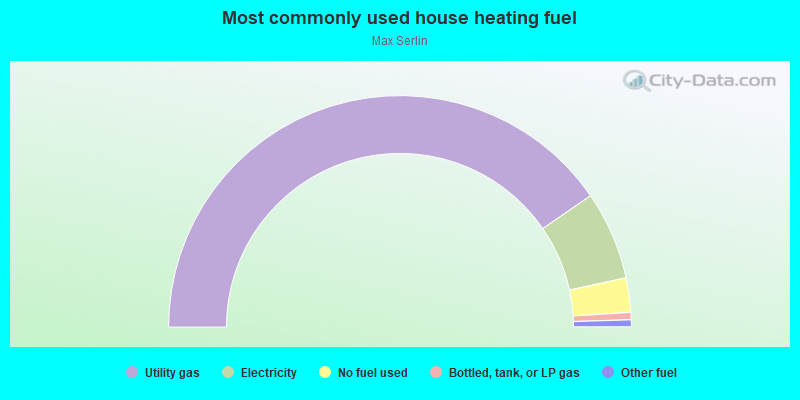
- 80.8%Utility gas
- 12.4%Electricity
- 4.8%No fuel used
- 1.0%Bottled, tank, or LP gas
- 1.0%Other fuel
Highways in this neighborhood:
State Hwy 85 (Fort St)
Length: 1.36 miles
Direction: SW-NE
Address range: 4500 to 4899
Direction: SW-NE
Address range: 4500 to 4899
Roads and streets:
Van Horn Rd
Length: 0.83 miles
Direction: E-W
Address range: 2900 to 3799
Direction: E-W
Address range: 2900 to 3799
Jackson St
Length: 0.47 miles
Directions: E-W, N-S, SW-NE
Address range: 4600 to 5199
Directions: E-W, N-S, SW-NE
Address range: 4600 to 5199
Valley Rd
Length: 0.42 miles
Directions: N-S, SE-NW, SW-NE
Address range: 4520 to 4999
Directions: N-S, SE-NW, SW-NE
Address range: 4520 to 4999
Benson St
Length: 0.42 miles
Directions: E-W, SE-NW
Address range: 3300 to 3813
Directions: E-W, SE-NW
Address range: 3300 to 3813
Pare Ln
Length: 0.36 miles
Directions: E-W, N-S, SE-NW, SW-NE
Address range: 3800 to 4799
Directions: E-W, N-S, SE-NW, SW-NE
Address range: 3800 to 4799
Turner St
Length: 0.33 miles
Directions: E-W, N-S, SE-NW
Address range: 3873 to 4801
Directions: E-W, N-S, SE-NW
Address range: 3873 to 4801
Hillcrest Rd
Length: 0.27 miles
Directions: E-W, N-S, SW-NE
Address range: 4700 to 4999
Directions: E-W, N-S, SW-NE
Address range: 4700 to 4999
Forest Ln
Length: 0.25 miles
Direction: N-S
Address range: 4600 to 4899
Direction: N-S
Address range: 4600 to 4899
St Mihiel St
Length: 0.19 miles
Directions: E-W, SE-NW
Address range: 3348 to 3499
Directions: E-W, SE-NW
Address range: 3348 to 3499
Colonial Ln
Length: 0.13 miles
Directions: E-W, N-S, SW-NE
Address range: 4500 to 4699
Directions: E-W, N-S, SW-NE
Address range: 4500 to 4699
Johnson St
Length: 0.08 miles
Directions: E-W, SE-NW
Address range: 3400 to 3599
Directions: E-W, SE-NW
Address range: 3400 to 3599
Valley Ct
Length: 0.07 miles
Direction: E-W
Address range: 3300 to 3999
Direction: E-W
Address range: 3300 to 3999
Tomson St
Length: 0.07 miles
Direction: E-W
Address range: 3300 to 3399
Direction: E-W
Address range: 3300 to 3399
Evans Ct
Length: 0.06 miles
Direction: N-S
Address range: 4800 to 4899
Direction: N-S
Address range: 4800 to 4899
Clark Ct
Length: 0.06 miles
Direction: N-S
Address range: 4800 to 4899
Direction: N-S
Address range: 4800 to 4899
Hillcrest Ct
Length: 0.06 miles
Direction: N-S
Address range: 5000 to 5099
Direction: N-S
Address range: 5000 to 5099
Coucy Ave
Length: 0.05 miles
Directions: E-W, N-S, SE-NW
Directions: E-W, N-S, SE-NW
Other features:
No 1 Drn
Length: 0.51 miles
Directions: E-W, N-S, SE-NW
Directions: E-W, N-S, SE-NW
Frank and Poet Drn
Length: 0.18 miles
Directions: N-S, SE-NW, SW-NE
Directions: N-S, SE-NW, SW-NE