Mc Kuen neighborhood in San Jose, California (CA), 95123 detailed profile
Settings
X


Business Search - 14 Million verified businesses
Area: 0.134 square miles
Population: 1,139
Population density:
| Mc Kuen: | 8,470 people per square mile |
| San Jose: | 5,554 people per square mile |

- 39634.4%Asian
- 38633.5%White
- 28024.3%Hispanic or Latino
- 756.5%Two or more races
- 100.9%Black
- 40.3%Some other race

Median household income in 2022:
| Mc Kuen: | $196,014 |
| San Jose: | $133,835 |
Distribution of median household income
![Distribution of median household income]()
- 21Less than $10,000
- 6$10,000 to $19,999
- 8$20,000 to $29,999
- 14$30,000 to $39,999
- 18$40,000 to $49,999
- 7$50,000 to $59,999
- 46$60,000 to $74,999
- 3$75,000 to $99,999
- 41$100,000 to $124,999
- 9$125,000 to $149,999
- 55$150,000 to $199,999
- 146$200,000 or more

Distribution of owner-occupied house/condo value
![Distribution of owner-occupied house/condo value]()
- 3$300,000 to $399,999
- 15$500,000 to $749,999
- 45$750,000 to $999,999
- 180$1,000,000 or more

Distribution of rent paid by renters
![Distribution of rent paid by renters]()
- 7Less than $100
- 8$500 to $599
- 3$1,000 to $1,249
- 19$1,250 to $1,499
- 21$1,500 to $1,999
- 105$2,000 or more

Median rent in 2022:
| Mc Kuen: | $2,856 |
| San Jose: | $2,001 |
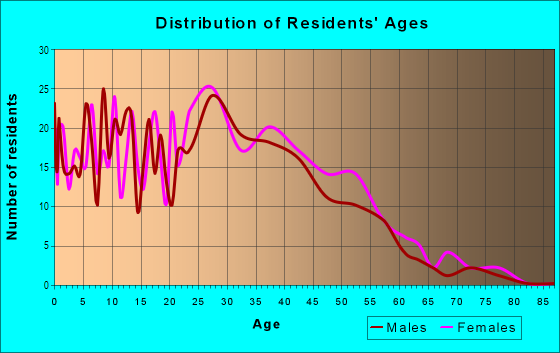
| Males: | 528 |
| Females: | 610 |
Males:
| This neighborhood: | 41.3 years |
| Whole city: | 37.6 years |
| This neighborhood: | 40.7 years |
| Whole city: | 39.1 years |
Average household size:
| Mc Kuen: | 3.6 people |
| San Jose: | 2.9 people |
Percentage of family households:
| Mc Kuen: | 68.1% |
| San Jose: | 49.9% |
| Here: | 85.7% |
| San Jose: | 53.0% |
Percentage of married-couple families with children (among all households):
| Mc Kuen: | 25.9% |
| San Jose: | 25.8% |
Percentage of single-mother households (among all households):
| Mc Kuen: | 1.7% |
| San Jose: | 5.2% |
Percentage of never married males 15 years old and over:
Percentage of never married females 15 years old and over:
| Mc Kuen: | 12.3% |
| San Jose: | 20.9% |
Percentage of never married females 15 years old and over:
| Mc Kuen: | 21.5% |
| city: | 16.7% |
Percentage of people that speak English not well or not at all:
| Mc Kuen: | 0.0% |
| San Jose: | 11.4% |
Percentage of people born in this state:
Percentage of people born in another U.S. state:
Percentage of native residents but born outside the U.S.:
Percentage of foreign born residents:
| Here: | 50.1% |
| San Jose: | 46.1% |
Percentage of people born in another U.S. state:
| Mc Kuen: | 13.2% |
| San Jose: | 10.4% |
Percentage of native residents but born outside the U.S.:
| Here: | 0.3% |
| city: | 1.7% |
Percentage of foreign born residents:
| Here: | 36.4% |
| San Jose: | 41.8% |
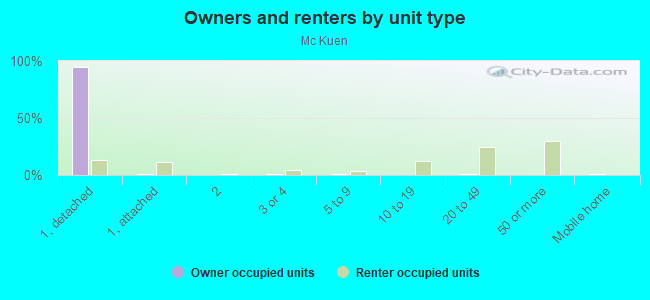
Owner-occupied
Renter-occupied

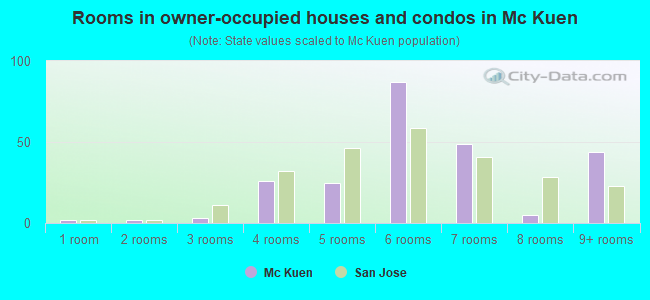
- Rooms in owner-occupied houses and condos in Mc Kuen
- 21 room
- 22 rooms
- 33 rooms
- 264 rooms
- 255 rooms
- 876 rooms
- 497 rooms
- 58 rooms
- 449+ rooms

- Rooms in renter-occupied apartments in Mc Kuen
- 111 room
- 642 rooms
- 543 rooms
- 254 rooms
- 115 rooms
- 126 rooms
- 157 rooms
- 78 rooms
- 29+ rooms
Owner-occupied
Renter-occupied
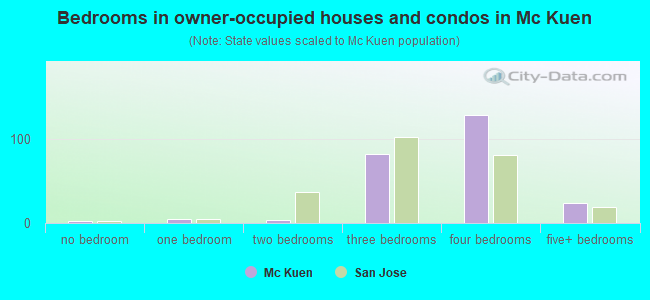
- Bedrooms in owner-occupied houses and condos in Mc Kuen
- 2no bedroom
- 51 bedroom
- 42 bedrooms
- 823 bedrooms
- 1294 bedrooms
- 245+ bedrooms
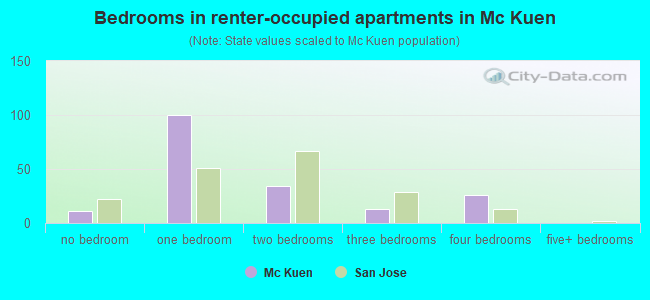
- Bedrooms in renter-occupied apartments in Mc Kuen
- 11no bedroom
- 1001 bedroom
- 342 bedrooms
- 133 bedrooms
- 264 bedrooms
- 05+ bedrooms
Average number of cars or other vehicles available in houses/condos:
Average number of cars or other vehicles available in apartments:
| This neighborhood: | 2.5 |
| San Jose: | 2.3 |
Average number of cars or other vehicles available in apartments:
| Here: | 2.4 |
| city: | 1.6 |
Percentage of units with a mortgage:
| Mc Kuen: | 73.5% |
| San Jose: | 66.9% |
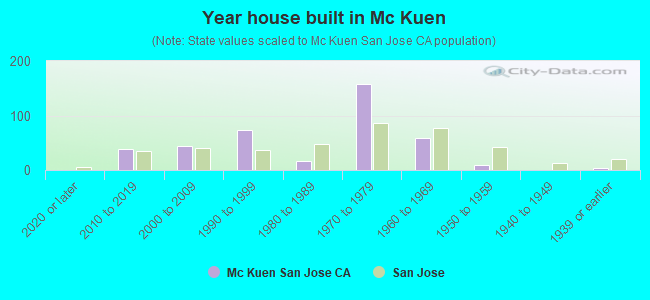
- Year house built in Mc Kuen
- 02020 or later
- 382010 to 2019
- 442000 to 2009
- 741990 to 1999
- 161980 to 1989
- 1581970 to 1979
- 591960 to 1969
- 91950 to 1959
- 01940 to 1949
- 31939 or earlier
City-data.com crime index for city in 2020 (higher means more crime):
| City: | 268.4 |
| U.S. average: | 219.5 |
Travel time to work (commute)
![Travel time to work (commute)]()
- 385 to 9 minutes
- 10010 to 14 minutes
- 5015 to 19 minutes
- 4620 to 24 minutes
- 2825 to 29 minutes
- 7730 to 34 minutes
- 1635 to 39 minutes
- 4840 to 44 minutes
- 4745 to 59 minutes
- 11260 to 89 minutes
- 1990 or more minutes

Means of transportation to work
![Means of transportation to work]()
- 57.6%369Drove a car alone
- 9.2%59Carpooled
- 5.3%34Bus
- 0.9%6Subway or elevated rail
- 0.2%1Bicycle
- 0.3%2Walked
- 1.1%7Other means
- 25.9%166Worked at home

Time leaving home to go to work
![Time leaving home to go to work]()
- 912:00 a.m. to 4:59 a.m.
- 105:00 a.m. to 5:29 a.m.
- 235:30 a.m. to 5:59 a.m.
- 616:30 a.m. to 6:59 a.m.
- 767:00 a.m. to 7:29 a.m.
- 707:30 a.m. to 7:59 a.m.
- 878:00 a.m. to 8:29 a.m.
- 478:30 a.m. to 8:59 a.m.
- 589:00 a.m. to 9:59 a.m.
- 7010:00 a.m. to 10:59 a.m.
- 511:00 a.m. to 11:59 a.m.
- 2912:00 p.m. to 3:59 p.m.
- 444:00 p.m. to 11:59 p.m.

Occupations of males:
- Percentage of males in management occupations (except farmers):
Here: 10.8% city: 13.0%
- Percentage of males in business and financial operations occupations:
Here: 6.6% city: 4.6%
- Percentage of males in computer and mathematical occupations:
Here: 19.3% city: 13.6%
- Percentage of males in architecture and engineering occupations:
Here: 6.7% city: 10.2%
- Percentage of males in arts, design, entertainment, sports, and media occupations:
Here: 1.9% city: 1.8%
- Percentage of males in service occupations:
Here: 14.7% city: 12.7%
- Percentage of males in sales and office occupations:
Here: 14.0% city: 12.8%
- Percentage of males in construction, extraction, and maintenance occupations:
Here: 7.1% city: 7.8%
- Percentage of males in production occupations:
Here: 9.3% city: 5.5%
- Percentage of males in transportation occupations:
Here: 4.0% city: 3.6%
- Percentage of males in material moving occupations:
Here: 1.2% city: 3.1%
Occupations of females:
- Percentage of females in management occupations (except farmers):
Here: 19.2% city: 11.0%
- Percentage of females in business and financial operations occupations:
Here: 4.9% city: 8.6%
- Percentage of females in computer and mathematical occupations:
Here: 10.0% city: 5.4%
- Percentage of females in life, physical, and social science occupations:
Here: 1.4% city: 1.7%
- Percentage of females in community and social services occupations:
Here: 4.1% city: 1.8%
- Percentage of females in education, training, and library occupations:
Here: 11.1% city: 8.1%
- Percentage of females in healthcare practitioners and technical occupations:
Here: 5.9% city: 6.8%
- Percentage of females in service occupations:
Here: 24.6% city: 21.7%
- Percentage of females in sales and office occupations:
Here: 16.0% city: 22.0%
- Percentage of females in material moving occupations:
Here: 2.0% city: 1.5%
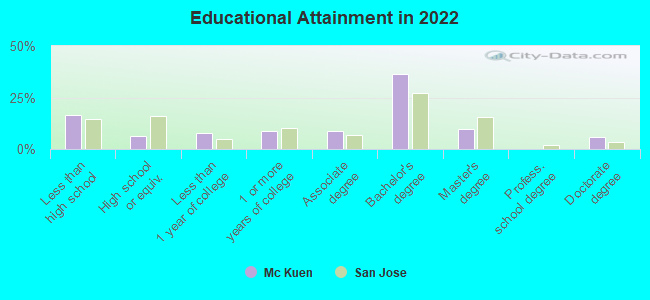
Education in this neighborhood (subdivision or community):
- Percentage of people 3 years and older in K-12 schools:
Mc Kuen: 16.5% San Jose: 16.1%
- Percentage of people 3 years and older in undergraduate colleges:
Mc Kuen: 6.0% San Jose: 6.5%
- Percentage of people 3 years and older in grad. or professional schools:
Mc Kuen: 2.1% San Jose: 2.0%
- Percentage of students K-12 enrolled in private schools:
Mc Kuen: 9.7% San Jose: 14.9%
Percentage of population below poverty level:
| Mc Kuen: | 6.0% |
| San Jose: | 9.0% |
Median year owner moved in (as recorded in 2022):
Median year renter moved in (as recorded in 2022):
| Mc Kuen: | 2006 |
| San Jose: | 2008 |
Median year renter moved in (as recorded in 2022):
| Mc Kuen: | 2014 |
| San Jose: | 2020 |
Percentage of married-couple families with both working:
| Mc Kuen: | 77.0% |
| San Jose: | 72.5% |
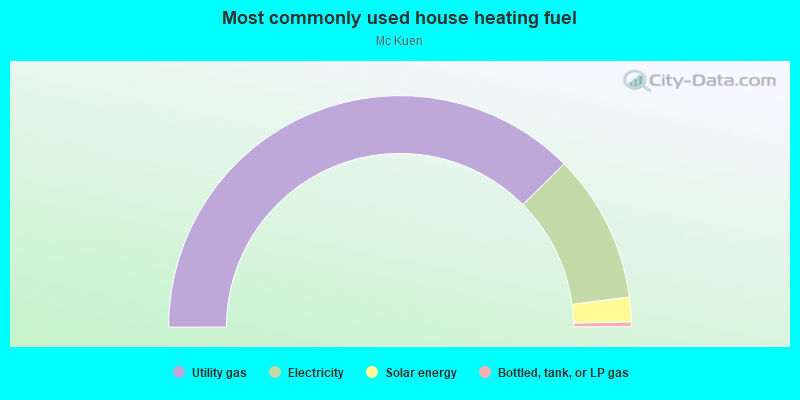
- 75.1%Utility gas
- 20.8%Electricity
- 3.4%Solar energy
- 0.7%Bottled, tank, or LP gas
Roads and streets:
Calmor Ave
Length: 0.38 miles
Directions: E-W, N-S, SE-NW, SW-NE
Address range: 5600 to 5799
Directions: E-W, N-S, SE-NW, SW-NE
Address range: 5600 to 5799
Dailey Ave
Length: 0.30 miles
Direction: E-W
Address range: 700 to 799
Direction: E-W
Address range: 700 to 799
Playa del Rey
Length: 0.28 miles
Directions: N-S, SW-NE
Address range: 5600 to 5731
Directions: N-S, SW-NE
Address range: 5600 to 5731
San Lorenzo Dr
Length: 0.27 miles
Directions: E-W, N-S, SW-NE
Address range: 5600 to 5799
Directions: E-W, N-S, SW-NE
Address range: 5600 to 5799
Warring Dr
Length: 0.24 miles
Directions: E-W, N-S, SW-NE
Address range: 700 to 799
Directions: E-W, N-S, SW-NE
Address range: 700 to 799
Delaware Ave
Length: 0.23 miles
Directions: E-W, SE-NW
Address range: 700 to 799
Directions: E-W, SE-NW
Address range: 700 to 799
Cahalan Ave
Length: 0.17 miles
Direction: N-S
Address range: 5673 to 5749
Direction: N-S
Address range: 5673 to 5749
Wheelsman Pl
Length: 0.11 miles
Directions: E-W, N-S, SE-NW, SW-NE
Address range: 5700 to 5799
Directions: E-W, N-S, SE-NW, SW-NE
Address range: 5700 to 5799
Morton Way
Length: 0.09 miles
Directions: N-S, SW-NE
Address range: 5650 to 5699
Directions: N-S, SW-NE
Address range: 5650 to 5699
Cahalan Ct
Length: 0.05 miles
Direction: E-W
Address range: 700 to 799
Direction: E-W
Address range: 700 to 799
Chemeketa Ct
Length: 0.05 miles
Direction: E-W
Address range: 700 to 799
Direction: E-W
Address range: 700 to 799
Windell Ct
Length: 0.05 miles
Direction: E-W
Address range: 700 to 799
Direction: E-W
Address range: 700 to 799
Calmor Ct
Length: 0.03 miles
Direction: SE-NW
Address range: 5600 to 5798
Direction: SE-NW
Address range: 5600 to 5798
Play del Rey Ct (Playa del Ray)
Length: 0.03 miles
Directions: E-W, SE-NW
Address range: 5615 to 5653
Directions: E-W, SE-NW
Address range: 5615 to 5653