Meat Packing District (Meatpacking District) neighborhood in New York, New York (NY), 10014 detailed profile
Settings
X


Business Search - 14 Million verified businesses
Area: 0.039 square miles
Population: 1,328
Population density:
| Meat Packing District (Meatpacking District): | 34,208 people per square mile |
| New York: | 27,483 people per square mile |

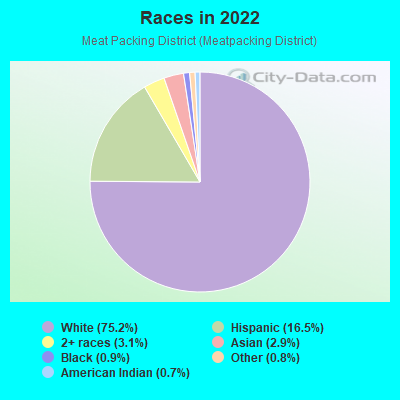
- 1,02575.2%White
- 22516.5%Hispanic or Latino
- 423.1%Two or more races
- 392.9%Asian
- 120.9%Black
- 110.8%Some other race
- 90.7%American Indian
Median household income in 2022:
| Meat Packing District (Meatpacking District): | $209,167 |
| New York: | $74,694 |
Distribution of median household income
![Distribution of median household income]()
- 97Less than $10,000
- 36$10,000 to $19,999
- 30$20,000 to $29,999
- 34$30,000 to $39,999
- 27$40,000 to $49,999
- 209$50,000 to $59,999
- 26$60,000 to $74,999
- 102$75,000 to $99,999
- 52$100,000 to $124,999
- 56$125,000 to $149,999
- 58$150,000 to $199,999
- 394$200,000 or more

Distribution of owner-occupied house/condo value
![Distribution of owner-occupied house/condo value]()
- 36Less than $50,000
- 12$100,000 to $149,999
- 22$300,000 to $399,999
- 18$500,000 to $749,999
- 41$750,000 to $999,999
- 235$1,000,000 or more

Distribution of rent paid by renters
![Distribution of rent paid by renters]()
- 57$200 to $299
- 16$300 to $399
- 13$400 to $499
- 7$500 to $599
- 28$600 to $699
- 7$700 to $799
- 24$800 to $899
- 107$900 to $999
- 15$1,000 to $1,249
- 23$1,250 to $1,499
- 50$1,500 to $1,999
- 447$2,000 or more

Median rent in 2022:
| Meat Packing District (Meatpacking District): | $3,353 |
| New York: | $1,573 |
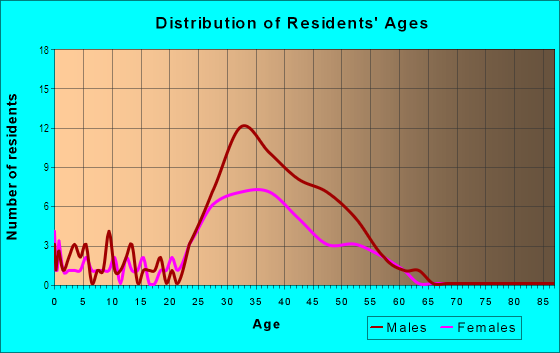
| Males: | 677 |
| Females: | 651 |
Males:
| This neighborhood: | 37.3 years |
| Whole city: | 37.0 years |
| This neighborhood: | 34.6 years |
| Whole city: | 39.8 years |
Average household size:
| Meat Packing District (Meatpacking District): | 1.7 people |
| New York: | 2.4 people |
Percentage of family households:
| Meat Packing District (Meatpacking District): | 28.4% |
| New York: | 38.3% |
| Here: | 30.8% |
| New York: | 34.8% |
Percentage of married-couple families with children (among all households):
| Meat Packing District (Meatpacking District): | 58.5% |
| New York: | 25.9% |
Percentage of single-mother households (among all households):
| Meat Packing District (Meatpacking District): | 18.7% |
| New York: | 11.8% |
Percentage of never married males 15 years old and over:
Percentage of never married females 15 years old and over:
| Meat Packing District (Meatpacking District): | 24.4% |
| New York: | 21.7% |
Percentage of never married females 15 years old and over:
| Meat Packing District (Meatpacking District): | 26.2% |
| city: | 22.4% |
Percentage of people that speak English not well or not at all:
| Meat Packing District (Meatpacking District): | 0.0% |
| New York: | 12.2% |
Percentage of people born in this state:
Percentage of people born in another U.S. state:
Percentage of native residents but born outside the U.S.:
Percentage of foreign born residents:
| Here: | 35.7% |
| New York: | 48.0% |
Percentage of people born in another U.S. state:
| Meat Packing District (Meatpacking District): | 43.4% |
| New York: | 11.7% |
Percentage of native residents but born outside the U.S.:
| Here: | 2.9% |
| city: | 3.6% |
Percentage of foreign born residents:
| Here: | 18.0% |
| New York: | 36.8% |
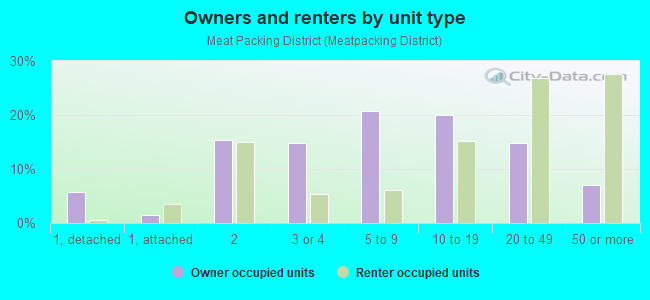
Owner-occupied
Renter-occupied

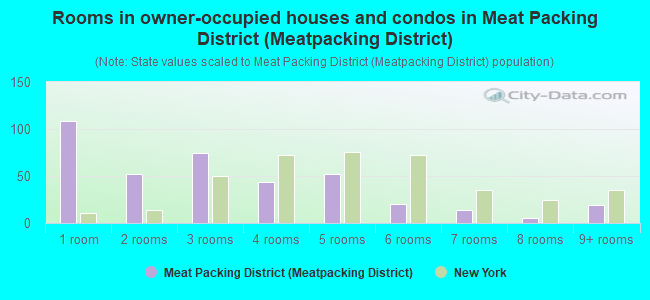
- Rooms in owner-occupied houses and condos in Meat Packing District <
> - 1081 room
- 522 rooms
- 743 rooms
- 444 rooms
- 525 rooms
- 206 rooms
- 147 rooms
- 58 rooms
- 199+ rooms
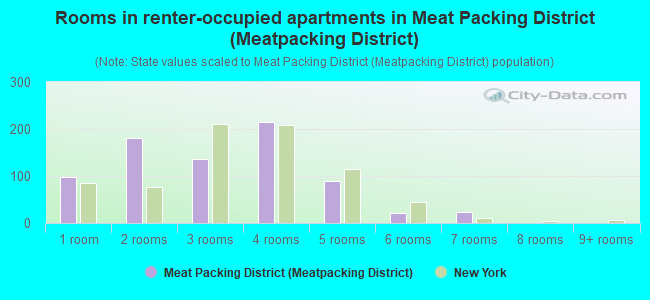
- Rooms in renter-occupied apartments in Meat Packing District <
> - 981 room
- 1812 rooms
- 1363 rooms
- 2144 rooms
- 895 rooms
- 216 rooms
- 237 rooms
- 08 rooms
- 09+ rooms
Owner-occupied
Renter-occupied
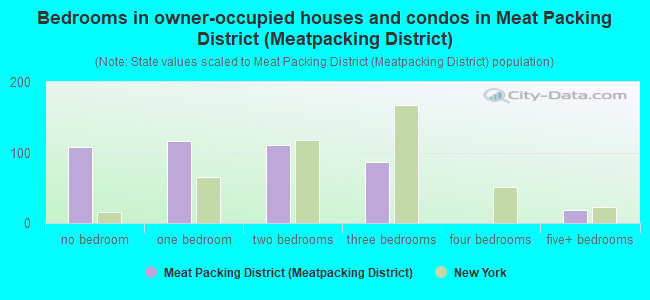
- Bedrooms in owner-occupied houses and condos in Meat Packing District <
> - 108no bedroom
- 1161 bedroom
- 1112 bedrooms
- 873 bedrooms
- 04 bedrooms
- 195+ bedrooms
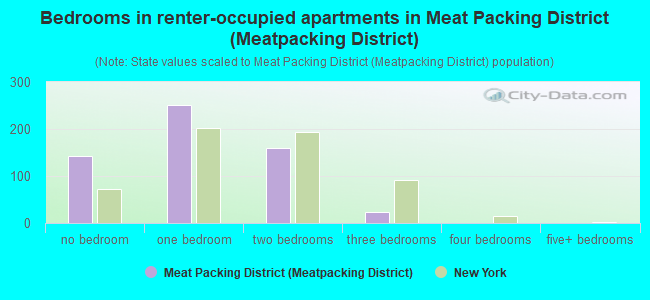
- Bedrooms in renter-occupied apartments in Meat Packing District <
> - 142no bedroom
- 2511 bedroom
- 1602 bedrooms
- 243 bedrooms
- 04 bedrooms
- 05+ bedrooms
Average number of cars or other vehicles available in houses/condos:
Average number of cars or other vehicles available in apartments:
| This neighborhood: | 0.2 |
| New York: | 1.1 |
Average number of cars or other vehicles available in apartments:
| Here: | 0.1 |
| city: | 0.4 |
Percentage of units with a mortgage:
| Meat Packing District (Meatpacking District): | 60.7% |
| New York: | 56.2% |
Average estimated '22 value of housing units in 5-or-more-unit structures (24.7% of all units):
| Meat Packing District (Meatpacking District): | $426,007 |
| New York: | $1,049,248 |
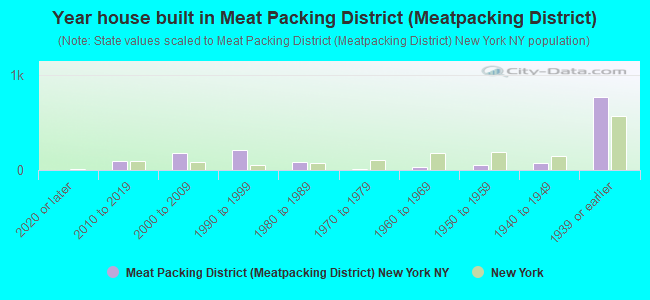
- Year house built in Meat Packing District <
> - 02020 or later
- 962010 to 2019
- 1782000 to 2009
- 2111990 to 1999
- 851980 to 1989
- 121970 to 1979
- 321960 to 1969
- 531950 to 1959
- 751940 to 1949
- 7661939 or earlier
City-data.com crime index for city in 2020 (higher means more crime):
| City: | 229.7 |
| U.S. average: | 219.5 |
Travel time to work (commute)
![Travel time to work (commute)]()
- 7Less than 5 minutes
- 155 to 9 minutes
- 3210 to 14 minutes
- 5215 to 19 minutes
- 16120 to 24 minutes
- 11625 to 29 minutes
- 10030 to 34 minutes
- 1135 to 39 minutes
- 2040 to 44 minutes
- 3345 to 59 minutes
- 5060 to 89 minutes
- 790 or more minutes

Means of transportation to work
![Means of transportation to work]()
- 3.3%30Drove a car alone
- 1.4%13Carpooled
- 7.2%65Bus
- 33.9%308Subway or elevated rail
- 10.2%93Long-distance train or commuter rail
- 2.4%22Ferryboat
- 6.6%60Taxi
- 3.0%27Bicycle
- 12.8%116Walked
- 25.0%227Other means
- 27.6%251Worked at home

Time leaving home to go to work
![Time leaving home to go to work]()
- 1512:00 a.m. to 4:59 a.m.
- 55:30 a.m. to 5:59 a.m.
- 146:00 a.m. to 6:29 a.m.
- 266:30 a.m. to 6:59 a.m.
- 477:00 a.m. to 7:29 a.m.
- 847:30 a.m. to 7:59 a.m.
- 1328:00 a.m. to 8:29 a.m.
- 1278:30 a.m. to 8:59 a.m.
- 1059:00 a.m. to 9:59 a.m.
- 510:00 a.m. to 10:59 a.m.
- 1011:00 a.m. to 11:59 a.m.
- 3012:00 p.m. to 3:59 p.m.
- 134:00 p.m. to 11:59 p.m.

Occupations of males:
- Percentage of males in management occupations (except farmers):
Here: 36.3% city: 11.2%
- Percentage of males in business and financial operations occupations:
Here: 12.3% city: 6.4%
- Percentage of males in computer and mathematical occupations:
Here: 6.8% city: 5.3%
- Percentage of males in architecture and engineering occupations:
Here: 9.3% city: 1.7%
- Percentage of males in life, physical, and social science occupations:
Here: 1.0% city: 1.0%
- Percentage of males in legal occupations:
Here: 1.8% city: 2.1%
- Percentage of males in education, training, and library occupations:
Here: 2.0% city: 4.0%
- Percentage of males in arts, design, entertainment, sports, and media occupations:
Here: 10.1% city: 4.8%
- Percentage of males in healthcare practitioners and technical occupations:
Here: 1.0% city: 3.4%
- Percentage of males in service occupations:
Here: 9.5% city: 18.7%
- Percentage of males in sales and office occupations:
Here: 9.3% city: 15.0%
Occupations of females:
- Percentage of females in management occupations (except farmers):
Here: 33.1% city: 10.4%
- Percentage of females in business and financial operations occupations:
Here: 17.2% city: 7.1%
- Percentage of females in architecture and engineering occupations:
Here: 1.2% city: 0.6%
- Percentage of females in life, physical, and social science occupations:
Here: 2.2% city: 1.2%
- Percentage of females in community and social services occupations:
Here: 1.8% city: 3.0%
- Percentage of females in legal occupations:
Here: 6.7% city: 2.2%
- Percentage of females in arts, design, entertainment, sports, and media occupations:
Here: 14.1% city: 4.9%
- Percentage of females in healthcare practitioners and technical occupations:
Here: 1.7% city: 7.8%
- Percentage of females in service occupations:
Here: 1.4% city: 25.1%
- Percentage of females in sales and office occupations:
Here: 21.3% city: 22.5%
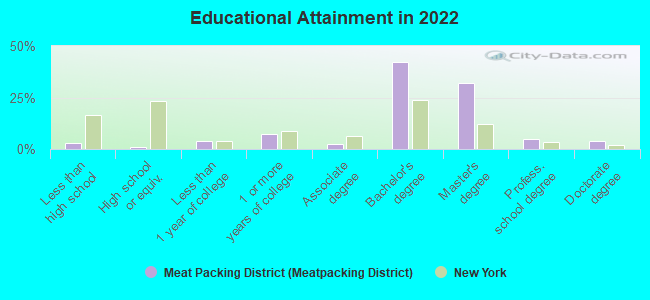
Education in this neighborhood (subdivision or community):
- Percentage of people 3 years and older in K-12 schools:
Meat Packing District (Meatpacking District): 46.1% New York: 15.2%
- Percentage of people 3 years and older in undergraduate colleges:
Meat Packing District (Meatpacking District): 1.6% New York: 5.1%
- Percentage of people 3 years and older in grad. or professional schools:
Meat Packing District (Meatpacking District): 6.6% New York: 2.1%
- Percentage of students K-12 enrolled in private schools:
Meat Packing District (Meatpacking District): 17.5% New York: 19.6%
Percentage of population below poverty level:
| Meat Packing District (Meatpacking District): | 7.2% |
| New York: | 18.3% |
Median year renter moved in (as recorded in 2022):
| Meat Packing District (Meatpacking District): | 2018 |
| New York: | 2016 |
Percentage of married-couple families with both working:
| Meat Packing District (Meatpacking District): | 153.0% |
| New York: | 65.6% |
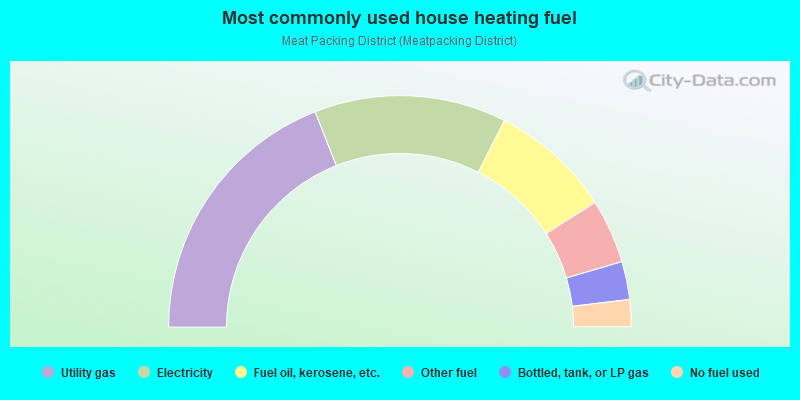
- 38.1%Utility gas
- 26.9%Electricity
- 17.0%Fuel oil, kerosene, etc.
- 9.0%Other fuel
- 5.3%Bottled, tank, or LP gas
- 3.8%No fuel used
Roads and streets:
W 13th St (W 13 St)
Length: 0.36 miles
Directions: E-W, SE-NW
Address range: 309 to 499
Directions: E-W, SE-NW
Address range: 309 to 499
Gansevoort St
Length: 0.29 miles
Direction: E-W
Address range: 1 to 89
Direction: E-W
Address range: 1 to 89
Little W 12th St
Length: 0.15 miles
Direction: SE-NW
Address range: 2 to 42
Direction: SE-NW
Address range: 2 to 42
Washington St
Length: 0.12 miles
Directions: N-S, SW-NE
Address range: 815 to 858
Directions: N-S, SW-NE
Address range: 815 to 858
9 Ave (9th Ave)
Length: 0.07 miles
Direction: SW-NE
Address range: 1 to 27
Direction: SW-NE
Address range: 1 to 27
Hudson St
Length: 0.04 miles
Direction: N-S
Address range: 651 to 667
Direction: N-S
Address range: 651 to 667