Medicine Lake neighborhood in Minneapolis, Minnesota (MN), 55441 detailed profile
Settings
X

Business Search - 14 Million verified businesses
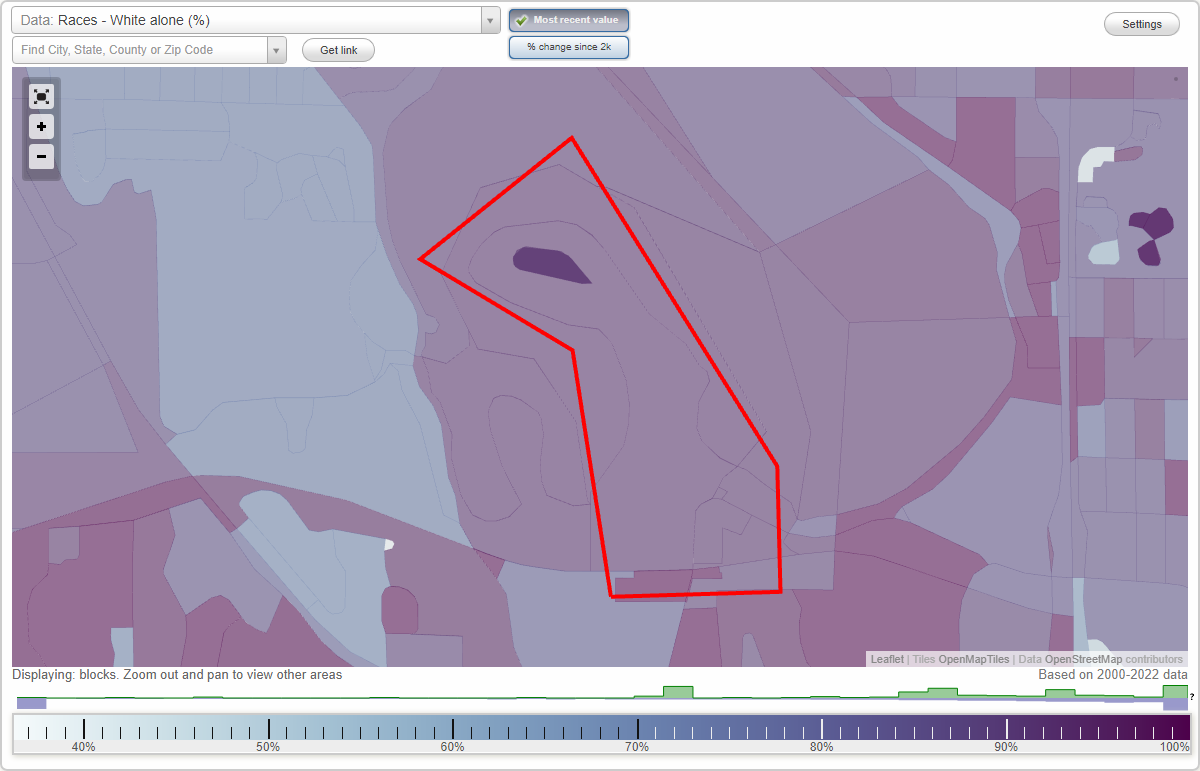
Area: 0.314 square miles
Population: 344
Population density:
| Medicine Lake: | 1,095 people per square mile |
| Minneapolis: | 7,744 people per square mile |

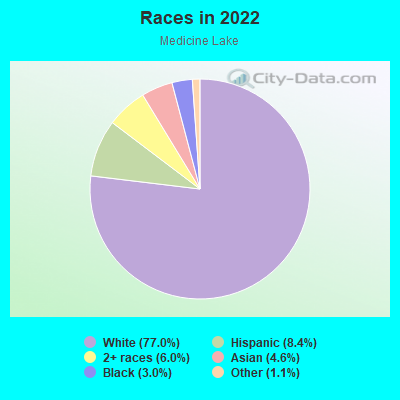
- 28477.0%White
- 318.4%Hispanic or Latino
- 226.0%Two or more races
- 174.6%Asian
- 113.0%Black
- 41.1%Some other race
Median household income in 2022:
| Medicine Lake: | $109,978 |
| Minneapolis: | $74,473 |
Distribution of median household income
![Distribution of median household income]()
- 2Less than $10,000
- 9$10,000 to $19,999
- 12$20,000 to $29,999
- 2$30,000 to $39,999
- 6$40,000 to $49,999
- 10$50,000 to $59,999
- 22$60,000 to $74,999
- 8$75,000 to $99,999
- 8$100,000 to $124,999
- 34$125,000 to $149,999
- 35$150,000 to $199,999
- 26$200,000 or more

Distribution of owner-occupied house/condo value
![Distribution of owner-occupied house/condo value]()
- 7$150,000 to $199,999
- 5$200,000 to $249,999
- 15$250,000 to $299,999
- 20$300,000 to $399,999
- 41$400,000 to $499,999
- 20$500,000 to $749,999
- 3$750,000 to $999,999
- 4$1,000,000 or more

Distribution of rent paid by renters
![Distribution of rent paid by renters]()
- 4$300 to $399
- 4$400 to $499
- 4$700 to $799
- 1$900 to $999
- 1$1,000 to $1,249
- 4$1,250 to $1,499
- 53$1,500 to $1,999
- 29$2,000 or more

Median rent in 2022:
| Medicine Lake: | $2,673 |
| Minneapolis: | $1,159 |
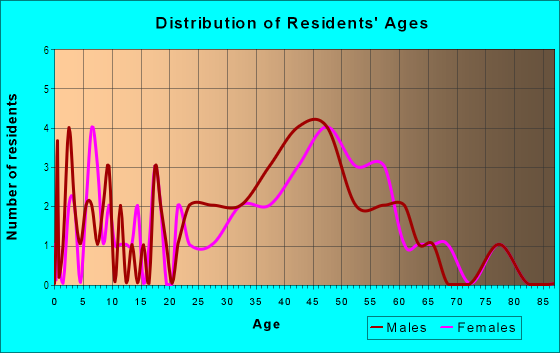
| Males: | 166 |
| Females: | 178 |
Males:
| This neighborhood: | 41.5 years |
| Whole city: | 33.3 years |
| This neighborhood: | 45.1 years |
| Whole city: | 33.2 years |
Average household size:
| Medicine Lake: | 2.4 people |
| Minneapolis: | 2.1 people |
Percentage of family households:
| Medicine Lake: | 41.1% |
| Minneapolis: | 34.1% |
| Here: | 47.1% |
| Minneapolis: | 29.8% |
Percentage of married-couple families with children (among all households):
| Medicine Lake: | 39.7% |
| Minneapolis: | 31.8% |
Percentage of single-mother households (among all households):
| Medicine Lake: | 5.4% |
| Minneapolis: | 10.5% |
Percentage of never married males 15 years old and over:
Percentage of never married females 15 years old and over:
| Medicine Lake: | 13.6% |
| Minneapolis: | 27.0% |
Percentage of never married females 15 years old and over:
| Medicine Lake: | 13.8% |
| city: | 25.4% |
Percentage of people that speak English not well or not at all:
| Medicine Lake: | 0.0% |
| Minneapolis: | 3.8% |
Percentage of people born in this state:
Percentage of people born in another U.S. state:
Percentage of native residents but born outside the U.S.:
Percentage of foreign born residents:
| Here: | 64.3% |
| Minneapolis: | 51.9% |
Percentage of people born in another U.S. state:
| Medicine Lake: | 24.8% |
| Minneapolis: | 31.8% |
Percentage of native residents but born outside the U.S.:
| Here: | 1.9% |
| city: | 1.5% |
Percentage of foreign born residents:
| Here: | 9.0% |
| Minneapolis: | 14.7% |
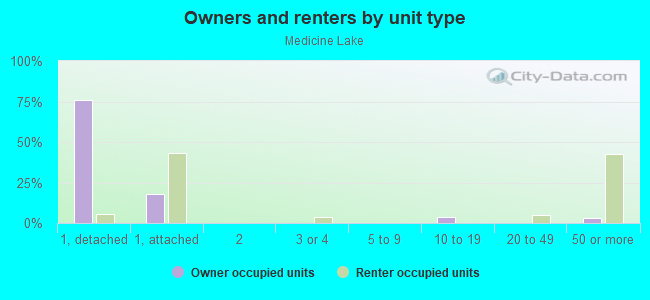
Owner-occupied
Renter-occupied

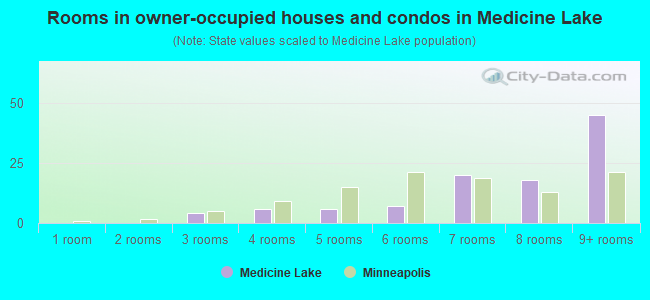
- Rooms in owner-occupied houses and condos in Medicine Lake
- 01 room
- 02 rooms
- 43 rooms
- 64 rooms
- 65 rooms
- 76 rooms
- 207 rooms
- 188 rooms
- 459+ rooms
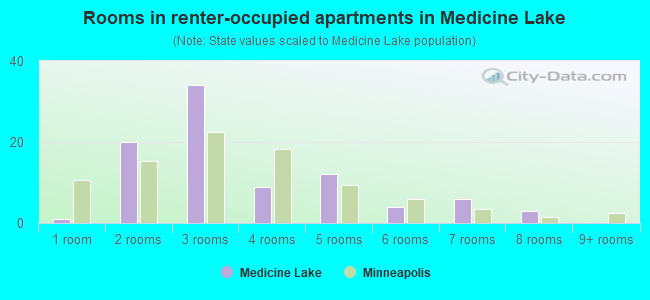
- Rooms in renter-occupied apartments in Medicine Lake
- 11 room
- 202 rooms
- 343 rooms
- 94 rooms
- 125 rooms
- 46 rooms
- 67 rooms
- 38 rooms
- 09+ rooms
Owner-occupied
Renter-occupied
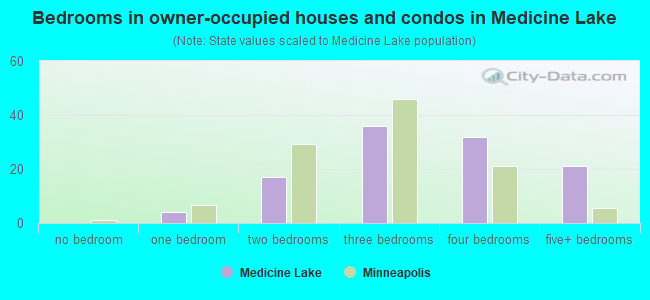
- Bedrooms in owner-occupied houses and condos in Medicine Lake
- 0no bedroom
- 41 bedroom
- 172 bedrooms
- 363 bedrooms
- 324 bedrooms
- 215+ bedrooms
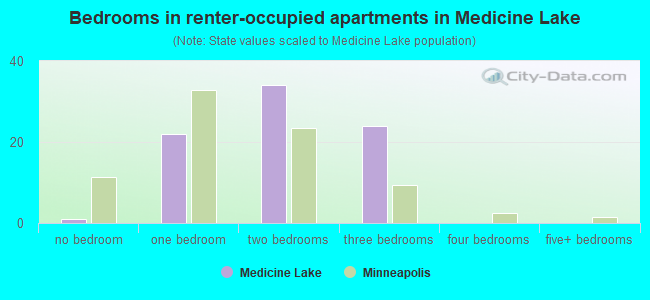
- Bedrooms in renter-occupied apartments in Medicine Lake
- 1no bedroom
- 221 bedroom
- 342 bedrooms
- 243 bedrooms
- 04 bedrooms
- 05+ bedrooms
Average number of cars or other vehicles available in houses/condos:
Average number of cars or other vehicles available in apartments:
| This neighborhood: | 1.4 |
| Minneapolis: | 1.6 |
Average number of cars or other vehicles available in apartments:
| Here: | 2.3 |
| city: | 1.1 |
Percentage of units with a mortgage:
| Medicine Lake: | 69.9% |
| Minneapolis: | 71.8% |
Average estimated value of detached houses in 2022 (59.1% of all units):
| Medicine Lake: | $481,051 |
| Minnesota: | $374,552 |
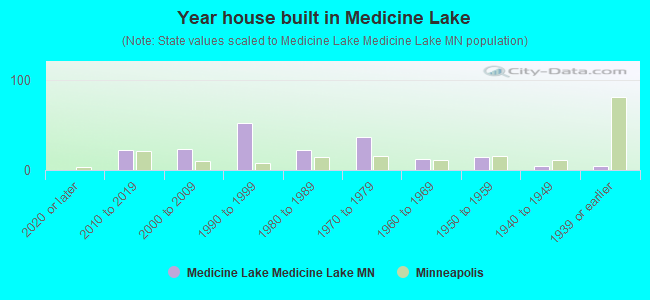
- Year house built in Medicine Lake
- 02020 or later
- 222010 to 2019
- 232000 to 2009
- 521990 to 1999
- 221980 to 1989
- 371970 to 1979
- 121960 to 1969
- 141950 to 1959
- 41940 to 1949
- 51939 or earlier
City-data.com crime index for city in 2020 (higher means more crime):
| City: | 600.2 |
| U.S. average: | 219.5 |
Travel time to work (commute)
![Travel time to work (commute)]()
- 1Less than 5 minutes
- 85 to 9 minutes
- 1910 to 14 minutes
- 2015 to 19 minutes
- 1620 to 24 minutes
- 1025 to 29 minutes
- 1030 to 34 minutes
- 135 to 39 minutes
- 440 to 44 minutes
- 1145 to 59 minutes

Means of transportation to work
![Means of transportation to work]()
- 71.2%126Drove a car alone
- 14.7%26Carpooled
- 2.3%4Bus
- 1.1%2Taxi
- 2.3%4Bicycle
- 2.8%5Walked
- 15.8%28Worked at home

Time leaving home to go to work
![Time leaving home to go to work]()
- 112:00 a.m. to 4:59 a.m.
- 15:30 a.m. to 5:59 a.m.
- 36:00 a.m. to 6:29 a.m.
- 86:30 a.m. to 6:59 a.m.
- 217:00 a.m. to 7:29 a.m.
- 197:30 a.m. to 7:59 a.m.
- 228:00 a.m. to 8:29 a.m.
- 38:30 a.m. to 8:59 a.m.
- 69:00 a.m. to 9:59 a.m.
- 310:00 a.m. to 10:59 a.m.
- 111:00 a.m. to 11:59 a.m.
- 512:00 p.m. to 3:59 p.m.
- 14:00 p.m. to 11:59 p.m.

Occupations of males:
- Percentage of males in management occupations (except farmers):
Here: 24.4% city: 12.1%
- Percentage of males in business and financial operations occupations:
Here: 11.0% city: 9.1%
- Percentage of males in computer and mathematical occupations:
Here: 21.1% city: 8.4%
- Percentage of males in architecture and engineering occupations:
Here: 8.1% city: 4.6%
- Percentage of males in community and social services occupations:
Here: 1.9% city: 1.8%
- Percentage of males in education, training, and library occupations:
Here: 2.6% city: 5.2%
- Percentage of males in arts, design, entertainment, sports, and media occupations:
Here: 5.5% city: 4.0%
- Percentage of males in healthcare practitioners and technical occupations:
Here: 1.6% city: 3.6%
- Percentage of males in service occupations:
Here: 12.0% city: 12.6%
- Percentage of males in sales and office occupations:
Here: 6.8% city: 15.3%
- Percentage of males in transportation occupations:
Here: 1.4% city: 4.1%
- Percentage of males in material moving occupations:
Here: 2.0% city: 3.6%
Occupations of females:
- Percentage of females in management occupations (except farmers):
Here: 13.6% city: 11.4%
- Percentage of females in business and financial operations occupations:
Here: 14.7% city: 9.8%
- Percentage of females in computer and mathematical occupations:
Here: 2.7% city: 2.6%
- Percentage of females in community and social services occupations:
Here: 2.6% city: 3.8%
- Percentage of females in legal occupations:
Here: 1.7% city: 2.3%
- Percentage of females in education, training, and library occupations:
Here: 14.0% city: 10.6%
- Percentage of females in arts, design, entertainment, sports, and media occupations:
Here: 5.0% city: 5.6%
- Percentage of females in healthcare practitioners and technical occupations:
Here: 6.6% city: 8.3%
- Percentage of females in service occupations:
Here: 20.0% city: 17.8%
- Percentage of females in sales and office occupations:
Here: 15.5% city: 18.7%
- Percentage of females in production occupations:
Here: 1.3% city: 2.7%
- Percentage of females in material moving occupations:
Here: 2.4% city: 1.5%
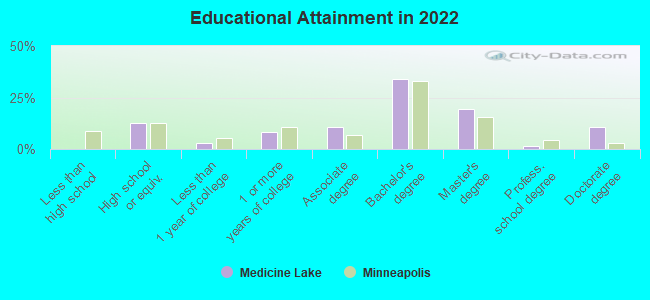
Education in this neighborhood (subdivision or community):
- Percentage of people 3 years and older in K-12 schools:
Medicine Lake: 27.7% Minneapolis: 14.0%
- Percentage of people 3 years and older in undergraduate colleges:
Medicine Lake: 5.1% Minneapolis: 8.6%
- Percentage of people 3 years and older in grad. or professional schools:
Medicine Lake: 4.5% Minneapolis: 2.9%
- Percentage of students K-12 enrolled in private schools:
Medicine Lake: 3.3% Minneapolis: 14.1%
Percentage of population below poverty level:
| Medicine Lake: | 7.3% |
| Minneapolis: | 17.2% |
Median year owner moved in (as recorded in 2022):
Median year renter moved in (as recorded in 2022):
| Medicine Lake: | 2009 |
| Minneapolis: | 2012 |
Median year renter moved in (as recorded in 2022):
| Medicine Lake: | 2019 |
| Minneapolis: | 2021 |
Percentage of married-couple families with both working:
| Medicine Lake: | 85.4% |
| Minneapolis: | 73.9% |
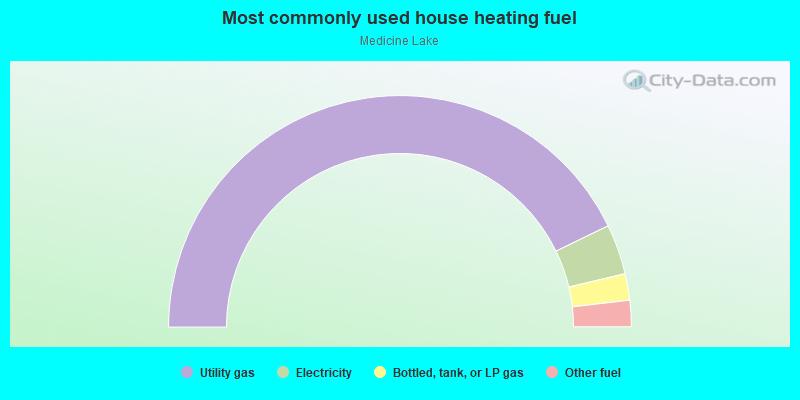
- 85.6%Utility gas
- 7.0%Electricity
- 3.7%Bottled, tank, or LP gas
- 3.7%Other fuel
Roads and streets:
Peninsula Rd
Length: 1.11 miles
Directions: E-W, N-S, SE-NW, SW-NE
Address range: 100 to 299
Directions: E-W, N-S, SE-NW, SW-NE
Address range: 100 to 299
Co Rd 73 (S Shore Dr)
Length: 0.38 miles
Directions: E-W, N-S, SE-NW, SW-NE
Address range: 1236 to 10799
Directions: E-W, N-S, SE-NW, SW-NE
Address range: 1236 to 10799
Kaiser Ave
Length: 0.29 miles
Directions: E-W, N-S, SW-NE
Address range: 1 to 99
Directions: E-W, N-S, SW-NE
Address range: 1 to 99
Columbia Ave N
Length: 0.09 miles
Directions: N-S, SW-NE
Address range: 1200 to 1399
Directions: N-S, SW-NE
Address range: 1200 to 1399
Colonial Cir
Length: 0.06 miles
Direction: E-W
Address range: 1 to 99
Direction: E-W
Address range: 1 to 99
15th Ave N
Length: 0.04 miles
Direction: E-W
Address range: 10700 to 10799
Direction: E-W
Address range: 10700 to 10799
Railroad features:
Union Pacific RR
Length: 0.34 miles
Direction: E-W
Direction: E-W