Mid-City Industrial neighborhood in Minneapolis, Minnesota (MN), 55413 detailed profile
Settings
X

Business Search - 14 Million verified businesses
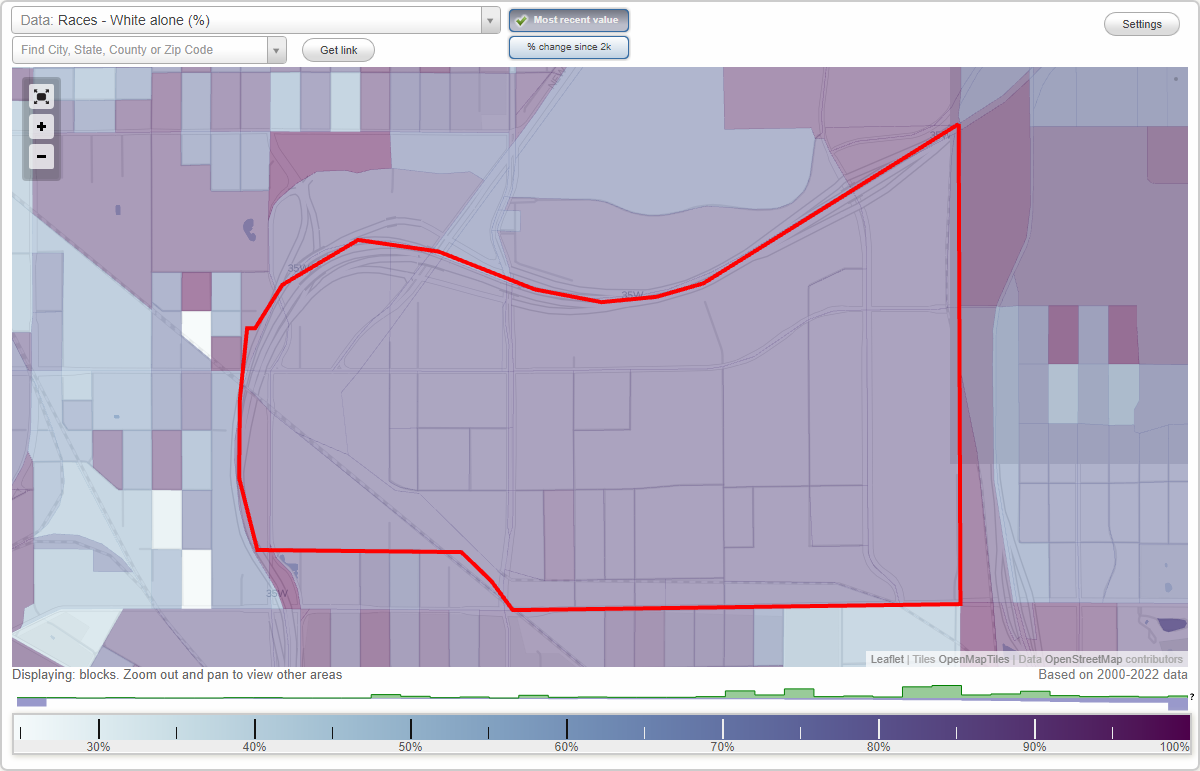
Area: 1.061 square miles
Population: 6,533
Population density:
| Mid-City Industrial: | 6,160 people per square mile |
| Minneapolis: | 7,744 people per square mile |

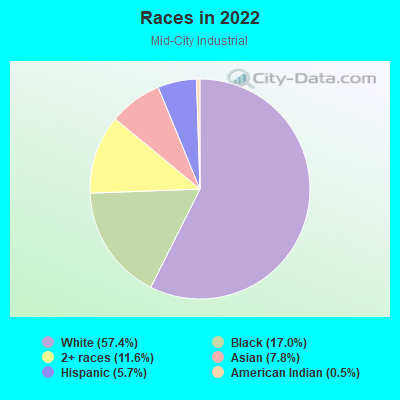
- 3,75157.4%White
- 1,10817.0%Black
- 75711.6%Two or more races
- 5087.8%Asian
- 3745.7%Hispanic or Latino
- 320.5%American Indian
Distribution of median household income
![Distribution of median household income]()
- 125Less than $10,000
- 55$10,000 to $19,999
- 47$20,000 to $29,999
- 204$30,000 to $39,999
- 453$40,000 to $49,999
- 70$50,000 to $59,999
- 319$60,000 to $74,999
- 689$75,000 to $99,999
- 268$100,000 to $124,999
- 98$125,000 to $149,999
- 74$150,000 to $199,999
- 102$200,000 or more

Distribution of owner-occupied house/condo value
![Distribution of owner-occupied house/condo value]()
- 5Less than $50,000
- 153$50,000 to $99,999
- 24$100,000 to $149,999
- 58$150,000 to $199,999
- 171$200,000 to $249,999
- 352$250,000 to $299,999
- 241$300,000 to $399,999
- 65$400,000 to $499,999
- 185$500,000 to $749,999

Distribution of rent paid by renters
![Distribution of rent paid by renters]()
- 4$700 to $799
- 74$800 to $899
- 14$900 to $999
- 384$1,000 to $1,249
- 153$1,250 to $1,499
- 458$1,500 to $1,999
- 181$2,000 or more

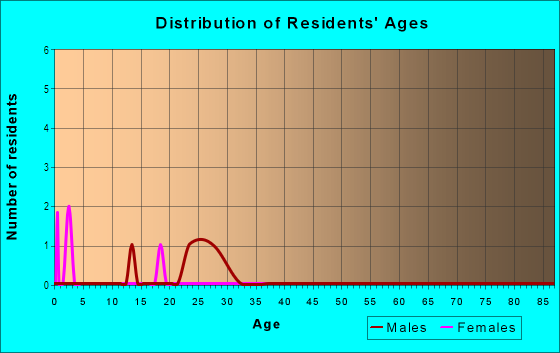
| Males: | 3,839 |
| Females: | 2,693 |
Males:
| This neighborhood: | |
| Whole city: |
| This neighborhood: | |
| Whole city: |
Percentage of family households:
| Mid-City Industrial: | 48.1% |
| Minneapolis: | 34.1% |
| Here: | 23.1% |
| Minneapolis: | 29.8% |
Percentage of married-couple families with children (among all households):
| Mid-City Industrial: | 13.3% |
| Minneapolis: | 31.8% |
Percentage of single-mother households (among all households):
| Mid-City Industrial: | 14.4% |
| Minneapolis: | 10.5% |
Percentage of never married males 15 years old and over:
Percentage of never married females 15 years old and over:
| Mid-City Industrial: | 38.9% |
| Minneapolis: | 27.0% |
Percentage of never married females 15 years old and over:
| Mid-City Industrial: | 26.9% |
| city: | 25.4% |
Percentage of people that speak English not well or not at all:
| Mid-City Industrial: | 0.0% |
| Minneapolis: | 3.8% |
Percentage of people born in this state:
Percentage of people born in another U.S. state:
Percentage of native residents but born outside the U.S.:
Percentage of foreign born residents:
| Here: | 64.0% |
| Minneapolis: | 51.9% |
Percentage of people born in another U.S. state:
| Mid-City Industrial: | 23.9% |
| Minneapolis: | 31.8% |
Percentage of native residents but born outside the U.S.:
| Here: | 0.6% |
| city: | 1.5% |
Percentage of foreign born residents:
| Here: | 11.5% |
| Minneapolis: | 14.7% |
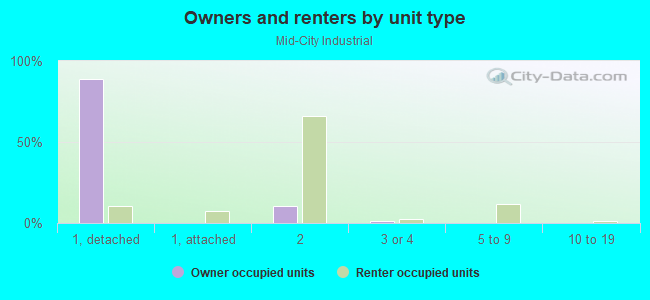
Owner-occupied
Renter-occupied

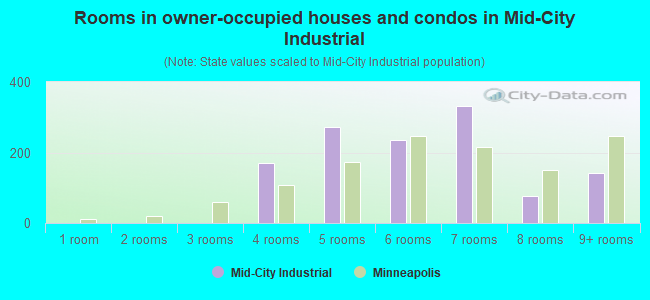
- Rooms in owner-occupied houses and condos in Mid-City Industrial
- 01 room
- 02 rooms
- 03 rooms
- 1704 rooms
- 2725 rooms
- 2356 rooms
- 3327 rooms
- 788 rooms
- 1439+ rooms

- Rooms in renter-occupied apartments in Mid-City Industrial
- 01 room
- 362 rooms
- 1013 rooms
- 3284 rooms
- 3695 rooms
- 2216 rooms
- 837 rooms
- 978 rooms
- 239+ rooms
Owner-occupied
Renter-occupied
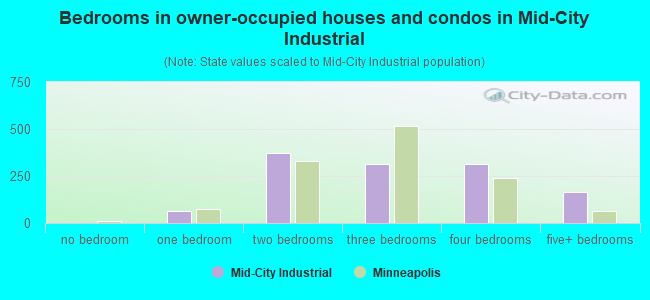
- Bedrooms in owner-occupied houses and condos in Mid-City Industrial
- 0no bedroom
- 641 bedroom
- 3742 bedrooms
- 3143 bedrooms
- 3144 bedrooms
- 1665+ bedrooms
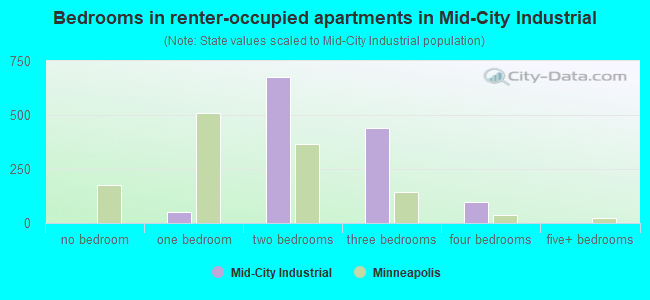
- Bedrooms in renter-occupied apartments in Mid-City Industrial
- 0no bedroom
- 501 bedroom
- 6742 bedrooms
- 4383 bedrooms
- 974 bedrooms
- 05+ bedrooms
Average number of cars or other vehicles available in houses/condos:
Average number of cars or other vehicles available in apartments:
| This neighborhood: | |
| Minneapolis: |
Average number of cars or other vehicles available in apartments:
| Here: | |
| city: |
Percentage of units with a mortgage:
| Mid-City Industrial: | 70.4% |
| Minneapolis: | 71.8% |

- Year house built in Mid-City Industrial
- 02020 or later
- 1432010 to 2019
- 782000 to 2009
- 2351990 to 1999
- 3181980 to 1989
- 3741970 to 1979
- 271960 to 1969
- 1611950 to 1959
- 01940 to 1949
- 1,1551939 or earlier
City-data.com crime index for city in 2020 (higher means more crime):
| City: | 600.2 |
| U.S. average: | 219.5 |
Travel time to work (commute)
![Travel time to work (commute)]()
- 2Less than 5 minutes
- 375 to 9 minutes
- 15610 to 14 minutes
- 18115 to 19 minutes
- 14420 to 24 minutes
- 14725 to 29 minutes
- 11330 to 34 minutes
- 2135 to 39 minutes
- 1240 to 44 minutes
- 17045 to 59 minutes
- 3160 to 89 minutes
- 490 or more minutes

Means of transportation to work
![Means of transportation to work]()
- 62.3%2,610Drove a car alone
- 10.2%429Carpooled
- 7.3%304Bus
- 0.0%2Light rail, streetcar or trolley
- 2.0%83Motorcycle
- 0.3%13Bicycle
- 3.6%152Walked
- 14.1%591Worked at home

Time leaving home to go to work
![Time leaving home to go to work]()
- 2112:00 a.m. to 4:59 a.m.
- 175:30 a.m. to 5:59 a.m.
- 766:00 a.m. to 6:29 a.m.
- 536:30 a.m. to 6:59 a.m.
- 1097:00 a.m. to 7:29 a.m.
- 1337:30 a.m. to 7:59 a.m.
- 808:00 a.m. to 8:29 a.m.
- 828:30 a.m. to 8:59 a.m.
- 709:00 a.m. to 9:59 a.m.
- 2210:00 a.m. to 10:59 a.m.
- 311:00 a.m. to 11:59 a.m.
- 12212:00 p.m. to 3:59 p.m.
- 1144:00 p.m. to 11:59 p.m.

Occupations of males:
- Percentage of males in management occupations (except farmers):
Here: 15.5% city: 12.1%
- Percentage of males in business and financial operations occupations:
Here: 4.7% city: 9.1%
- Percentage of males in computer and mathematical occupations:
Here: 2.0% city: 8.4%
- Percentage of males in architecture and engineering occupations:
Here: 2.0% city: 4.6%
- Percentage of males in legal occupations:
Here: 2.4% city: 2.0%
- Percentage of males in education, training, and library occupations:
Here: 2.4% city: 5.2%
- Percentage of males in arts, design, entertainment, sports, and media occupations:
Here: 5.5% city: 4.0%
- Percentage of males in healthcare practitioners and technical occupations:
Here: 6.7% city: 3.6%
- Percentage of males in service occupations:
Here: 21.1% city: 12.6%
- Percentage of males in sales and office occupations:
Here: 14.4% city: 15.3%
- Percentage of males in construction, extraction, and maintenance occupations:
Here: 8.6% city: 3.3%
- Percentage of males in production occupations:
Here: 3.3% city: 5.8%
- Percentage of males in transportation occupations:
Here: 4.4% city: 4.1%
- Percentage of males in material moving occupations:
Here: 8.0% city: 3.6%
Occupations of females:
- Percentage of females in management occupations (except farmers):
Here: 12.6% city: 11.4%
- Percentage of females in business and financial operations occupations:
Here: 7.6% city: 9.8%
- Percentage of females in computer and mathematical occupations:
Here: 1.1% city: 2.6%
- Percentage of females in architecture and engineering occupations:
Here: 2.3% city: 1.2%
- Percentage of females in life, physical, and social science occupations:
Here: 1.9% city: 2.3%
- Percentage of females in legal occupations:
Here: 3.4% city: 2.3%
- Percentage of females in education, training, and library occupations:
Here: 1.1% city: 10.6%
- Percentage of females in arts, design, entertainment, sports, and media occupations:
Here: 2.8% city: 5.6%
- Percentage of females in healthcare practitioners and technical occupations:
Here: 7.4% city: 8.3%
- Percentage of females in service occupations:
Here: 42.0% city: 17.8%
- Percentage of females in sales and office occupations:
Here: 28.0% city: 18.7%
- Percentage of females in construction, extraction, and maintenance occupations:
Here: 1.4% city: 0.2%
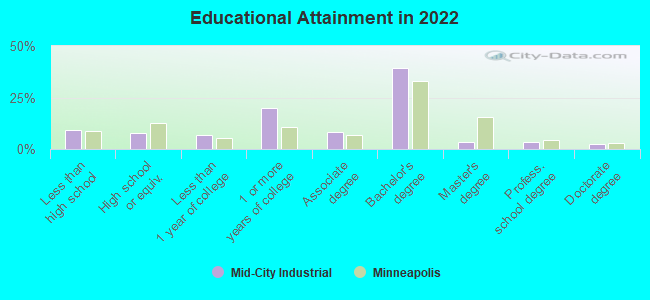
Education in this neighborhood (subdivision or community):
- Percentage of people 3 years and older in K-12 schools:
Mid-City Industrial: 20.3% Minneapolis: 14.0%
- Percentage of people 3 years and older in undergraduate colleges:
Mid-City Industrial: 8.0% Minneapolis: 8.6%
- Percentage of people 3 years and older in grad. or professional schools:
Mid-City Industrial: 3.0% Minneapolis: 2.9%
- Percentage of students K-12 enrolled in private schools:
Mid-City Industrial: 3.9% Minneapolis: 14.1%
Percentage of population below poverty level:
| Mid-City Industrial: | 12.6% |
| Minneapolis: | 17.2% |
Percentage of married-couple families with both working:
| Mid-City Industrial: | 91.9% |
| Minneapolis: | 73.9% |
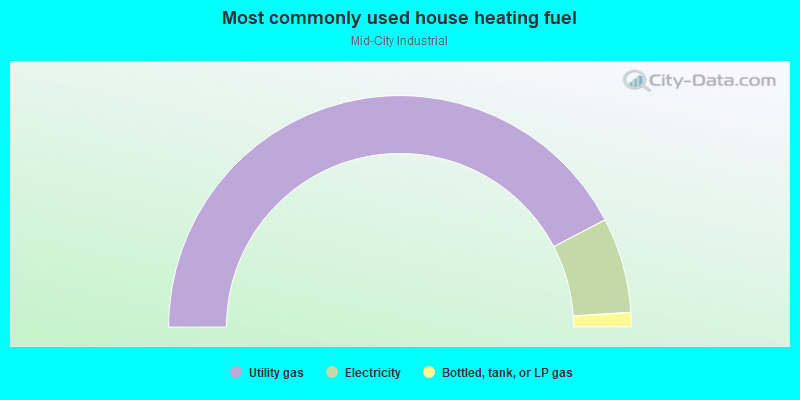
- 84.6%Utility gas
- 13.3%Electricity
- 2.0%Bottled, tank, or LP gas
Limited-access highways (interstate or state) in this neighborhood:
I- 35
Length: 0.86 miles
Directions: E-W, N-S, SW-NE
Directions: E-W, N-S, SW-NE
Roads and streets:
Broadway St NE
Length: 2.11 miles
Directions: E-W, SW-NE
Address range: 1550 to 3599
Directions: E-W, SW-NE
Address range: 1550 to 3599
E Hennepin Ave
Length: 1.32 miles
Direction: E-W
Address range: 1800 to 3399
Direction: E-W
Address range: 1800 to 3399
Stinson Blvd (Co Rd 27)
Length: 1.14 miles
Directions: N-S, SW-NE
Address range: 323 to 1434
Directions: N-S, SW-NE
Address range: 323 to 1434
Kennedy St NE
Length: 0.82 miles
Directions: E-W, SE-NW
Address range: 2000 to 2899
Directions: E-W, SE-NW
Address range: 2000 to 2899
Industrial Blvd NE
Length: 0.79 miles
Directions: N-S, SE-NW
Address range: 300 to 1399
Directions: N-S, SE-NW
Address range: 300 to 1399
Winter St NE
Length: 0.66 miles
Direction: E-W
Address range: 1000 to 3099
Direction: E-W
Address range: 1000 to 3099
Hoover St NE
Length: 0.65 miles
Directions: N-S, SE-NW, SW-NE
Address range: 300 to 1399
Directions: N-S, SE-NW, SW-NE
Address range: 300 to 1399
Traffic St NE
Length: 0.64 miles
Direction: E-W
Address range: 1800 to 3199
Direction: E-W
Address range: 1800 to 3199
Spring St NE (Kennedy St NE)
Length: 0.60 miles
Direction: E-W
Address range: 2900 to 3499
Direction: E-W
Address range: 2900 to 3499
Summer St NE
Length: 0.54 miles
Direction: E-W
Address range: 2000 to 2799
Direction: E-W
Address range: 2000 to 2799
Taft St NE
Length: 0.53 miles
Direction: N-S
Address range: 300 to 1199
Direction: N-S
Address range: 300 to 1199
Johnson St NE
Length: 0.52 miles
Directions: N-S, SE-NW, SW-NE
Address range: 500 to 1099
Directions: N-S, SE-NW, SW-NE
Address range: 500 to 1099
Cleveland St NE
Length: 0.39 miles
Direction: N-S
Address range: 600 to 1399
Direction: N-S
Address range: 600 to 1399
Co Rd 88 (New Brighton Blvd)
Length: 0.38 miles
Direction: SW-NE
Address range: 1100 to 1399
Direction: SW-NE
Address range: 1100 to 1399
Harding St NE
Length: 0.38 miles
Directions: N-S, SE-NW
Address range: 300 to 1099
Directions: N-S, SE-NW
Address range: 300 to 1099
Godward St NE
Length: 0.35 miles
Directions: N-S, SW-NE
Address range: 600 to 1399
Directions: N-S, SW-NE
Address range: 600 to 1399
Arthur St NE
Length: 0.29 miles
Direction: N-S
Address range: 600 to 1499
Direction: N-S
Address range: 600 to 1499
33rd Ave SE
Length: 0.27 miles
Direction: N-S
Address range: 1 to 599
Direction: N-S
Address range: 1 to 599
Roosevelt St NE
Length: 0.19 miles
Direction: N-S
Address range: 300 to 599
Direction: N-S
Address range: 300 to 599
NE Wilson St
Length: 0.19 miles
Direction: N-S
Address range: 300 to 599
Direction: N-S
Address range: 300 to 599
Broadway Rd NE
Length: 0.18 miles
Directions: E-W, SW-NE
Address range: 2500 to 2999
Directions: E-W, SW-NE
Address range: 2500 to 2999
McKinley Pl NE
Length: 0.13 miles
Direction: N-S
Address range: 600 to 699
Direction: N-S
Address range: 600 to 699
R St NE
Length: 0.13 miles
Direction: N-S
Address range: 400 to 599
Direction: N-S
Address range: 400 to 599
Delano St NE
Length: 0.13 miles
Direction: N-S
Address range: 450 to 599
Direction: N-S
Address range: 450 to 599
Ulysses St NE
Length: 0.12 miles
Direction: N-S
Address range: 1100 to 1299
Direction: N-S
Address range: 1100 to 1299
Coolidge St NE
Length: 0.10 miles
Direction: N-S
Address range: 300 to 499
Direction: N-S
Address range: 300 to 499
St Anthony Blvd
Length: 0.06 miles
Directions: N-S, SE-NW
Directions: N-S, SE-NW
14th Ave SE
Length: 0.06 miles
Direction: N-S
Address range: 1200 to 1299
Direction: N-S
Address range: 1200 to 1299
Railroad features:
Canadian Pacific Rlwy
Length: 2.19 miles
Directions: E-W, N-S, SE-NW
Directions: E-W, N-S, SE-NW
Burlington Northern Santa Fe Rlwy
Length: 1.62 miles
Directions: E-W, N-S, SE-NW, SW-NE
Directions: E-W, N-S, SE-NW, SW-NE