Mill Valley Heights neighborhood in Mill Valley, California (CA), 94941 detailed profile
Settings
X


Business Search - 14 Million verified businesses
Area: 0.323 square miles
Population: 449
Population density:
| Mill Valley Heights: | 1,391 people per square mile |
| Mill Valley: | 3,010 people per square mile |

- 37954.5%White
- 13519.4%Two or more races
- 7010.1%Black
- 557.9%Asian
- 547.8%Hispanic or Latino
- 30.4%Some other race

Median household income in 2022:
| Mill Valley Heights: | $220,425 |
| Mill Valley: | $202,986 |
Distribution of median household income
![Distribution of median household income]()
- 76Less than $10,000
- 17$10,000 to $19,999
- 33$20,000 to $29,999
- 19$30,000 to $39,999
- 8$40,000 to $49,999
- 5$50,000 to $59,999
- 15$60,000 to $74,999
- 17$75,000 to $99,999
- 7$100,000 to $124,999
- 23$125,000 to $149,999
- 17$150,000 to $199,999
- 93$200,000 or more

Distribution of owner-occupied house/condo value
![Distribution of owner-occupied house/condo value]()
- 2Less than $50,000
- 13$100,000 to $149,999
- 36$150,000 to $199,999
- 2$200,000 to $249,999
- 2$250,000 to $299,999
- 1$300,000 to $399,999
- 14$400,000 to $499,999
- 11$500,000 to $749,999
- 17$750,000 to $999,999
- 101$1,000,000 or more

Distribution of rent paid by renters
![Distribution of rent paid by renters]()
- 3$100 to $199
- 1$200 to $299
- 3$300 to $399
- 3$900 to $999
- 2$1,000 to $1,249
- 6$1,250 to $1,499
- 23$1,500 to $1,999
- 108$2,000 or more

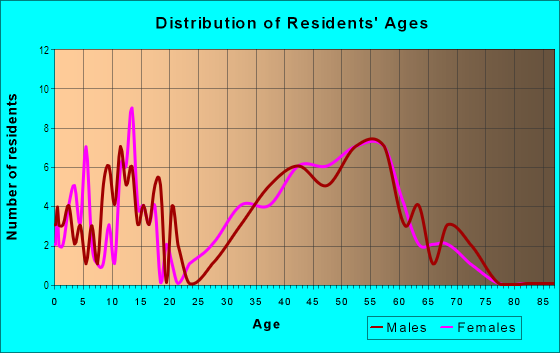
| Males: | 225 |
| Females: | 224 |
Males:
| This neighborhood: | 50.1 years |
| Whole city: | 46.4 years |
| This neighborhood: | 46.6 years |
| Whole city: | 47.3 years |
Average household size:
| Mill Valley Heights: | 2.7 people |
| Mill Valley: | 2.5 people |
Percentage of family households:
| Mill Valley Heights: | 40.8% |
| Mill Valley: | 47.2% |
| Here: | 55.3% |
| Mill Valley: | 56.3% |
Percentage of married-couple families with children (among all households):
| Mill Valley Heights: | 29.9% |
| Mill Valley: | 32.4% |
Percentage of single-mother households (among all households):
| Mill Valley Heights: | 29.7% |
| Mill Valley: | 5.6% |
Percentage of never married males 15 years old and over:
Percentage of never married females 15 years old and over:
| Mill Valley Heights: | 16.8% |
| Mill Valley: | 14.9% |
Percentage of never married females 15 years old and over:
| Mill Valley Heights: | 15.7% |
| city: | 13.2% |
Percentage of people that speak English not well or not at all:
| Mill Valley Heights: | 0.0% |
| Mill Valley: | 0.6% |
Percentage of people born in this state:
Percentage of people born in another U.S. state:
Percentage of native residents but born outside the U.S.:
Percentage of foreign born residents:
| Here: | 46.3% |
| Mill Valley: | 42.0% |
Percentage of people born in another U.S. state:
| Mill Valley Heights: | 37.6% |
| Mill Valley: | 37.9% |
Percentage of native residents but born outside the U.S.:
| Here: | 3.0% |
| city: | 3.5% |
Percentage of foreign born residents:
| Here: | 13.1% |
| Mill Valley: | 16.6% |

Owner-occupied
Renter-occupied


- Rooms in owner-occupied houses and condos in Mill Valley Heights
- 01 room
- 352 rooms
- 203 rooms
- 74 rooms
- 1155 rooms
- 236 rooms
- 77 rooms
- 468 rooms
- 329+ rooms

- Rooms in renter-occupied apartments in Mill Valley Heights
- 21 room
- 222 rooms
- 393 rooms
- 1074 rooms
- 145 rooms
- 106 rooms
- 97 rooms
- 08 rooms
- 09+ rooms
Owner-occupied
Renter-occupied

- Bedrooms in owner-occupied houses and condos in Mill Valley Heights
- 0no bedroom
- 71 bedroom
- 312 bedrooms
- 923 bedrooms
- 604 bedrooms
- 255+ bedrooms

- Bedrooms in renter-occupied apartments in Mill Valley Heights
- 2no bedroom
- 611 bedroom
- 1082 bedrooms
- 93 bedrooms
- 64 bedrooms
- 15+ bedrooms
Average number of cars or other vehicles available in houses/condos:
Average number of cars or other vehicles available in apartments:
| This neighborhood: | 2.0 |
| Mill Valley: | 2.1 |
Average number of cars or other vehicles available in apartments:
| Here: | 1.9 |
| city: | 1.3 |
Percentage of units with a mortgage:
| Mill Valley Heights: | 80.3% |
| Mill Valley: | 69.0% |
Average estimated value of detached houses in 2022 (81.9% of all units):
| Mill Valley Heights: | $2,737,296 |
| California: | $988,808 |

- Year house built in Mill Valley Heights
- 82020 or later
- 82010 to 2019
- 72000 to 2009
- 191990 to 1999
- 201980 to 1989
- 131970 to 1979
- 381960 to 1969
- 191950 to 1959
- 291940 to 1949
- 611939 or earlier

City-data.com crime index for city in 2020 (higher means more crime):
| City: | 112.2 |
| U.S. average: | 219.5 |
Travel time to work (commute)
![Travel time to work (commute)]()
- 4Less than 5 minutes
- 125 to 9 minutes
- 1410 to 14 minutes
- 1015 to 19 minutes
- 3220 to 24 minutes
- 1025 to 29 minutes
- 1230 to 34 minutes
- 935 to 39 minutes
- 1640 to 44 minutes
- 4645 to 59 minutes
- 3760 to 89 minutes
- 1290 or more minutes

Means of transportation to work
![Means of transportation to work]()
- 53.2%119Drove a car alone
- 12.5%28Carpooled
- 18.3%41Bus
- 3.6%8Ferryboat
- 3.6%8Bicycle
- 4.5%10Walked
- 1.3%3Other means
- 28.2%63Worked at home

Time leaving home to go to work
![Time leaving home to go to work]()
- 1212:00 a.m. to 4:59 a.m.
- 15:30 a.m. to 5:59 a.m.
- 276:00 a.m. to 6:29 a.m.
- 106:30 a.m. to 6:59 a.m.
- 297:00 a.m. to 7:29 a.m.
- 107:30 a.m. to 7:59 a.m.
- 458:00 a.m. to 8:29 a.m.
- 88:30 a.m. to 8:59 a.m.
- 219:00 a.m. to 9:59 a.m.
- 1710:00 a.m. to 10:59 a.m.
- 111:00 a.m. to 11:59 a.m.
- 112:00 p.m. to 3:59 p.m.
- 44:00 p.m. to 11:59 p.m.

Occupations of males:
- Percentage of males in management occupations (except farmers):
Here: 11.0% city: 28.2%
- Percentage of males in business and financial operations occupations:
Here: 3.8% city: 8.7%
- Percentage of males in computer and mathematical occupations:
Here: 7.3% city: 6.1%
- Percentage of males in architecture and engineering occupations:
Here: 22.4% city: 5.1%
- Percentage of males in life, physical, and social science occupations:
Here: 3.4% city: 2.0%
- Percentage of males in legal occupations:
Here: 6.9% city: 5.9%
- Percentage of males in arts, design, entertainment, sports, and media occupations:
Here: 13.8% city: 6.4%
- Percentage of males in healthcare practitioners and technical occupations:
Here: 1.3% city: 6.5%
- Percentage of males in sales and office occupations:
Here: 19.7% city: 18.4%
- Percentage of males in construction, extraction, and maintenance occupations:
Here: 2.3% city: 0.8%
- Percentage of males in production occupations:
Here: 10.3% city: 2.3%
- Percentage of males in material moving occupations:
Here: 1.7% city: 0.6%
Occupations of females:
- Percentage of females in management occupations (except farmers):
Here: 22.9% city: 22.1%
- Percentage of females in business and financial operations occupations:
Here: 22.3% city: 9.4%
- Percentage of females in computer and mathematical occupations:
Here: 2.0% city: 2.2%
- Percentage of females in community and social services occupations:
Here: 3.9% city: 2.8%
- Percentage of females in education, training, and library occupations:
Here: 1.3% city: 12.8%
- Percentage of females in arts, design, entertainment, sports, and media occupations:
Here: 20.3% city: 8.3%
- Percentage of females in healthcare practitioners and technical occupations:
Here: 28.2% city: 12.4%
Education in this neighborhood (subdivision or community):
- Percentage of people 3 years and older in K-12 schools:
Mill Valley Heights: 31.5% Mill Valley: 18.4%
- Percentage of people 3 years and older in undergraduate colleges:
Mill Valley Heights: 7.1% Mill Valley: 2.6%
- Percentage of people 3 years and older in grad. or professional schools:
Mill Valley Heights: 9.1% Mill Valley: 1.8%
- Percentage of students K-12 enrolled in private schools:
Mill Valley Heights: 105.8% Mill Valley: 32.0%
Percentage of population below poverty level:
| Mill Valley Heights: | 4.2% |
| Mill Valley: | 4.6% |
Median year owner moved in (as recorded in 2022):
| Mill Valley Heights: | 2001 |
| Mill Valley: | 2003 |
Percentage of married-couple families with both working:
| Mill Valley Heights: | 64.6% |
| Mill Valley: | 61.5% |

- 60.3%Utility gas
- 25.8%Electricity
- 6.2%Solar energy
- 5.5%Bottled, tank, or LP gas
- 2.2%Wood
Roads and streets:
Monte Vista Ave
Length: 1.27 miles
Directions: E-W, N-S, SE-NW, SW-NE
Address range: 1 to 499
Directions: E-W, N-S, SE-NW, SW-NE
Address range: 1 to 499
Rose Ave
Length: 1.03 miles
Directions: E-W, N-S, SE-NW, SW-NE
Address range: 1 to 499
Directions: E-W, N-S, SE-NW, SW-NE
Address range: 1 to 499
Marion Ave
Length: 0.80 miles
Directions: E-W, N-S, SE-NW, SW-NE
Address range: 1 to 320
Directions: E-W, N-S, SE-NW, SW-NE
Address range: 1 to 320
Cascade Dr
Length: 0.64 miles
Directions: E-W, N-S, SE-NW, SW-NE
Address range: 33 to 301
Directions: E-W, N-S, SE-NW, SW-NE
Address range: 33 to 301
Hazel Ave
Length: 0.63 miles
Directions: E-W, N-S, SE-NW, SW-NE
Address range: 109 to 399
Directions: E-W, N-S, SE-NW, SW-NE
Address range: 109 to 399
Millside Ln
Length: 0.19 miles
Directions: E-W, N-S, SE-NW, SW-NE
Address range: 1 to 99
Directions: E-W, N-S, SE-NW, SW-NE
Address range: 1 to 99
Wainwright Pl
Length: 0.15 miles
Direction: SW-NE
Address range: 1 to 32
Direction: SW-NE
Address range: 1 to 32
Dots Ln
Length: 0.13 miles
Directions: E-W, N-S, SE-NW
Address range: 1 to 99
Directions: E-W, N-S, SE-NW
Address range: 1 to 99
Renz Rd
Length: 0.13 miles
Directions: E-W, SW-NE
Address range: 1 to 99
Directions: E-W, SW-NE
Address range: 1 to 99
Cypress Ave
Length: 0.12 miles
Directions: E-W, SE-NW, SW-NE
Address range: 32 to 99
Directions: E-W, SE-NW, SW-NE
Address range: 32 to 99
Florence Ave
Length: 0.11 miles
Directions: E-W, N-S, SE-NW, SW-NE
Address range: 129 to 199
Directions: E-W, N-S, SE-NW, SW-NE
Address range: 129 to 199
Cascade Way
Length: 0.07 miles
Directions: E-W, SW-NE
Address range: 10 to 99
Directions: E-W, SW-NE
Address range: 10 to 99
Redwood Ln
Length: 0.04 miles
Directions: N-S, SW-NE
Address range: 1 to 99
Directions: N-S, SW-NE
Address range: 1 to 99
Other features:
Old Mill Crk
Length: 0.73 miles
Directions: E-W, N-S, SE-NW, SW-NE
Directions: E-W, N-S, SE-NW, SW-NE