Mission Hill Projects neighborhood in Boston, Massachusetts (MA), 02120 detailed profile
Settings
X


Business Search - 14 Million verified businesses
Area: 0.100 square miles
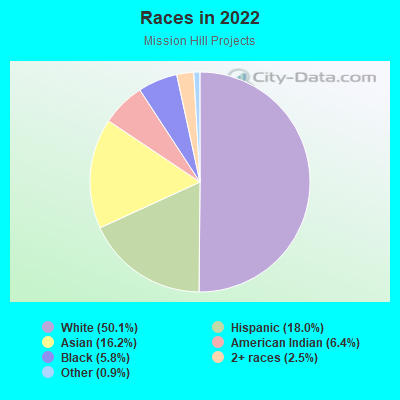
Population: 922
Population density:
| Mission Hill Projects: | 9,258 people per square mile |
| Boston: | 13,418 people per square mile |

- 49750.1%White
- 17918.0%Hispanic or Latino
- 16116.2%Asian
- 636.4%American Indian
- 585.8%Black
- 252.5%Two or more races
- 90.9%Some other race

Distribution of median household income
![Distribution of median household income]()
- 10Less than $10,000
- 20$10,000 to $19,999
- 68$20,000 to $29,999
- 42$30,000 to $39,999
- 90$40,000 to $49,999
- 158$50,000 to $59,999
- 4$60,000 to $74,999
- 3$75,000 to $99,999
- 145$100,000 to $124,999
- 6$125,000 to $149,999
- 19$150,000 to $199,999
- 224$200,000 or more

Distribution of owner-occupied house/condo value
![Distribution of owner-occupied house/condo value]()
- 12Less than $50,000
- 65$200,000 to $249,999
- 12$250,000 to $299,999
- 33$300,000 to $399,999
- 24$400,000 to $499,999
- 32$500,000 to $749,999
- 29$750,000 to $999,999
- 182$1,000,000 or more

Distribution of rent paid by renters
![Distribution of rent paid by renters]()
- 37$200 to $299
- 4$300 to $399
- 15$400 to $499
- 118$500 to $599
- 56$700 to $799
- 121$800 to $899
- 222$900 to $999
- 9$1,000 to $1,249
- 132$1,250 to $1,499
- 2$1,500 to $1,999
- 283$2,000 or more

| Males: | 520 |
| Females: | 401 |
Males:
| This neighborhood: | 29.7 years |
| Whole city: | 32.7 years |
| This neighborhood: | 31.4 years |
| Whole city: | 34.1 years |
Average household size:
| Mission Hill Projects: | 1.9 people |
| Boston: | 2.1 people |
Percentage of family households:
| Mission Hill Projects: | 28.6% |
| Boston: | 34.5% |
| Here: | 4.4% |
| Boston: | 26.9% |
Percentage of married-couple families with children (among all households):
| Mission Hill Projects: | 7.3% |
| Boston: | 24.9% |
Percentage of single-mother households (among all households):
| Mission Hill Projects: | 1.1% |
| Boston: | 15.7% |
Percentage of never married males 15 years old and over:
Percentage of never married females 15 years old and over:
| Mission Hill Projects: | 53.3% |
| Boston: | 26.8% |
Percentage of never married females 15 years old and over:
| Mission Hill Projects: | 44.1% |
| city: | 28.3% |
Percentage of people that speak English not well or not at all:
| Mission Hill Projects: | 3.3% |
| Boston: | 8.0% |
Percentage of people born in this state:
Percentage of people born in another U.S. state:
Percentage of native residents but born outside the U.S.:
Percentage of foreign born residents:
| Here: | 33.7% |
| Boston: | 42.4% |
Percentage of people born in another U.S. state:
| Mission Hill Projects: | 49.8% |
| Boston: | 26.6% |
Percentage of native residents but born outside the U.S.:
| Here: | 1.3% |
| city: | 3.3% |
Percentage of foreign born residents:
| Here: | 15.2% |
| Boston: | 27.6% |
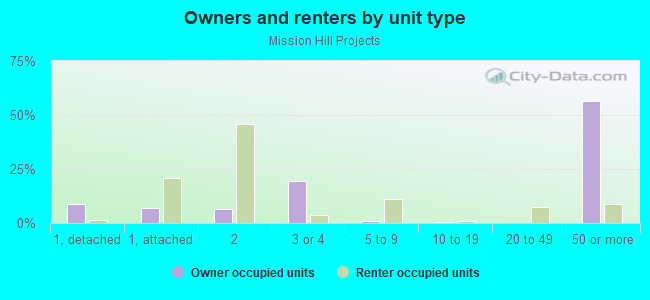
Owner-occupied
Renter-occupied

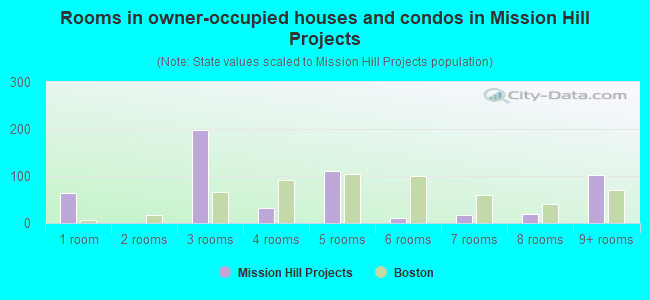
- Rooms in owner-occupied houses and condos in Mission Hill Projects
- 641 room
- 02 rooms
- 1973 rooms
- 324 rooms
- 1115 rooms
- 116 rooms
- 177 rooms
- 198 rooms
- 1029+ rooms
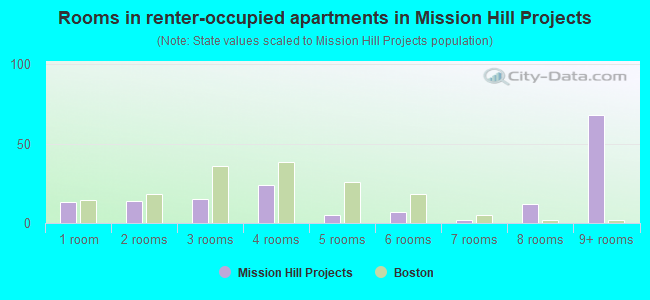
- Rooms in renter-occupied apartments in Mission Hill Projects
- 131 room
- 142 rooms
- 153 rooms
- 244 rooms
- 55 rooms
- 76 rooms
- 27 rooms
- 128 rooms
- 689+ rooms
Owner-occupied
Renter-occupied
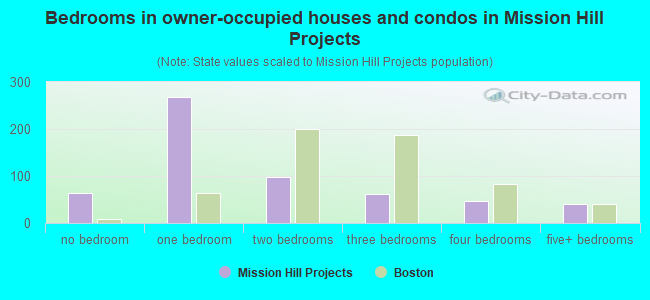
- Bedrooms in owner-occupied houses and condos in Mission Hill Projects
- 64no bedroom
- 2691 bedroom
- 982 bedrooms
- 613 bedrooms
- 464 bedrooms
- 415+ bedrooms
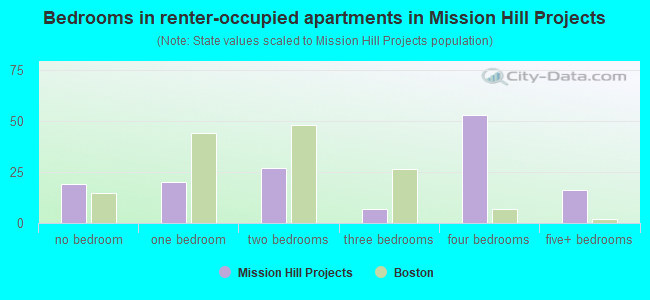
- Bedrooms in renter-occupied apartments in Mission Hill Projects
- 19no bedroom
- 201 bedroom
- 272 bedrooms
- 73 bedrooms
- 534 bedrooms
- 165+ bedrooms
Average number of cars or other vehicles available in houses/condos:
Average number of cars or other vehicles available in apartments:
| This neighborhood: | |
| Boston: |
Average number of cars or other vehicles available in apartments:
| Here: | 0.4 |
| city: | 0.7 |
Percentage of units with a mortgage:
| Mission Hill Projects: | 55.1% |
| Boston: | 69.7% |
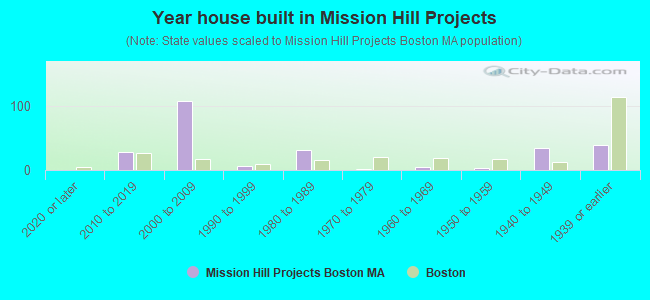
- Year house built in Mission Hill Projects
- 02020 or later
- 282010 to 2019
- 1092000 to 2009
- 71990 to 1999
- 311980 to 1989
- 11970 to 1979
- 41960 to 1969
- 31950 to 1959
- 341940 to 1949
- 391939 or earlier
City-data.com crime index for city in 2020 (higher means more crime):
| City: | 258.2 |
| U.S. average: | 219.5 |
Travel time to work (commute)
![Travel time to work (commute)]()
- 43Less than 5 minutes
- 1805 to 9 minutes
- 9710 to 14 minutes
- 7315 to 19 minutes
- 4920 to 24 minutes
- 825 to 29 minutes
- 5030 to 34 minutes
- 1135 to 39 minutes
- 440 to 44 minutes
- 445 to 59 minutes
- 2160 to 89 minutes
- 790 or more minutes

Means of transportation to work
![Means of transportation to work]()
- 4.2%15Drove a car alone
- 3.4%12Carpooled
- 4.8%17Bus
- 5.1%18Subway or elevated rail
- 4.0%14Long-distance train or commuter rail
- 12.7%45Light rail, streetcar or trolley
- 34.8%123Bicycle
- 67.9%240Walked
- 5.7%20Other means
- 13.3%47Worked at home

Time leaving home to go to work
![Time leaving home to go to work]()
- 65:00 a.m. to 5:29 a.m.
- 195:30 a.m. to 5:59 a.m.
- 76:00 a.m. to 6:29 a.m.
- 76:30 a.m. to 6:59 a.m.
- 217:00 a.m. to 7:29 a.m.
- 397:30 a.m. to 7:59 a.m.
- 518:00 a.m. to 8:29 a.m.
- 458:30 a.m. to 8:59 a.m.
- 619:00 a.m. to 9:59 a.m.
- 3310:00 a.m. to 10:59 a.m.
- 5711:00 a.m. to 11:59 a.m.
- 10012:00 p.m. to 3:59 p.m.
- 1114:00 p.m. to 11:59 p.m.

Occupations of males:
- Percentage of males in management occupations (except farmers):
Here: 3.2% city: 12.7%
- Percentage of males in business and financial operations occupations:
Here: 3.2% city: 9.1%
- Percentage of males in computer and mathematical occupations:
Here: 3.7% city: 7.4%
- Percentage of males in life, physical, and social science occupations:
Here: 5.4% city: 3.9%
- Percentage of males in education, training, and library occupations:
Here: 2.0% city: 5.7%
- Percentage of males in healthcare practitioners and technical occupations:
Here: 2.5% city: 4.4%
- Percentage of males in service occupations:
Here: 44.8% city: 16.0%
- Percentage of males in sales and office occupations:
Here: 33.9% city: 15.2%
- Percentage of males in production occupations:
Here: 1.3% city: 2.4%
- Percentage of males in material moving occupations:
Here: 2.7% city: 2.3%
Occupations of females:
- Percentage of females in business and financial operations occupations:
Here: 15.3% city: 9.5%
- Percentage of females in computer and mathematical occupations:
Here: 4.4% city: 3.2%
- Percentage of females in life, physical, and social science occupations:
Here: 2.9% city: 3.3%
- Percentage of females in education, training, and library occupations:
Here: 7.2% city: 9.4%
- Percentage of females in arts, design, entertainment, sports, and media occupations:
Here: 8.1% city: 3.4%
- Percentage of females in service occupations:
Here: 14.1% city: 18.6%
- Percentage of females in sales and office occupations:
Here: 44.5% city: 20.2%
- Percentage of females in construction, extraction, and maintenance occupations:
Here: 2.8% city: 0.2%
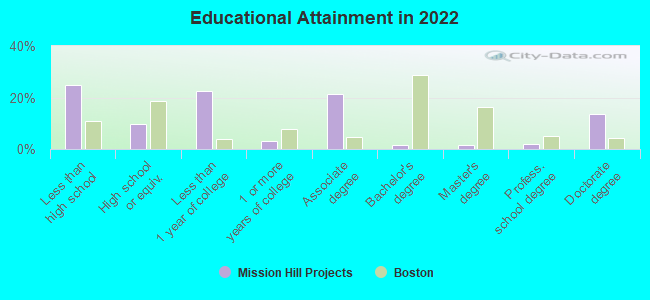
Education in this neighborhood (subdivision or community):
- Percentage of people 3 years and older in K-12 schools:
Mission Hill Projects: 30.8% Boston: 11.0%
- Percentage of people 3 years and older in undergraduate colleges:
Mission Hill Projects: 84.0% Boston: 11.0%
- Percentage of people 3 years and older in grad. or professional schools:
Mission Hill Projects: 5.2% Boston: 4.3%
- Percentage of students K-12 enrolled in private schools:
Mission Hill Projects: 21.6% Boston: 13.8%
Percentage of population below poverty level:
| Mission Hill Projects: | 18.3% |
| Boston: | 17.1% |
Median year renter moved in (as recorded in 2022):
| Mission Hill Projects: | 1996 |
| Boston: | 2020 |
Percentage of married-couple families with both working:
| Mission Hill Projects: | 100.0% |
| Boston: | 78.2% |
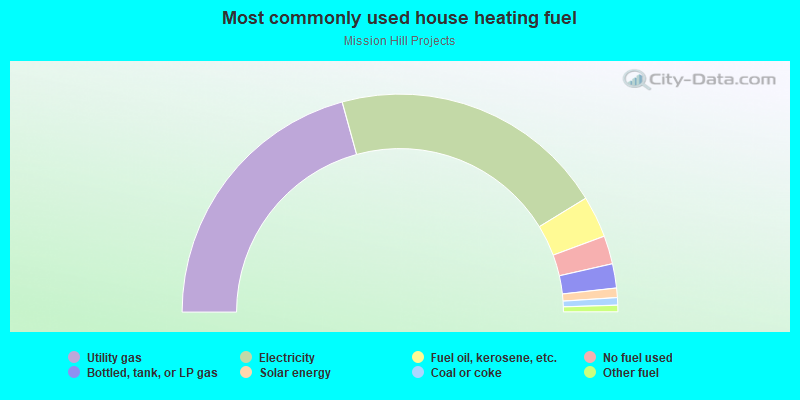
- 41.5%Utility gas
- 41.1%Electricity
- 6.2%Fuel oil, kerosene, etc.
- 4.2%No fuel used
- 3.6%Bottled, tank, or LP gas
- 1.4%Solar energy
- 1.1%Coal or coke
- 1.0%Other fuel
Roads and streets:
McGreevey Way
Length: 0.26 miles
Direction: E-W
Address range: 1 to 116
Direction: E-W
Address range: 1 to 116
Smith St
Length: 0.26 miles
Direction: E-W
Address range: 1 to 102
Direction: E-W
Address range: 1 to 102
Horadan Way
Length: 0.26 miles
Directions: E-W, SE-NW
Address range: 1 to 102
Directions: E-W, SE-NW
Address range: 1 to 102
Parker St
Length: 0.25 miles
Direction: SW-NE
Address range: 584 to 698
Direction: SW-NE
Address range: 584 to 698
Tremont St
Length: 0.18 miles
Direction: E-W
Address range: 1343 to 1495
Direction: E-W
Address range: 1343 to 1495
Alton Ct (Turquoise Way)
Length: 0.17 miles
Direction: SW-NE
Address range: 1 to 66
Direction: SW-NE
Address range: 1 to 66
Prentiss St
Length: 0.17 miles
Directions: E-W, SE-NW
Address range: 34 to 99
Directions: E-W, SE-NW
Address range: 34 to 99
Ward St
Length: 0.15 miles
Direction: E-W
Address range: 1 to 134
Direction: E-W
Address range: 1 to 134
Gurney St
Length: 0.12 miles
Directions: N-S, SE-NW, SW-NE
Address range: 1 to 99
Directions: N-S, SE-NW, SW-NE
Address range: 1 to 99
Mindoro St
Length: 0.11 miles
Direction: SW-NE
Address range: 1 to 99
Direction: SW-NE
Address range: 1 to 99
Huban Ct
Length: 0.11 miles
Direction: SW-NE
Address range: 1 to 44
Direction: SW-NE
Address range: 1 to 44
San Juan Way (Oregon Ct)
Length: 0.11 miles
Direction: SW-NE
Address range: 2 to 60
Direction: SW-NE
Address range: 2 to 60
Halleck St
Length: 0.11 miles
Direction: SW-NE
Address range: 100 to 199
Direction: SW-NE
Address range: 100 to 199
Tobin Ct
Length: 0.11 miles
Direction: SW-NE
Address range: 1 to 40
Direction: SW-NE
Address range: 1 to 40
Station St
Length: 0.11 miles
Direction: SE-NW
Address range: 1 to 99
Direction: SE-NW
Address range: 1 to 99
Cornelia Ct
Length: 0.05 miles
Direction: SW-NE
Address range: 9 to 44
Direction: SW-NE
Address range: 9 to 44
Faxon St
Length: 0.03 miles
Direction: SW-NE
Address range: 1 to 99
Direction: SW-NE
Address range: 1 to 99
Railroad features:
Mbta Commuter Rail (Mbta Orange Line RR, Amtrak RR)
Length: 0.21 miles
Direction: SW-NE
Direction: SW-NE