Montclair neighborhood in Denver, Colorado (CO), 80220 detailed profile
Settings
X


Business Search - 14 Million verified businesses
Area: 0.748 square miles
Population: 5,934
Population density:
| Montclair: | 7,936 people per square mile |
| Denver: | 4,651 people per square mile |

- 3,79356.1%White
- 1,22018.0%Black
- 76411.3%Hispanic or Latino
- 3655.4%Asian
- 3054.5%Native Hawaiian and Other
Pacific Islander - 2553.8%Two or more races
- 590.9%American Indian

Median household income in 2022:
| Montclair: | $97,861 |
| Denver: | $88,213 |
Distribution of median household income
![Distribution of median household income]()
- 96Less than $10,000
- 459$10,000 to $19,999
- 305$20,000 to $29,999
- 49$30,000 to $39,999
- 250$40,000 to $49,999
- 165$50,000 to $59,999
- 151$60,000 to $74,999
- 171$75,000 to $99,999
- 100$100,000 to $124,999
- 317$125,000 to $149,999
- 249$150,000 to $199,999
- 578$200,000 or more

Distribution of owner-occupied house/condo value
![Distribution of owner-occupied house/condo value]()
- 134Less than $50,000
- 42$50,000 to $99,999
- 37$300,000 to $399,999
- 147$400,000 to $499,999
- 407$500,000 to $749,999
- 801$750,000 to $999,999
- 259$1,000,000 or more

Distribution of rent paid by renters
![Distribution of rent paid by renters]()
- 18$100 to $199
- 104$200 to $299
- 102$400 to $499
- 85$500 to $599
- 91$600 to $699
- 71$700 to $799
- 219$800 to $899
- 206$900 to $999
- 345$1,000 to $1,249
- 105$1,250 to $1,499
- 135$1,500 to $1,999
- 200$2,000 or more

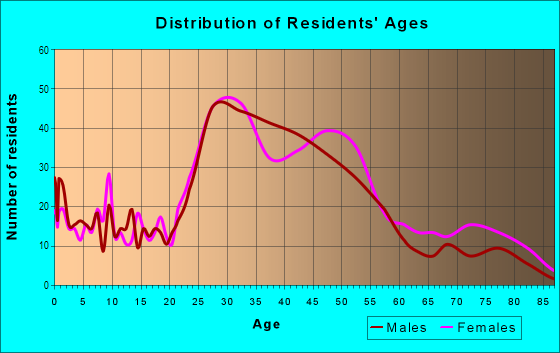
| Males: | 2,982 |
| Females: | 2,952 |
Males:
| This neighborhood: | 35.9 years |
| Whole city: | 35.2 years |
| This neighborhood: | 31.9 years |
| Whole city: | 35.1 years |
Average household size:
| Montclair: | 6.9 people |
| Denver: | 28.0 people |
Percentage of family households:
| Montclair: | 47.5% |
| Denver: | 35.1% |
| Here: | 60.2% |
| Denver: | 32.5% |
Percentage of married-couple families with children (among all households):
| Montclair: | 23.8% |
| Denver: | 32.4% |
Percentage of single-mother households (among all households):
| Montclair: | 6.9% |
| Denver: | 10.3% |
Percentage of never married males 15 years old and over:
Percentage of never married females 15 years old and over:
| Montclair: | 21.3% |
| Denver: | 25.0% |
Percentage of never married females 15 years old and over:
| Montclair: | 23.7% |
| city: | 20.8% |
Percentage of people that speak English not well or not at all:
| Montclair: | 0.0% |
| Denver: | 3.9% |
Percentage of people born in this state:
Percentage of people born in another U.S. state:
Percentage of native residents but born outside the U.S.:
Percentage of foreign born residents:
| Here: | 36.3% |
| Denver: | 38.5% |
Percentage of people born in another U.S. state:
| Montclair: | 50.8% |
| Denver: | 46.1% |
Percentage of native residents but born outside the U.S.:
| Here: | 2.4% |
| city: | 1.7% |
Percentage of foreign born residents:
| Here: | 10.5% |
| Denver: | 13.8% |

Owner-occupied
Renter-occupied


- Rooms in owner-occupied houses and condos in Montclair
- 01 room
- 02 rooms
- 1073 rooms
- 524 rooms
- 1135 rooms
- 2106 rooms
- 4417 rooms
- 2348 rooms
- 7139+ rooms

- Rooms in renter-occupied apartments in Montclair
- 1051 room
- 802 rooms
- 4133 rooms
- 1544 rooms
- 1095 rooms
- 986 rooms
- 637 rooms
- 418 rooms
- 99+ rooms
Owner-occupied
Renter-occupied

- Bedrooms in owner-occupied houses and condos in Montclair
- 0no bedroom
- 01 bedroom
- 3412 bedrooms
- 4603 bedrooms
- 6074 bedrooms
- 1145+ bedrooms

- Bedrooms in renter-occupied apartments in Montclair
- 105no bedroom
- 941 bedroom
- 2062 bedrooms
- 1693 bedrooms
- 594 bedrooms
- 05+ bedrooms
Average number of cars or other vehicles available in houses/condos:
Average number of cars or other vehicles available in apartments:
| This neighborhood: | 1.2 |
| Denver: | 1.9 |
Average number of cars or other vehicles available in apartments:
| Here: | 1.3 |
| city: | 1.3 |
Percentage of units with a mortgage:
| Montclair: | 60.0% |
| Denver: | 75.6% |
Average estimated value of detached houses in 2022 (81.2% of all units):
| Montclair: | $744,438 |
| Colorado: | $676,667 |

- Year house built in Montclair
- 02020 or later
- 882010 to 2019
- 1062000 to 2009
- 491990 to 1999
- 1171980 to 1989
- 3731970 to 1979
- 2071960 to 1969
- 3161950 to 1959
- 5551940 to 1949
- 8011939 or earlier

City-data.com crime index for city in 2020 (higher means more crime):
| City: | 519.0 |
| U.S. average: | 219.5 |
Travel time to work (commute)
![Travel time to work (commute)]()
- 46Less than 5 minutes
- 755 to 9 minutes
- 28810 to 14 minutes
- 49815 to 19 minutes
- 47120 to 24 minutes
- 16125 to 29 minutes
- 24330 to 34 minutes
- 5135 to 39 minutes
- 4140 to 44 minutes
- 15245 to 59 minutes
- 4660 to 89 minutes
- 3690 or more minutes

Means of transportation to work
![Means of transportation to work]()
- 68.1%2,148Drove a car alone
- 6.3%198Carpooled
- 4.9%155Bus
- 3.1%98Subway or elevated rail
- 1.0%33Long-distance train or commuter rail
- 0.4%13Light rail, streetcar or trolley
- 0.7%21Taxi
- 1.9%59Motorcycle
- 0.3%8Bicycle
- 7.9%249Walked
- 2.5%78Other means
- 13.5%426Worked at home

Time leaving home to go to work
![Time leaving home to go to work]()
- 3412:00 a.m. to 4:59 a.m.
- 665:00 a.m. to 5:29 a.m.
- 185:30 a.m. to 5:59 a.m.
- 1276:00 a.m. to 6:29 a.m.
- 1186:30 a.m. to 6:59 a.m.
- 3817:00 a.m. to 7:29 a.m.
- 3667:30 a.m. to 7:59 a.m.
- 3218:00 a.m. to 8:29 a.m.
- 2018:30 a.m. to 8:59 a.m.
- 969:00 a.m. to 9:59 a.m.
- 5010:00 a.m. to 10:59 a.m.
- 2511:00 a.m. to 11:59 a.m.
- 17012:00 p.m. to 3:59 p.m.
- 864:00 p.m. to 11:59 p.m.

Occupations of males:
- Percentage of males in management occupations (except farmers):
Here: 11.6% city: 15.4%
- Percentage of males in business and financial operations occupations:
Here: 2.7% city: 8.3%
- Percentage of males in computer and mathematical occupations:
Here: 5.3% city: 7.4%
- Percentage of males in architecture and engineering occupations:
Here: 3.8% city: 4.5%
- Percentage of males in community and social services occupations:
Here: 1.2% city: 0.9%
- Percentage of males in legal occupations:
Here: 5.7% city: 2.3%
- Percentage of males in education, training, and library occupations:
Here: 17.9% city: 3.1%
- Percentage of males in arts, design, entertainment, sports, and media occupations:
Here: 8.7% city: 3.1%
- Percentage of males in healthcare practitioners and technical occupations:
Here: 11.6% city: 3.5%
- Percentage of males in service occupations:
Here: 13.6% city: 11.9%
- Percentage of males in sales and office occupations:
Here: 14.3% city: 15.4%
- Percentage of males in construction, extraction, and maintenance occupations:
Here: 1.8% city: 8.0%
- Percentage of males in transportation occupations:
Here: 1.6% city: 4.2%
Occupations of females:
- Percentage of females in management occupations (except farmers):
Here: 11.8% city: 14.0%
- Percentage of females in business and financial operations occupations:
Here: 6.2% city: 10.0%
- Percentage of females in architecture and engineering occupations:
Here: 1.4% city: 1.5%
- Percentage of females in life, physical, and social science occupations:
Here: 1.5% city: 1.5%
- Percentage of females in community and social services occupations:
Here: 2.4% city: 3.0%
- Percentage of females in legal occupations:
Here: 5.4% city: 2.4%
- Percentage of females in education, training, and library occupations:
Here: 3.0% city: 7.9%
- Percentage of females in arts, design, entertainment, sports, and media occupations:
Here: 2.2% city: 3.8%
- Percentage of females in healthcare practitioners and technical occupations:
Here: 18.6% city: 10.2%
- Percentage of females in service occupations:
Here: 32.4% city: 16.2%
- Percentage of females in sales and office occupations:
Here: 15.4% city: 21.4%
- Percentage of females in transportation occupations:
Here: 1.2% city: 1.2%
- Percentage of females in material moving occupations:
Here: 2.0% city: 1.4%
Education in this neighborhood (subdivision or community):
- Percentage of people 3 years and older in K-12 schools:
Montclair: 17.1% Denver: 12.7%
- Percentage of people 3 years and older in undergraduate colleges:
Montclair: 26.5% Denver: 4.1%
- Percentage of people 3 years and older in grad. or professional schools:
Montclair: 2.9% Denver: 2.2%
- Percentage of students K-12 enrolled in private schools:
Montclair: 17.9% Denver: 11.0%
Percentage of population below poverty level:
| Montclair: | 7.3% |
| Denver: | 11.8% |
Median year renter moved in (as recorded in 2022):
| Montclair: | 2016 |
| Denver: | 2021 |
Percentage of married-couple families with both working:
| Montclair: | 87.9% |
| Denver: | 74.1% |

- 42.7%Utility gas
- 39.1%Electricity
- 11.6%No fuel used
- 5.1%Bottled, tank, or LP gas
- 1.4%Other fuel
Highways in this neighborhood:
I- 70 Bus (US Hwy 40, E Colfax Ave)
Length: 1.03 miles
Direction: E-W
Address range: 6000 to 7299
Direction: E-W
Address range: 6000 to 7299
Roads and streets:
Monaco Pkwy
Length: 1.33 miles
Direction: N-S
Address range: 901 to 1499
Direction: N-S
Address range: 901 to 1499
E 13th Ave
Length: 1.27 miles
Directions: E-W, SW-NE
Address range: 5700 to 7299
Directions: E-W, SW-NE
Address range: 5700 to 7299
E 14th Ave
Length: 1.26 miles
Directions: E-W, SE-NW, SW-NE
Address range: 5700 to 7299
Directions: E-W, SE-NW, SW-NE
Address range: 5700 to 7299
E 12th Ave
Length: 1.26 miles
Direction: E-W
Address range: 5700 to 7299
Direction: E-W
Address range: 5700 to 7299
E 11th Ave
Length: 1.26 miles
Direction: E-W
Address range: 5700 to 7299
Direction: E-W
Address range: 5700 to 7299
E 10th Ave
Length: 1.25 miles
Direction: E-W
Address range: 5700 to 7299
Direction: E-W
Address range: 5700 to 7299
E 9th Ave
Length: 1.09 miles
Direction: E-W
Address range: 5700 to 7999
Direction: E-W
Address range: 5700 to 7999
Olive St
Length: 0.67 miles
Directions: N-S, SE-NW, SW-NE
Address range: 900 to 1499
Directions: N-S, SE-NW, SW-NE
Address range: 900 to 1499
Krameria St
Length: 0.67 miles
Directions: N-S, SE-NW
Address range: 900 to 1499
Directions: N-S, SE-NW
Address range: 900 to 1499
Newport St
Length: 0.67 miles
Direction: N-S
Address range: 900 to 1499
Direction: N-S
Address range: 900 to 1499
Oneida St
Length: 0.67 miles
Direction: N-S
Address range: 900 to 1499
Direction: N-S
Address range: 900 to 1499
Pontiac St
Length: 0.67 miles
Direction: N-S
Address range: 900 to 1499
Direction: N-S
Address range: 900 to 1499
Jasmine St
Length: 0.67 miles
Direction: N-S
Address range: 900 to 1499
Direction: N-S
Address range: 900 to 1499
Locust St
Length: 0.67 miles
Direction: N-S
Address range: 900 to 1499
Direction: N-S
Address range: 900 to 1499
Leyden St
Length: 0.67 miles
Direction: N-S
Address range: 900 to 1499
Direction: N-S
Address range: 900 to 1499
Magnolia St
Length: 0.65 miles
Direction: N-S
Address range: 900 to 1499
Direction: N-S
Address range: 900 to 1499
Quebec St
Length: 0.60 miles
Direction: N-S
Address range: 864 to 1399
Direction: N-S
Address range: 864 to 1399
Poplar St
Length: 0.58 miles
Direction: N-S
Address range: 1000 to 1499
Direction: N-S
Address range: 1000 to 1499
Kearney St
Length: 0.58 miles
Direction: N-S
Address range: 900 to 1499
Direction: N-S
Address range: 900 to 1499
Niagara St
Length: 0.57 miles
Direction: N-S
Address range: 900 to 1499
Direction: N-S
Address range: 900 to 1499
Ivanhoe St
Length: 0.54 miles
Directions: N-S, SE-NW
Address range: 900 to 1399
Directions: N-S, SE-NW
Address range: 900 to 1399
Jersey St
Length: 0.54 miles
Direction: N-S
Address range: 900 to 1399
Direction: N-S
Address range: 900 to 1399
Ivy St
Length: 0.39 miles
Direction: N-S
Address range: 1000 to 1399
Direction: N-S
Address range: 1000 to 1399
Richthofen Pkwy (E Richthofen Pkwy)
Length: 0.33 miles
Directions: E-W, SE-NW, SW-NE
Address range: 6500 to 6899
Directions: E-W, SE-NW, SW-NE
Address range: 6500 to 6899
Richthofen Pl
Length: 0.32 miles
Direction: E-W
Address range: 6800 to 7299
Direction: E-W
Address range: 6800 to 7299
E Richthofen Place Pkwy (E Richthofen Pkwy)
Length: 0.32 miles
Direction: E-W
Direction: E-W
Oneida Pl
Length: 0.11 miles
Directions: N-S, SE-NW
Address range: 1100 to 1199
Directions: N-S, SE-NW
Address range: 1100 to 1199
Montclair Pl
Length: 0.05 miles
Direction: E-W
Address range: 7000 to 7099
Direction: E-W
Address range: 7000 to 7099
N Olive St
Length: 0.04 miles
Direction: SE-NW
Direction: SE-NW
E 8th Pl
Length: 0.01 miles
Direction: E-W
Direction: E-W