Moorpark neighborhood in Glendale, California (CA), 91204 detailed profile
Settings
X


Business Search - 14 Million verified businesses
Area: 0.164 square miles
Population: 2,075
Population density:
| Moorpark: | 12,646 people per square mile |
| Glendale: | 6,175 people per square mile |

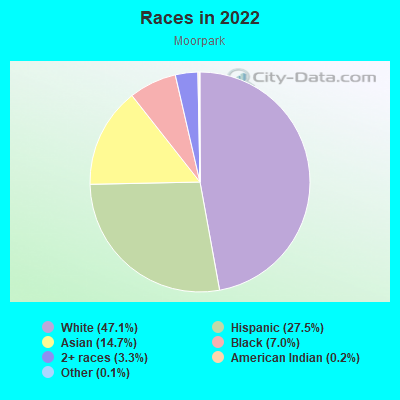
- 97947.1%White
- 57227.5%Hispanic or Latino
- 30514.7%Asian
- 1457.0%Black
- 683.3%Two or more races
- 50.2%American Indian
- 30.1%Some other race
Median household income in 2022:
| Moorpark: | $73,757 |
| Glendale: | $77,483 |
Distribution of median household income
![Distribution of median household income]()
- 17Less than $10,000
- 116$10,000 to $19,999
- 71$20,000 to $29,999
- 43$30,000 to $39,999
- 85$40,000 to $49,999
- 46$50,000 to $59,999
- 30$60,000 to $74,999
- 90$75,000 to $99,999
- 43$100,000 to $124,999
- 66$125,000 to $149,999
- 57$150,000 to $199,999
- 108$200,000 or more

Distribution of owner-occupied house/condo value
![Distribution of owner-occupied house/condo value]()
- 36Less than $50,000
- 12$50,000 to $99,999
- 36$250,000 to $299,999
- 9$300,000 to $399,999
- 24$400,000 to $499,999
- 96$500,000 to $749,999
- 53$750,000 to $999,999
- 43$1,000,000 or more

Distribution of rent paid by renters
![Distribution of rent paid by renters]()
- 40$200 to $299
- 27$300 to $399
- 12$400 to $499
- 22$500 to $599
- 51$600 to $699
- 66$800 to $899
- 20$900 to $999
- 59$1,000 to $1,249
- 24$1,250 to $1,499
- 83$1,500 to $1,999
- 285$2,000 or more

Median rent in 2022:
| Moorpark: | $1,937 |
| Glendale: | $1,842 |
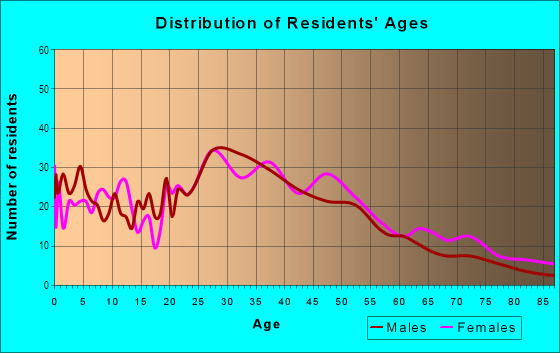
| Males: | 965 |
| Females: | 1,110 |
Males:
| This neighborhood: | 37.9 years |
| Whole city: | 41.8 years |
| This neighborhood: | 43.3 years |
| Whole city: | 43.4 years |
Average household size:
| Moorpark: | 2.6 people |
| Glendale: | 2.5 people |
Percentage of family households:
| Moorpark: | 38.4% |
| Glendale: | 40.0% |
| Here: | 40.9% |
| Glendale: | 44.2% |
Percentage of married-couple families with children (among all households):
| Moorpark: | 26.8% |
| Glendale: | 30.5% |
Percentage of single-mother households (among all households):
| Moorpark: | 8.5% |
| Glendale: | 7.0% |
Percentage of never married males 15 years old and over:
Percentage of never married females 15 years old and over:
| Moorpark: | 19.6% |
| Glendale: | 18.4% |
Percentage of never married females 15 years old and over:
| Moorpark: | 23.5% |
| city: | 18.3% |
Percentage of people that speak English not well or not at all:
| Moorpark: | 14.3% |
| Glendale: | 12.5% |
Percentage of people born in this state:
Percentage of people born in another U.S. state:
Percentage of native residents but born outside the U.S.:
Percentage of foreign born residents:
| Here: | 32.0% |
| Glendale: | 38.0% |
Percentage of people born in another U.S. state:
| Moorpark: | 10.7% |
| Glendale: | 11.6% |
Percentage of native residents but born outside the U.S.:
| Here: | 0.8% |
| city: | 1.5% |
Percentage of foreign born residents:
| Here: | 56.5% |
| Glendale: | 48.9% |
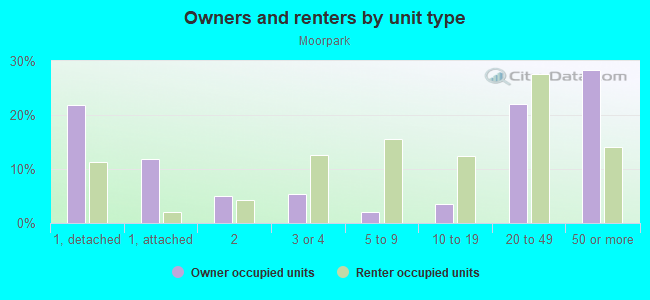
Owner-occupied
Renter-occupied

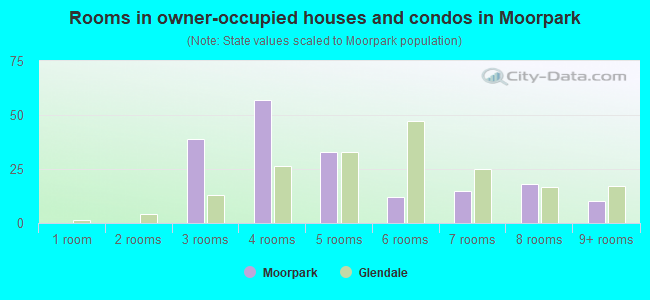
- Rooms in owner-occupied houses and condos in Moorpark
- 01 room
- 02 rooms
- 393 rooms
- 574 rooms
- 335 rooms
- 126 rooms
- 157 rooms
- 188 rooms
- 109+ rooms
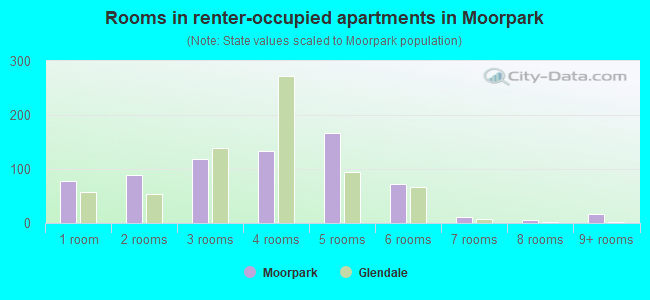
- Rooms in renter-occupied apartments in Moorpark
- 781 room
- 892 rooms
- 1193 rooms
- 1334 rooms
- 1675 rooms
- 736 rooms
- 117 rooms
- 68 rooms
- 169+ rooms
Owner-occupied
Renter-occupied
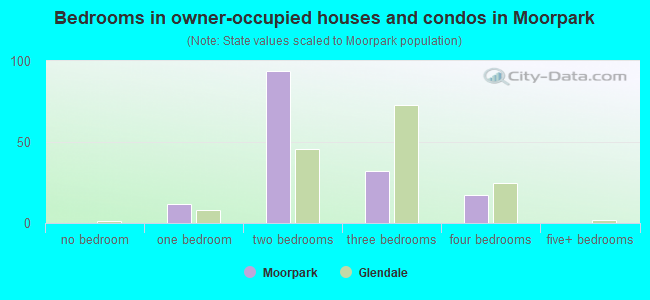
- Bedrooms in owner-occupied houses and condos in Moorpark
- 0no bedroom
- 121 bedroom
- 942 bedrooms
- 323 bedrooms
- 174 bedrooms
- 05+ bedrooms
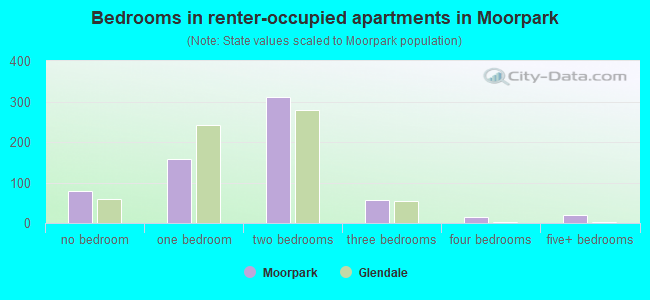
- Bedrooms in renter-occupied apartments in Moorpark
- 78no bedroom
- 1571 bedroom
- 3122 bedrooms
- 583 bedrooms
- 164 bedrooms
- 205+ bedrooms
Average number of cars or other vehicles available in houses/condos:
Average number of cars or other vehicles available in apartments:
| This neighborhood: | 1.9 |
| Glendale: | 2.0 |
Average number of cars or other vehicles available in apartments:
| Here: | 1.5 |
| city: | 1.4 |
Percentage of units with a mortgage:
| Moorpark: | 67.8% |
| Glendale: | 73.0% |
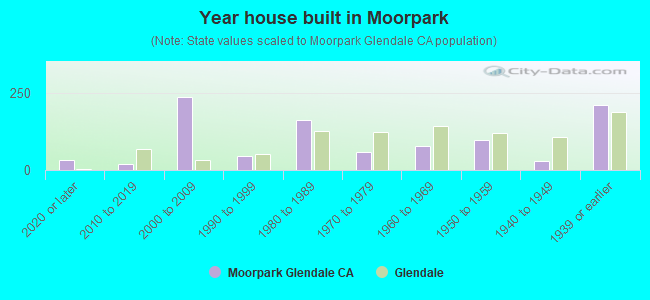
- Year house built in Moorpark
- 342020 or later
- 182010 to 2019
- 2362000 to 2009
- 441990 to 1999
- 1611980 to 1989
- 571970 to 1979
- 771960 to 1969
- 991950 to 1959
- 301940 to 1949
- 2101939 or earlier
City-data.com crime index for city in 2020 (higher means more crime):
| City: | 110.5 |
| U.S. average: | 219.5 |
Travel time to work (commute)
![Travel time to work (commute)]()
- 3Less than 5 minutes
- 575 to 9 minutes
- 7110 to 14 minutes
- 22415 to 19 minutes
- 9720 to 24 minutes
- 725 to 29 minutes
- 17330 to 34 minutes
- 1035 to 39 minutes
- 6740 to 44 minutes
- 9345 to 59 minutes
- 2860 to 89 minutes
- 3190 or more minutes

Means of transportation to work
![Means of transportation to work]()
- 72.7%699Drove a car alone
- 3.5%34Carpooled
- 2.2%21Bus
- 1.2%12Bicycle
- 4.8%46Walked
- 3.3%32Other means
- 12.4%119Worked at home

Time leaving home to go to work
![Time leaving home to go to work]()
- 3212:00 a.m. to 4:59 a.m.
- 175:00 a.m. to 5:29 a.m.
- 65:30 a.m. to 5:59 a.m.
- 556:00 a.m. to 6:29 a.m.
- 146:30 a.m. to 6:59 a.m.
- 1177:00 a.m. to 7:29 a.m.
- 607:30 a.m. to 7:59 a.m.
- 1068:00 a.m. to 8:29 a.m.
- 838:30 a.m. to 8:59 a.m.
- 1389:00 a.m. to 9:59 a.m.
- 16410:00 a.m. to 10:59 a.m.
- 511:00 a.m. to 11:59 a.m.
- 3412:00 p.m. to 3:59 p.m.
- 164:00 p.m. to 11:59 p.m.

Occupations of males:
- Percentage of males in management occupations (except farmers):
Here: 11.8% city: 12.9%
- Percentage of males in business and financial operations occupations:
Here: 1.2% city: 4.8%
- Percentage of males in computer and mathematical occupations:
Here: 9.4% city: 5.2%
- Percentage of males in architecture and engineering occupations:
Here: 2.4% city: 4.1%
- Percentage of males in community and social services occupations:
Here: 1.0% city: 1.3%
- Percentage of males in arts, design, entertainment, sports, and media occupations:
Here: 9.0% city: 8.9%
- Percentage of males in healthcare practitioners and technical occupations:
Here: 1.4% city: 5.5%
- Percentage of males in service occupations:
Here: 14.9% city: 11.8%
- Percentage of males in sales and office occupations:
Here: 21.1% city: 18.3%
- Percentage of males in construction, extraction, and maintenance occupations:
Here: 4.6% city: 5.5%
- Percentage of males in production occupations:
Here: 8.0% city: 4.2%
- Percentage of males in transportation occupations:
Here: 10.3% city: 6.0%
Occupations of females:
- Percentage of females in management occupations (except farmers):
Here: 10.9% city: 10.3%
- Percentage of females in business and financial operations occupations:
Here: 10.0% city: 6.1%
- Percentage of females in life, physical, and social science occupations:
Here: 1.0% city: 1.5%
- Percentage of females in community and social services occupations:
Here: 1.4% city: 2.8%
- Percentage of females in education, training, and library occupations:
Here: 14.5% city: 9.4%
- Percentage of females in arts, design, entertainment, sports, and media occupations:
Here: 15.0% city: 6.1%
- Percentage of females in healthcare practitioners and technical occupations:
Here: 6.3% city: 10.7%
- Percentage of females in service occupations:
Here: 15.7% city: 18.3%
- Percentage of females in sales and office occupations:
Here: 18.8% city: 26.5%
- Percentage of females in farming, fishing, and forestry occupations:
Here: 1.6% city: 0.2%
- Percentage of females in production occupations:
Here: 3.6% city: 1.5%
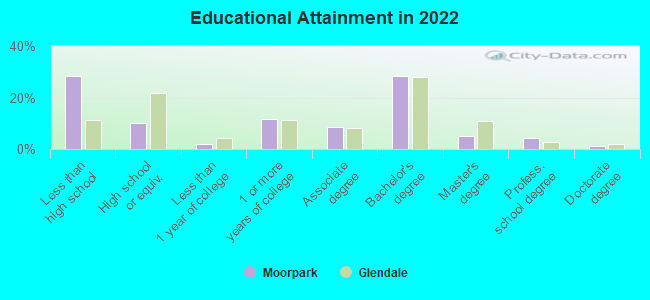
Education in this neighborhood (subdivision or community):
- Percentage of people 3 years and older in K-12 schools:
Moorpark: 18.2% Glendale: 14.1%
- Percentage of people 3 years and older in undergraduate colleges:
Moorpark: 5.4% Glendale: 5.2%
- Percentage of people 3 years and older in grad. or professional schools:
Moorpark: 2.5% Glendale: 1.9%
- Percentage of students K-12 enrolled in private schools:
Moorpark: 67.0% Glendale: 9.3%
Percentage of population below poverty level:
| Moorpark: | 14.0% |
| Glendale: | 13.0% |
Median year owner moved in (as recorded in 2022):
Median year renter moved in (as recorded in 2022):
| Moorpark: | 2005 |
| Glendale: | 2007 |
Median year renter moved in (as recorded in 2022):
| Moorpark: | 2014 |
| Glendale: | 2018 |
Percentage of married-couple families with both working:
| Moorpark: | 73.5% |
| Glendale: | 66.7% |
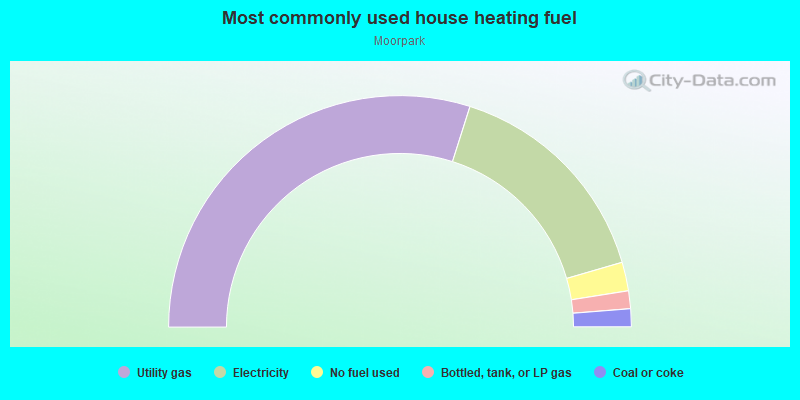
- 59.8%Utility gas
- 31.2%Electricity
- 4.0%No fuel used
- 2.5%Bottled, tank, or LP gas
- 2.5%Coal or coke
Highways in this neighborhood:
N San Fernando Rd (San Fernando Rd)
Length: 0.19 miles
Direction: SE-NW
Address range: 5100 to 5199
Direction: SE-NW
Address range: 5100 to 5199
Roads and streets:
Ivy St
Length: 0.50 miles
Direction: E-W
Address range: 500 to 799
Direction: E-W
Address range: 500 to 799
Hawthorne St
Length: 0.47 miles
Direction: E-W
Address range: 500 to 799
Direction: E-W
Address range: 500 to 799
W Harvard St
Length: 0.45 miles
Directions: E-W, SE-NW
Address range: 500 to 799
Directions: E-W, SE-NW
Address range: 500 to 799
W Colorado St
Length: 0.42 miles
Direction: E-W
Address range: 400 to 591
Direction: E-W
Address range: 400 to 591
S Pacific Ave
Length: 0.23 miles
Directions: N-S, SW-NE
Address range: 124 to 299
Directions: N-S, SW-NE
Address range: 124 to 299
Oak St
Length: 0.22 miles
Direction: E-W
Address range: 500 to 599
Direction: E-W
Address range: 500 to 599
S Kenilworth Ave
Length: 0.12 miles
Direction: N-S
Address range: 200 to 299
Direction: N-S
Address range: 200 to 299