Mound View neighborhood in Cedar Rapids, Iowa (IA), 52402 detailed profile
Settings
X


Business Search - 14 Million verified businesses
Area: 0.671 square miles
Population: 3,066
Population density:
| Mound View: | 4,568 people per square mile |
| Cedar Rapids: | 2,161 people per square mile |

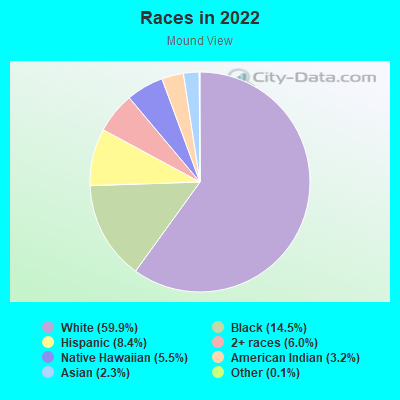
- 2,12359.9%White
- 51314.5%Black
- 2988.4%Hispanic or Latino
- 2146.0%Two or more races
- 1955.5%Native Hawaiian and Other
Pacific Islander - 1133.2%American Indian
- 822.3%Asian
- 40.1%Some other race
Median household income in 2022:
| Mound View: | $60,108 |
| Cedar Rapids: | $64,435 |
Distribution of median household income
![Distribution of median household income]()
- 210Less than $10,000
- 151$10,000 to $19,999
- 192$20,000 to $29,999
- 255$30,000 to $39,999
- 116$40,000 to $49,999
- 141$50,000 to $59,999
- 93$60,000 to $74,999
- 76$75,000 to $99,999
- 68$100,000 to $124,999
- 112$125,000 to $149,999
- 44$150,000 to $199,999
- 15$200,000 or more

Distribution of owner-occupied house/condo value
![Distribution of owner-occupied house/condo value]()
- 421Less than $50,000
- 293$50,000 to $99,999
- 290$100,000 to $149,999
- 195$150,000 to $199,999
- 191$200,000 to $249,999
- 394$250,000 to $299,999
- 153$300,000 to $399,999
- 12$400,000 to $499,999
- 57$500,000 to $749,999
- 12$1,000,000 or more

Distribution of rent paid by renters
![Distribution of rent paid by renters]()
- 255$200 to $299
- 9$300 to $399
- 242$400 to $499
- 407$500 to $599
- 216$600 to $699
- 136$700 to $799
- 23$800 to $899
- 35$900 to $999
- 83$1,000 to $1,249
- 41$1,250 to $1,499
- 28$1,500 to $1,999
- 15$2,000 or more

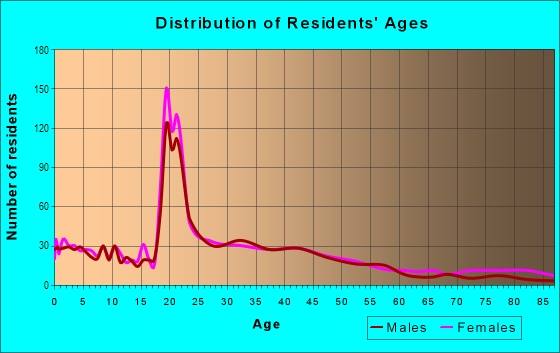
| Males: | 1,521 |
| Females: | 1,545 |
Males:
| This neighborhood: | 32.0 years |
| Whole city: | 39.0 years |
| This neighborhood: | 38.8 years |
| Whole city: | 39.2 years |
Average household size:
| Mound View: | 5.1 people |
| Cedar Rapids: | 2.3 people |
Percentage of family households:
| Mound View: | 28.5% |
| Cedar Rapids: | 40.6% |
| Here: | 23.6% |
| Cedar Rapids: | 40.3% |
Percentage of married-couple families with children (among all households):
| Mound View: | 12.8% |
| Cedar Rapids: | 28.1% |
Percentage of single-mother households (among all households):
| Mound View: | 24.0% |
| Cedar Rapids: | 11.2% |
Percentage of never married males 15 years old and over:
Percentage of never married females 15 years old and over:
| Mound View: | 24.8% |
| Cedar Rapids: | 19.7% |
Percentage of never married females 15 years old and over:
| Mound View: | 28.5% |
| city: | 19.4% |
Percentage of people that speak English not well or not at all:
| Mound View: | 0.3% |
| Cedar Rapids: | 1.4% |
Percentage of people born in this state:
Percentage of people born in another U.S. state:
Percentage of native residents but born outside the U.S.:
Percentage of foreign born residents:
| Here: | 59.4% |
| Cedar Rapids: | 69.8% |
Percentage of people born in another U.S. state:
| Mound View: | 31.7% |
| Cedar Rapids: | 23.6% |
Percentage of native residents but born outside the U.S.:
| Here: | 1.9% |
| city: | 1.0% |
Percentage of foreign born residents:
| Here: | 7.0% |
| Cedar Rapids: | 5.6% |
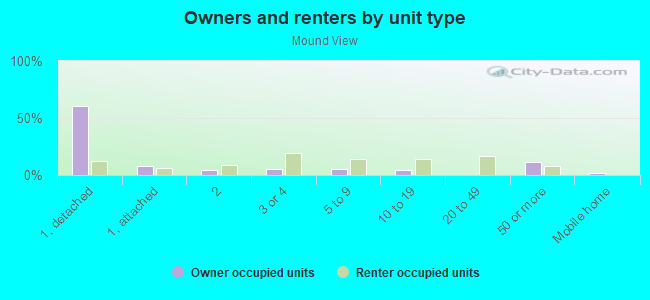
Owner-occupied
Renter-occupied

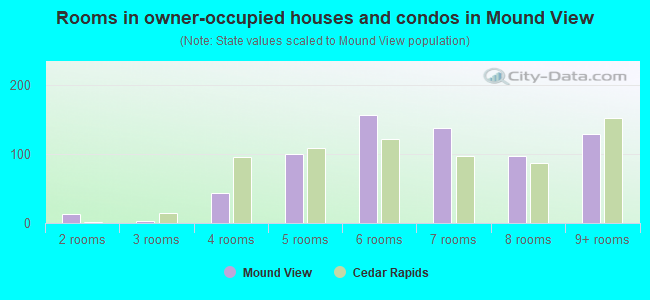
- Rooms in owner-occupied houses and condos in Mound View
- 01 room
- 132 rooms
- 33 rooms
- 434 rooms
- 995 rooms
- 1566 rooms
- 1377 rooms
- 978 rooms
- 1299+ rooms
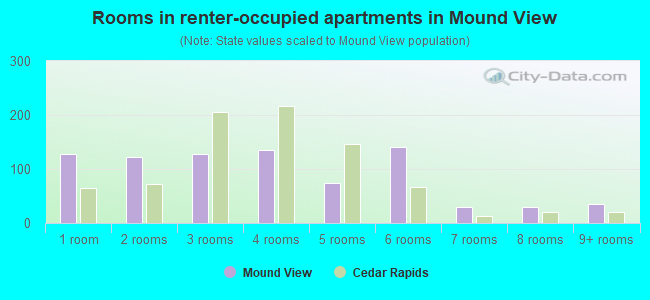
- Rooms in renter-occupied apartments in Mound View
- 1281 room
- 1232 rooms
- 1283 rooms
- 1364 rooms
- 755 rooms
- 1406 rooms
- 307 rooms
- 308 rooms
- 359+ rooms
Owner-occupied
Renter-occupied
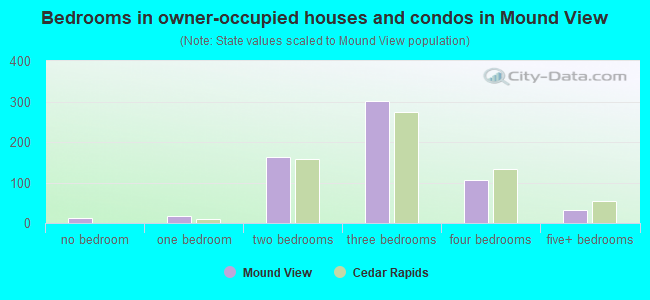
- Bedrooms in owner-occupied houses and condos in Mound View
- 13no bedroom
- 181 bedroom
- 1622 bedrooms
- 3013 bedrooms
- 1064 bedrooms
- 325+ bedrooms
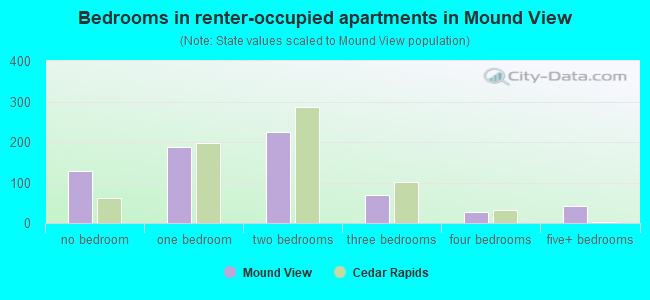
- Bedrooms in renter-occupied apartments in Mound View
- 128no bedroom
- 1881 bedroom
- 2252 bedrooms
- 703 bedrooms
- 284 bedrooms
- 425+ bedrooms
Average number of cars or other vehicles available in houses/condos:
Average number of cars or other vehicles available in apartments:
| This neighborhood: | 1.9 |
| Cedar Rapids: | 2.0 |
Average number of cars or other vehicles available in apartments:
| Here: | 1.0 |
| city: | 1.3 |
Percentage of units with a mortgage:
| Mound View: | 70.1% |
| Cedar Rapids: | 61.9% |
Average estimated value of detached houses in 2022 (56.9% of all units):
| Mound View: | $123,131 |
| Cedar Rapids: | $213,360 |
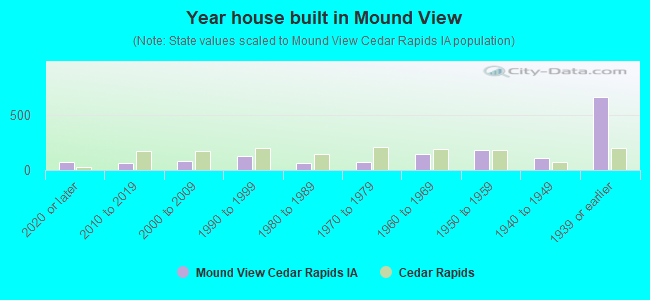
- Year house built in Mound View
- 722020 or later
- 602010 to 2019
- 802000 to 2009
- 1301990 to 1999
- 661980 to 1989
- 731970 to 1979
- 1441960 to 1969
- 1851950 to 1959
- 1081940 to 1949
- 6631939 or earlier
City-data.com crime index for city in 2020 (higher means more crime):
| City: | 255.6 |
| U.S. average: | 219.5 |
Travel time to work (commute)
![Travel time to work (commute)]()
- 90Less than 5 minutes
- 2855 to 9 minutes
- 33510 to 14 minutes
- 36915 to 19 minutes
- 13320 to 24 minutes
- 3425 to 29 minutes
- 10030 to 34 minutes
- 635 to 39 minutes
- 2040 to 44 minutes
- 10345 to 59 minutes
- 2560 to 89 minutes
- 1190 or more minutes

Means of transportation to work
![Means of transportation to work]()
- 62.2%858Drove a car alone
- 8.6%118Carpooled
- 2.9%40Bus
- 5.2%72Bicycle
- 24.3%335Walked
- 3.4%47Other means
- 7.7%106Worked at home

Time leaving home to go to work
![Time leaving home to go to work]()
- 2612:00 a.m. to 4:59 a.m.
- 425:00 a.m. to 5:29 a.m.
- 285:30 a.m. to 5:59 a.m.
- 1316:00 a.m. to 6:29 a.m.
- 1296:30 a.m. to 6:59 a.m.
- 1507:00 a.m. to 7:29 a.m.
- 1857:30 a.m. to 7:59 a.m.
- 1888:00 a.m. to 8:29 a.m.
- 808:30 a.m. to 8:59 a.m.
- 1779:00 a.m. to 9:59 a.m.
- 2610:00 a.m. to 10:59 a.m.
- 2811:00 a.m. to 11:59 a.m.
- 13512:00 p.m. to 3:59 p.m.
- 1324:00 p.m. to 11:59 p.m.

Occupations of males:
- Percentage of males in management occupations (except farmers):
Here: 7.3% city: 9.9%
- Percentage of males in business and financial operations occupations:
Here: 2.7% city: 4.2%
- Percentage of males in computer and mathematical occupations:
Here: 5.3% city: 6.3%
- Percentage of males in architecture and engineering occupations:
Here: 1.2% city: 4.6%
- Percentage of males in community and social services occupations:
Here: 2.6% city: 1.1%
- Percentage of males in education, training, and library occupations:
Here: 5.4% city: 2.2%
- Percentage of males in healthcare practitioners and technical occupations:
Here: 1.7% city: 1.9%
- Percentage of males in service occupations:
Here: 27.5% city: 12.0%
- Percentage of males in sales and office occupations:
Here: 16.6% city: 15.0%
- Percentage of males in construction, extraction, and maintenance occupations:
Here: 4.8% city: 8.1%
- Percentage of males in production occupations:
Here: 9.4% city: 12.0%
- Percentage of males in transportation occupations:
Here: 4.7% city: 5.5%
- Percentage of males in material moving occupations:
Here: 7.3% city: 6.3%
Occupations of females:
- Percentage of females in management occupations (except farmers):
Here: 6.7% city: 8.2%
- Percentage of females in business and financial operations occupations:
Here: 1.9% city: 8.1%
- Percentage of females in computer and mathematical occupations:
Here: 3.0% city: 1.2%
- Percentage of females in architecture and engineering occupations:
Here: 2.5% city: 1.1%
- Percentage of females in education, training, and library occupations:
Here: 10.1% city: 7.5%
- Percentage of females in arts, design, entertainment, sports, and media occupations:
Here: 2.6% city: 1.5%
- Percentage of females in healthcare practitioners and technical occupations:
Here: 2.2% city: 9.7%
- Percentage of females in service occupations:
Here: 32.3% city: 19.8%
- Percentage of females in sales and office occupations:
Here: 32.3% city: 28.7%
- Percentage of females in production occupations:
Here: 3.2% city: 5.4%
- Percentage of females in transportation occupations:
Here: 3.9% city: 1.0%
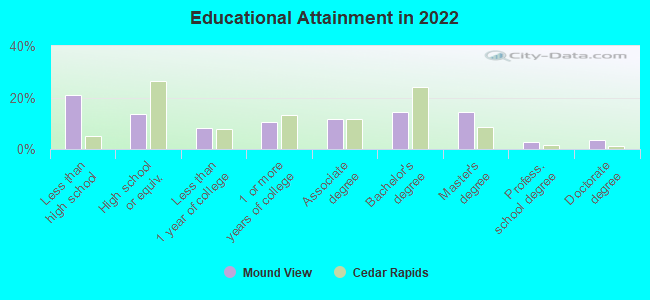
Education in this neighborhood (subdivision or community):
- Percentage of people 3 years and older in K-12 schools:
Mound View: 20.7% Cedar Rapids: 15.7%
- Percentage of people 3 years and older in undergraduate colleges:
Mound View: 34.3% Cedar Rapids: 5.7%
- Percentage of people 3 years and older in grad. or professional schools:
Mound View: 1.4% Cedar Rapids: 0.8%
- Percentage of students K-12 enrolled in private schools:
Mound View: 32.4% Cedar Rapids: 12.8%
Percentage of population below poverty level:
| Mound View: | 16.7% |
| Cedar Rapids: | 11.4% |
Median year owner moved in (as recorded in 2022):
| Mound View: | 2007 |
| Cedar Rapids: | 2012 |
Percentage of married-couple families with both working:
| Mound View: | 92.2% |
| Cedar Rapids: | 71.3% |
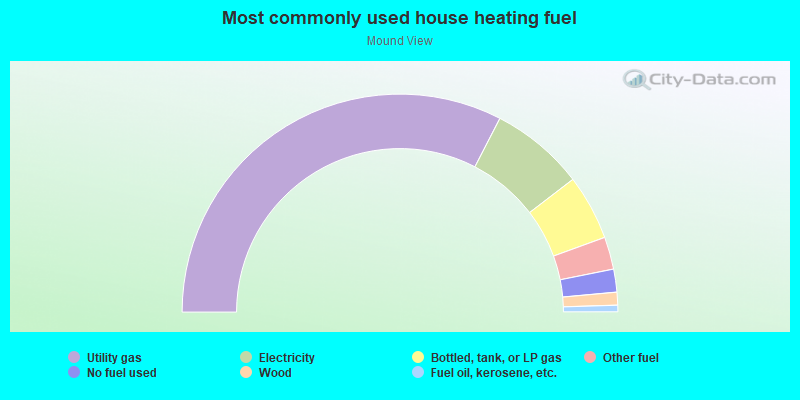
- 65.1%Utility gas
- 14.0%Electricity
- 9.7%Bottled, tank, or LP gas
- 4.8%Other fuel
- 3.4%No fuel used
- 1.9%Wood
- 1.0%Fuel oil, kerosene, etc.
Highways in this neighborhood:
1st Ave E (US Hwy 151 Bus, 1st Ave NE, 1st Ave SE)
Length: 1.17 miles
Direction: SW-NE
Address range: 1300 to 1999
Direction: SW-NE
Address range: 1300 to 1999
Roads and streets:
C Ave NE
Length: 1.17 miles
Direction: SW-NE
Address range: 1300 to 1999
Direction: SW-NE
Address range: 1300 to 1999
Length: 1.17 miles
Direction: SW-NE
Address range: 1301 to 1999
Direction: SW-NE
Address range: 1301 to 1999
E Ave NE
Length: 1.04 miles
Direction: SW-NE
Address range: 1400 to 1999
Direction: SW-NE
Address range: 1400 to 1999
A Ave NE
Length: 1.04 miles
Direction: SW-NE
Address range: 1400 to 1999
Direction: SW-NE
Address range: 1400 to 1999
16th St NE
Length: 0.87 miles
Directions: N-S, SE-NW
Address range: 100 to 1099
Directions: N-S, SE-NW
Address range: 100 to 1099
17th St NE
Length: 0.79 miles
Directions: N-S, SE-NW
Address range: 100 to 1099
Directions: N-S, SE-NW
Address range: 100 to 1099
D Ave NE
Length: 0.76 miles
Direction: SW-NE
Address range: 1300 to 1899
Direction: SW-NE
Address range: 1300 to 1899
14th St NE
Length: 0.51 miles
Directions: N-S, SE-NW
Address range: 100 to 899
Directions: N-S, SE-NW
Address range: 100 to 899
19th St NE
Length: 0.49 miles
Direction: SE-NW
Address range: 100 to 699
Direction: SE-NW
Address range: 100 to 699
F Ave NE
Length: 0.48 miles
Direction: SW-NE
Address range: 1600 to 1899
Direction: SW-NE
Address range: 1600 to 1899
I Ave NE
Length: 0.48 miles
Directions: E-W, SW-NE
Address range: 1500 to 1799
Directions: E-W, SW-NE
Address range: 1500 to 1799
15th St NE
Length: 0.46 miles
Direction: SE-NW
Address range: 100 to 699
Direction: SE-NW
Address range: 100 to 699
J Ave NE
Length: 0.44 miles
Direction: E-W
Address range: 1500 to 1899
Direction: E-W
Address range: 1500 to 1899
20th St NE
Length: 0.42 miles
Direction: SE-NW
Address range: 100 to 599
Direction: SE-NW
Address range: 100 to 599
18th St NE
Length: 0.42 miles
Direction: SE-NW
Address range: 100 to 599
Direction: SE-NW
Address range: 100 to 599
Center Point Rd NE (Necollege Dr)
Length: 0.34 miles
Direction: SE-NW
Address range: 100 to 499
Direction: SE-NW
Address range: 100 to 499
Maplewood Dr NE
Length: 0.29 miles
Direction: N-S
Address range: 900 to 1099
Direction: N-S
Address range: 900 to 1099
Gwendolyn Dr NE
Length: 0.17 miles
Direction: SE-NW
Address range: 400 to 599
Direction: SE-NW
Address range: 400 to 599
Dunreath Dr NE
Length: 0.16 miles
Direction: SE-NW
Address range: 400 to 599
Direction: SE-NW
Address range: 400 to 599
Longwood Dr NE
Length: 0.16 miles
Direction: SE-NW
Address range: 400 to 599
Direction: SE-NW
Address range: 400 to 599
H Ave NE
Length: 0.15 miles
Direction: E-W
Address range: 1400 to 1599
Direction: E-W
Address range: 1400 to 1599
Greene Ave NE
Length: 0.13 miles
Direction: E-W
Address range: 1600 to 1699
Direction: E-W
Address range: 1600 to 1699
Railroad features:
Chicago Central & Pacific RR
Length: 1.43 miles
Directions: E-W, SW-NE
Directions: E-W, SW-NE
Chicago Central and Pacific RR
Length: 1.14 miles
Directions: E-W, SW-NE
Directions: E-W, SW-NE