Nearman neighborhood in Kansas City, Kansas (KS), 66104, 66109 detailed profile
Settings
X

Business Search - 14 Million verified businesses
Area: 3.285 square miles
Population: 2,025
Population density:
| Nearman: | 617 people per square mile |
| Kansas City: | 1,228 people per square mile |

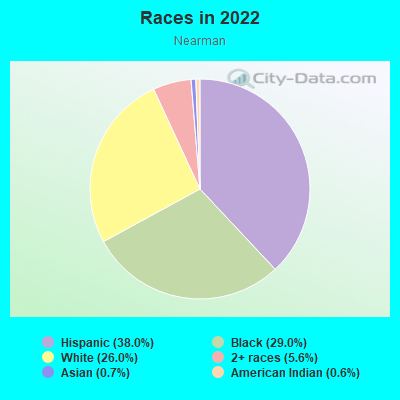
- 77138.0%Hispanic or Latino
- 59029.0%Black
- 52926.0%White
- 1135.6%Two or more races
- 150.7%Asian
- 130.6%American Indian
Distribution of median household income
![Distribution of median household income]()
- 24Less than $10,000
- 229$10,000 to $19,999
- 62$20,000 to $29,999
- 82$30,000 to $39,999
- 37$40,000 to $49,999
- 107$50,000 to $59,999
- 59$60,000 to $74,999
- 101$75,000 to $99,999
- 39$100,000 to $124,999
- 59$125,000 to $149,999
- 41$150,000 to $199,999
- 17$200,000 or more

Distribution of owner-occupied house/condo value
![Distribution of owner-occupied house/condo value]()
- 31Less than $50,000
- 391$50,000 to $99,999
- 157$100,000 to $149,999
- 86$150,000 to $199,999
- 56$200,000 to $249,999
- 26$250,000 to $299,999
- 4$300,000 to $399,999
- 9$400,000 to $499,999
- 20$500,000 to $749,999
- 6$1,000,000 or more

Distribution of rent paid by renters
![Distribution of rent paid by renters]()
- 29Less than $100
- 99$100 to $199
- 42$200 to $299
- 10$400 to $499
- 40$500 to $599
- 15$600 to $699
- 103$700 to $799
- 76$800 to $899
- 16$900 to $999
- 30$1,000 to $1,249
- 2$1,250 to $1,499

| Males: | 845 |
| Females: | 1,180 |
Males:
| This neighborhood: | |
| Whole city: |
| This neighborhood: | |
| Whole city: |
Percentage of family households:
| Nearman: | 49.8% |
| Kansas City: | 46.3% |
| Here: | 44.2% |
| Kansas City: | 36.4% |
Percentage of married-couple families with children (among all households):
| Nearman: | 12.8% |
| Kansas City: | 21.3% |
Percentage of single-mother households (among all households):
| Nearman: | 18.5% |
| Kansas City: | 11.5% |
Percentage of never married males 15 years old and over:
Percentage of never married females 15 years old and over:
| Nearman: | 22.5% |
| Kansas City: | 21.9% |
Percentage of never married females 15 years old and over:
| Nearman: | 20.4% |
| city: | 19.6% |
Percentage of people that speak English not well or not at all:
| Nearman: | 0.0% |
| Kansas City: | 8.4% |
Percentage of people born in this state:
Percentage of people born in another U.S. state:
Percentage of native residents but born outside the U.S.:
Percentage of foreign born residents:
| Here: | 57.7% |
| Kansas City: | 53.9% |
Percentage of people born in another U.S. state:
| Nearman: | 30.7% |
| Kansas City: | 28.8% |
Percentage of native residents but born outside the U.S.:
| Here: | 3.8% |
| city: | 1.1% |
Percentage of foreign born residents:
| Here: | 8.3% |
| Kansas City: | 16.3% |
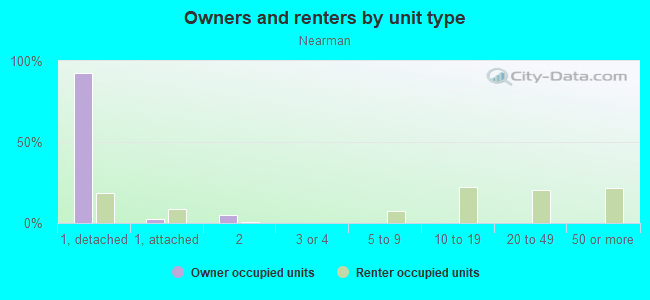
Owner-occupied
Renter-occupied

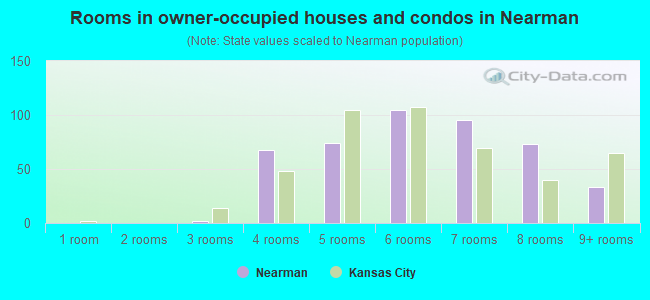
- Rooms in owner-occupied houses and condos in Nearman
- 01 room
- 02 rooms
- 23 rooms
- 684 rooms
- 745 rooms
- 1056 rooms
- 957 rooms
- 738 rooms
- 339+ rooms
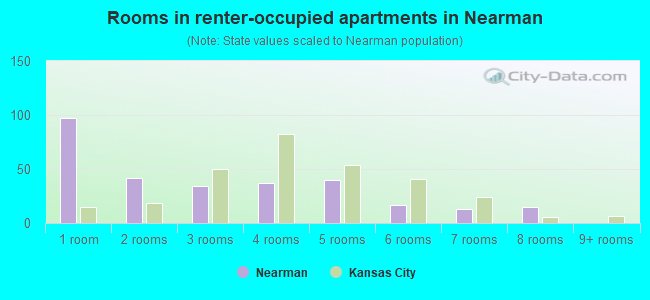
- Rooms in renter-occupied apartments in Nearman
- 971 room
- 422 rooms
- 343 rooms
- 374 rooms
- 405 rooms
- 176 rooms
- 137 rooms
- 158 rooms
- 09+ rooms
Owner-occupied
Renter-occupied
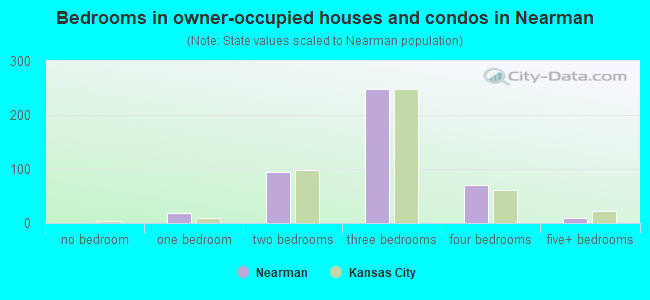
- Bedrooms in owner-occupied houses and condos in Nearman
- 0no bedroom
- 191 bedroom
- 952 bedrooms
- 2493 bedrooms
- 714 bedrooms
- 105+ bedrooms
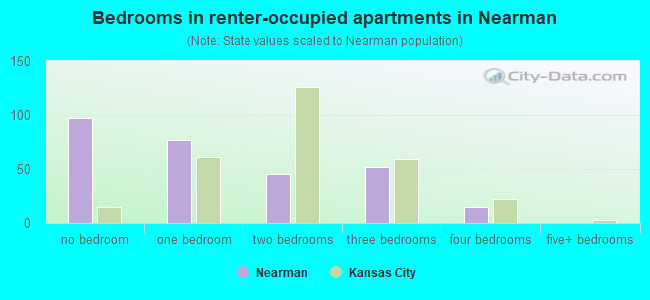
- Bedrooms in renter-occupied apartments in Nearman
- 97no bedroom
- 771 bedroom
- 452 bedrooms
- 523 bedrooms
- 154 bedrooms
- 05+ bedrooms
Average number of cars or other vehicles available in houses/condos:
Average number of cars or other vehicles available in apartments:
| This neighborhood: | |
| Kansas City: |
Average number of cars or other vehicles available in apartments:
| Here: | |
| city: |
Percentage of units with a mortgage:
| Nearman: | 72.2% |
| Kansas City: | 55.3% |
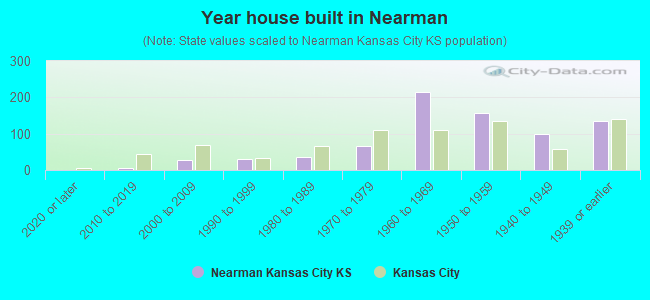
- Year house built in Nearman
- 02020 or later
- 62010 to 2019
- 282000 to 2009
- 311990 to 1999
- 351980 to 1989
- 661970 to 1979
- 2141960 to 1969
- 1581950 to 1959
- 991940 to 1949
- 1351939 or earlier
City-data.com crime index for city in 2015 (higher means more crime):
| City: | 553.9 |
| U.S. average: | 243.4 |
Travel time to work (commute)
![Travel time to work (commute)]()
- 10Less than 5 minutes
- 115 to 9 minutes
- 10510 to 14 minutes
- 20515 to 19 minutes
- 5220 to 24 minutes
- 8825 to 29 minutes
- 5930 to 34 minutes
- 3135 to 39 minutes
- 1340 to 44 minutes
- 3645 to 59 minutes
- 460 to 89 minutes
- 890 or more minutes

Means of transportation to work
![Means of transportation to work]()
- 77.9%516Drove a car alone
- 14.0%93Carpooled
- 6.6%44Taxi
- 1.8%12Walked
- 4.2%28Other means
- 9.8%65Worked at home

Time leaving home to go to work
![Time leaving home to go to work]()
- 2012:00 a.m. to 4:59 a.m.
- 105:00 a.m. to 5:29 a.m.
- 1195:30 a.m. to 5:59 a.m.
- 346:00 a.m. to 6:29 a.m.
- 336:30 a.m. to 6:59 a.m.
- 617:00 a.m. to 7:29 a.m.
- 1037:30 a.m. to 7:59 a.m.
- 598:00 a.m. to 8:29 a.m.
- 178:30 a.m. to 8:59 a.m.
- 159:00 a.m. to 9:59 a.m.
- 2810:00 a.m. to 10:59 a.m.
- 611:00 a.m. to 11:59 a.m.
- 2212:00 p.m. to 3:59 p.m.
- 654:00 p.m. to 11:59 p.m.

Occupations of males:
- Percentage of males in management occupations (except farmers):
Here: 5.9% city: 7.1%
- Percentage of males in computer and mathematical occupations:
Here: 1.9% city: 3.3%
- Percentage of males in architecture and engineering occupations:
Here: 1.1% city: 1.7%
- Percentage of males in community and social services occupations:
Here: 5.6% city: 1.3%
- Percentage of males in service occupations:
Here: 7.8% city: 14.6%
- Percentage of males in sales and office occupations:
Here: 20.0% city: 10.9%
- Percentage of males in construction, extraction, and maintenance occupations:
Here: 26.5% city: 15.4%
- Percentage of males in production occupations:
Here: 3.2% city: 11.9%
- Percentage of males in transportation occupations:
Here: 2.2% city: 6.8%
- Percentage of males in material moving occupations:
Here: 10.1% city: 12.2%
Occupations of females:
- Percentage of females in management occupations (except farmers):
Here: 8.5% city: 6.8%
- Percentage of females in business and financial operations occupations:
Here: 2.9% city: 5.3%
- Percentage of females in community and social services occupations:
Here: 3.6% city: 2.3%
- Percentage of females in education, training, and library occupations:
Here: 7.8% city: 7.0%
- Percentage of females in arts, design, entertainment, sports, and media occupations:
Here: 5.2% city: 1.4%
- Percentage of females in service occupations:
Here: 22.8% city: 22.4%
- Percentage of females in sales and office occupations:
Here: 27.3% city: 28.6%
- Percentage of females in production occupations:
Here: 15.9% city: 7.5%
- Percentage of females in transportation occupations:
Here: 6.5% city: 1.7%
- Percentage of females in material moving occupations:
Here: 3.8% city: 5.5%
Percentage of people 16-64 in Armed Forces:
| Nearman: | 0.1% |
| Kansas City: | 0.4% |
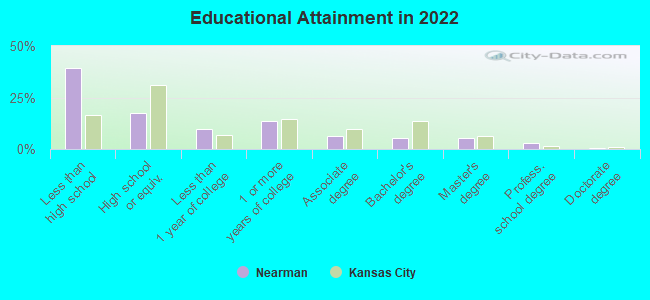
Education in this neighborhood (subdivision or community):
- Percentage of people 3 years and older in K-12 schools:
Nearman: 31.6% Kansas City: 20.0%
- Percentage of people 3 years and older in undergraduate colleges:
Nearman: 4.2% Kansas City: 3.8%
- Percentage of people 3 years and older in grad. or professional schools:
Nearman: 2.0% Kansas City: 2.1%
- Percentage of students K-12 enrolled in private schools:
Nearman: 11.5% Kansas City: 12.7%
Percentage of population below poverty level:
| Nearman: | 13.4% |
| Kansas City: | 14.3% |
Percentage of married-couple families with both working:
| Nearman: | 66.2% |
| Kansas City: | 69.9% |
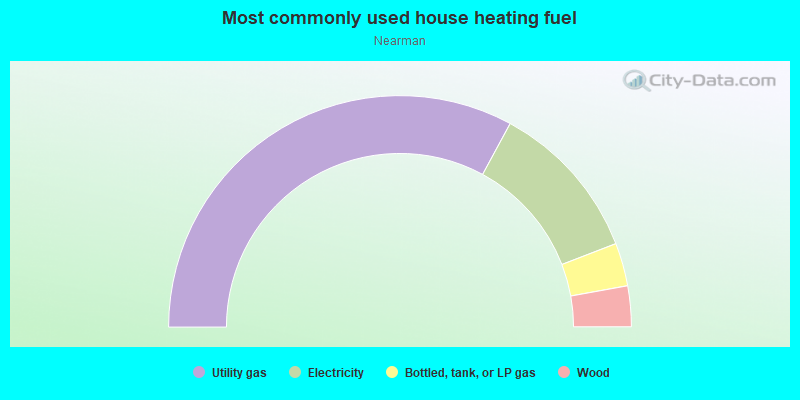
- 65.8%Utility gas
- 22.5%Electricity
- 6.0%Bottled, tank, or LP gas
- 5.7%Wood
Roads and streets:
N 47 St (N 47th St)
Length: 0.57 miles
Direction: N-S
Address range: 4300 to 4699
Direction: N-S
Address range: 4300 to 4699
Dickinson Rd
Length: 0.33 miles
Directions: E-W, SE-NW
Address range: 4700 to 4838
Directions: E-W, SE-NW
Address range: 4700 to 4838
N 42 St (N 42nd St)
Length: 0.29 miles
Direction: N-S
Address range: 4488 to 4699
Direction: N-S
Address range: 4488 to 4699
55th St (N 55 St)
Length: 0.18 miles
Direction: N-S
Direction: N-S
Railroad features:
Union Pacific RR
Length: 5.23 miles
Directions: E-W, N-S, SE-NW, SW-NE
Directions: E-W, N-S, SE-NW, SW-NE
Missouri Pacific RR
Length: 1.58 miles
Direction: E-W
Direction: E-W