New Addition neighborhood in East Chicago, Indiana (IN), 46312 detailed profile
Settings
X


Business Search - 14 Million verified businesses
Area: 0.097 square miles
Population: 280
Population density:
| New Addition: | 2,889 people per square mile |
| East Chicago: | 2,201 people per square mile |

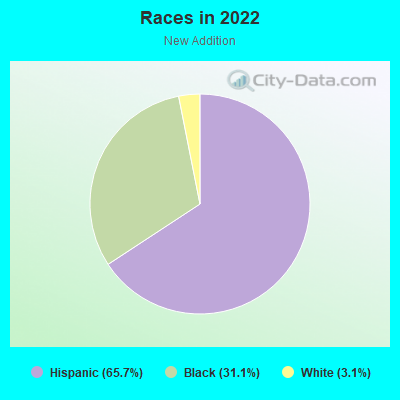
- 19065.7%Hispanic or Latino
- 9031.1%Black
- 93.1%White
Median household income in 2022:
| New Addition: | $43,750 |
| East Chicago: | $39,434 |
Distribution of median household income
![Distribution of median household income]()
- 30Less than $10,000
- 10$10,000 to $19,999
- 26$20,000 to $29,999
- 8$30,000 to $39,999
- 3$40,000 to $49,999
- 56$50,000 to $59,999
- 10$60,000 to $74,999
- 2$75,000 to $99,999
- 2$100,000 to $124,999

Distribution of owner-occupied house/condo value
![Distribution of owner-occupied house/condo value]()
- 8Less than $50,000
- 15$50,000 to $99,999
- 7$150,000 to $199,999

Distribution of rent paid by renters
![Distribution of rent paid by renters]()
- 61$300 to $399
- 12$400 to $499
- 4$600 to $699
- 23$700 to $799
- 6$800 to $899

Median rent in 2022:
| New Addition: | $389 |
| East Chicago: | $588 |
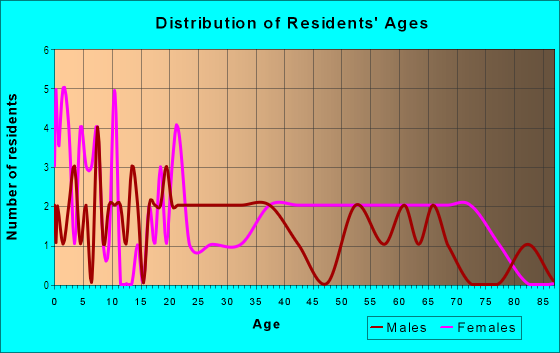
| Males: | 112 |
| Females: | 168 |
Males:
| This neighborhood: | 36.6 years |
| Whole city: | 35.2 years |
| This neighborhood: | 36.5 years |
| Whole city: | 36.5 years |
Average household size:
| New Addition: | 2.1 people |
| East Chicago: | 2.6 people |
Percentage of family households:
| New Addition: | 7.0% |
| East Chicago: | 42.5% |
| Here: | 4.2% |
| East Chicago: | 24.8% |
Percentage of married-couple families with children (among all households):
| New Addition: | 0.0% |
| East Chicago: | 12.8% |
Percentage of single-mother households (among all households):
| New Addition: | 47.4% |
| East Chicago: | 21.4% |
Percentage of never married males 15 years old and over:
Percentage of never married females 15 years old and over:
| New Addition: | 37.1% |
| East Chicago: | 25.8% |
Percentage of never married females 15 years old and over:
| New Addition: | 9.6% |
| city: | 23.9% |
Percentage of people that speak English not well or not at all:
| New Addition: | 0.0% |
| East Chicago: | 6.5% |
Percentage of people born in this state:
Percentage of people born in another U.S. state:
Percentage of native residents but born outside the U.S.:
Percentage of foreign born residents:
| Here: | 43.1% |
| East Chicago: | 50.8% |
Percentage of people born in another U.S. state:
| New Addition: | 22.3% |
| East Chicago: | 30.6% |
Percentage of native residents but born outside the U.S.:
| Here: | 0.8% |
| city: | 3.3% |
Percentage of foreign born residents:
| Here: | 33.8% |
| East Chicago: | 15.4% |
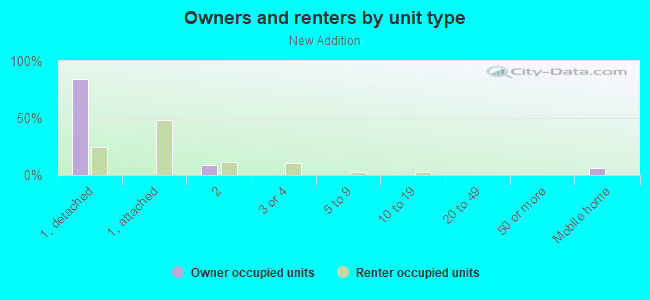
Owner-occupied
Renter-occupied

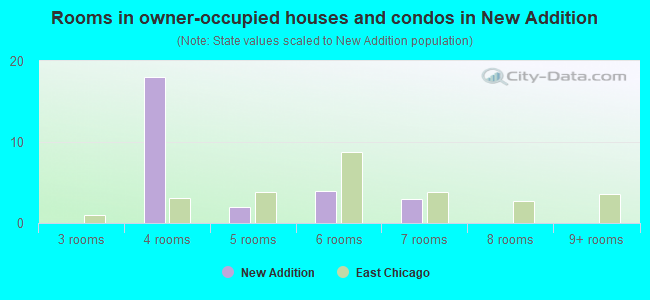
- Rooms in owner-occupied houses and condos in New Addition
- 01 room
- 02 rooms
- 03 rooms
- 184 rooms
- 25 rooms
- 46 rooms
- 37 rooms
- 08 rooms
- 09+ rooms
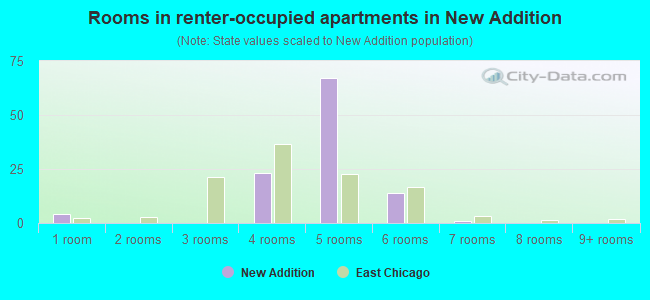
- Rooms in renter-occupied apartments in New Addition
- 41 room
- 02 rooms
- 03 rooms
- 234 rooms
- 675 rooms
- 146 rooms
- 17 rooms
- 08 rooms
- 09+ rooms
Owner-occupied
Renter-occupied
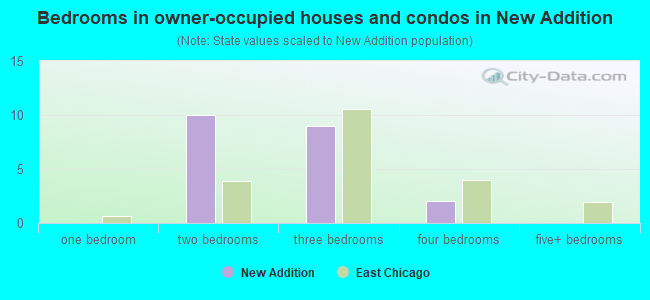
- Bedrooms in owner-occupied houses and condos in New Addition
- 0no bedroom
- 01 bedroom
- 102 bedrooms
- 93 bedrooms
- 24 bedrooms
- 05+ bedrooms
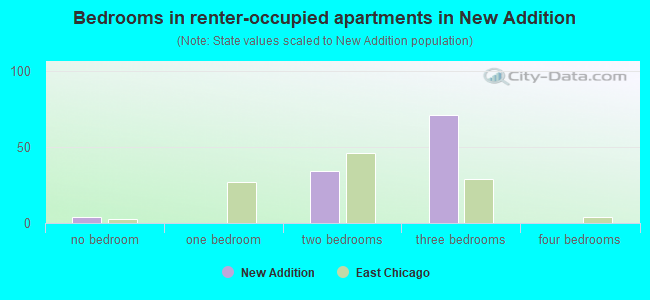
- Bedrooms in renter-occupied apartments in New Addition
- 4no bedroom
- 01 bedroom
- 342 bedrooms
- 713 bedrooms
- 04 bedrooms
- 05+ bedrooms
Average number of cars or other vehicles available in houses/condos:
Average number of cars or other vehicles available in apartments:
| This neighborhood: | 0.8 |
| East Chicago: | 1.9 |
Average number of cars or other vehicles available in apartments:
| Here: | 0.8 |
| city: | 1.0 |
Percentage of units with a mortgage:
| New Addition: | 69.0% |
| East Chicago: | 42.7% |
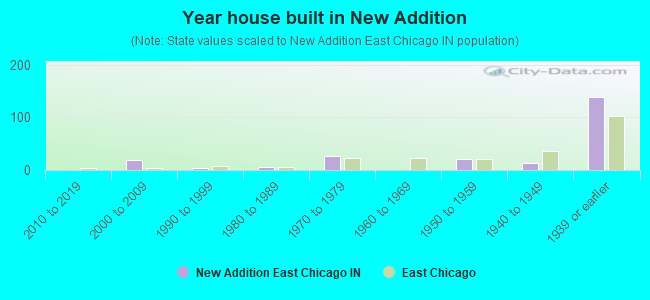
- Year house built in New Addition
- 02020 or later
- 02010 to 2019
- 192000 to 2009
- 31990 to 1999
- 51980 to 1989
- 261970 to 1979
- 01960 to 1969
- 211950 to 1959
- 131940 to 1949
- 1381939 or earlier
City-data.com crime index for city in 2020 (higher means more crime):
| City: | 171.2 |
| U.S. average: | 219.5 |
Travel time to work (commute)
![Travel time to work (commute)]()
- 15 to 9 minutes
- 1010 to 14 minutes
- 115 to 19 minutes
- 320 to 24 minutes
- 3130 to 34 minutes
- 140 to 44 minutes
- 190 or more minutes

Means of transportation to work
![Means of transportation to work]()
- 15.5%31Drove a car alone
- 55.1%110Carpooled
- 0.5%1Walked
- 28.6%57Worked at home

Time leaving home to go to work
![Time leaving home to go to work]()
- 112:00 a.m. to 4:59 a.m.
- 16:00 a.m. to 6:29 a.m.
- 27:00 a.m. to 7:29 a.m.
- 57:30 a.m. to 7:59 a.m.
- 299:00 a.m. to 9:59 a.m.
- 312:00 p.m. to 3:59 p.m.
- 64:00 p.m. to 11:59 p.m.

Occupations of males:
- Percentage of males in service occupations:
Here: 8.3% city: 17.0%
- Percentage of males in sales and office occupations:
Here: 100.0% city: 14.9%
- Percentage of males in material moving occupations:
Here: 2.8% city: 17.1%
Occupations of females:
- Percentage of females in education, training, and library occupations:
Here: 2.0% city: 6.3%
- Percentage of females in arts, design, entertainment, sports, and media occupations:
Here: 6.4% city: 0.3%
- Percentage of females in service occupations:
Here: 78.1% city: 32.1%
- Percentage of females in sales and office occupations:
Here: 14.0% city: 26.3%
- Percentage of females in material moving occupations:
Here: 1.5% city: 2.6%
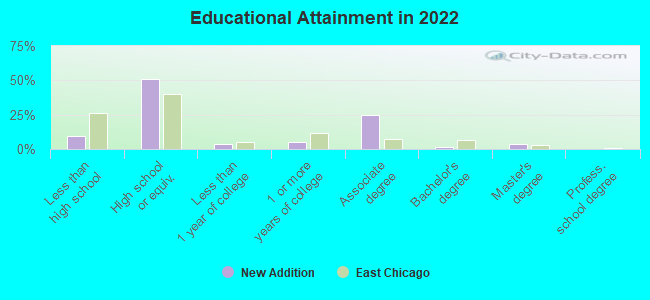
Education in this neighborhood (subdivision or community):
- Percentage of people 3 years and older in K-12 schools:
New Addition: 9.3% East Chicago: 19.5%
- Percentage of people 3 years and older in undergraduate colleges:
New Addition: 0.0% East Chicago: 4.7%
- Percentage of people 3 years and older in grad. or professional schools:
New Addition: 0.0% East Chicago: 0.4%
- Percentage of students K-12 enrolled in private schools:
New Addition: 0.0% East Chicago: 9.0%
Percentage of population below poverty level:
| New Addition: | 43.3% |
| East Chicago: | 27.0% |
Median year owner moved in (as recorded in 2022):
Median year renter moved in (as recorded in 2022):
| New Addition: | 2003 |
| East Chicago: | 2003 |
Median year renter moved in (as recorded in 2022):
| New Addition: | 2013 |
| East Chicago: | 2016 |
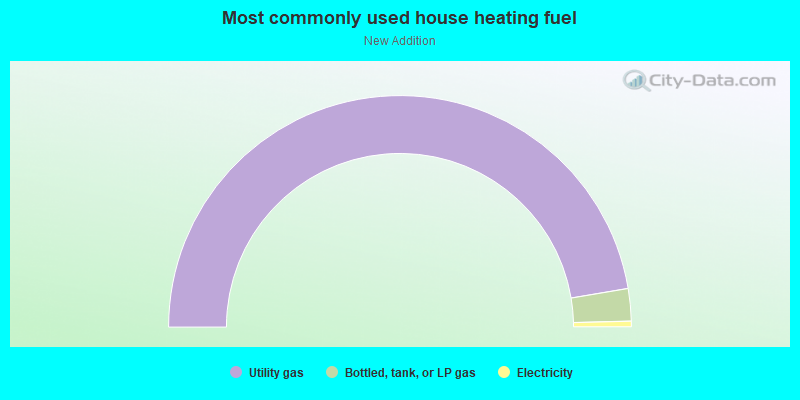
- 94.7%Utility gas
- 4.5%Bottled, tank, or LP gas
- 0.8%Electricity
Roads and streets:
Cesar Chavez Memorial Dr (E Columbus Dr)
Length: 0.42 miles
Direction: E-W
Address range: 400 to 899
Direction: E-W
Address range: 400 to 899
Canalport Ave
Length: 0.37 miles
Directions: N-S, SE-NW, SW-NE
Address range: 3800 to 4099
Directions: N-S, SE-NW, SW-NE
Address range: 3800 to 4099
Melville Ave
Length: 0.32 miles
Directions: E-W, N-S, SE-NW, SW-NE
Address range: 3800 to 4198
Directions: E-W, N-S, SE-NW, SW-NE
Address range: 3800 to 4198
E 140th St
Length: 0.29 miles
Direction: E-W
Address range: 600 to 899
Direction: E-W
Address range: 600 to 899
Alexander Ave
Length: 0.27 miles
Direction: N-S
Address range: 3800 to 4446
Direction: N-S
Address range: 3800 to 4446
E 139th St
Length: 0.27 miles
Directions: E-W, SE-NW
Address range: 600 to 899
Directions: E-W, SE-NW
Address range: 600 to 899
Mc Cook Ave
Length: 0.24 miles
Directions: E-W, N-S
Address range: 3800 to 4099
Directions: E-W, N-S
Address range: 3800 to 4099
Kennedy Ave (Michigan Ave)
Length: 0.22 miles
Directions: N-S, SW-NE
Address range: 3800 to 4099
Directions: N-S, SW-NE
Address range: 3800 to 4099
Garfield Pl
Length: 0.14 miles
Direction: SE-NW
Address range: 3800 to 3899
Direction: SE-NW
Address range: 3800 to 3899
Access Road Columbus Dr
Length: 0.05 miles
Directions: E-W, SE-NW
Directions: E-W, SE-NW