Norma Triangle neighborhood in West Hollywood, California (CA), 90069 detailed profile
Settings
X


Business Search - 14 Million verified businesses
Area: 0.092 square miles
Population: 568
Population density:
| Norma Triangle: | 6,150 people per square mile |
| West Hollywood: | 18,802 people per square mile |

- 38663.1%White
- 9215.0%Asian
- 589.5%Two or more races
- 559.0%Hispanic or Latino
- 203.3%Black
- 10.2%Some other race

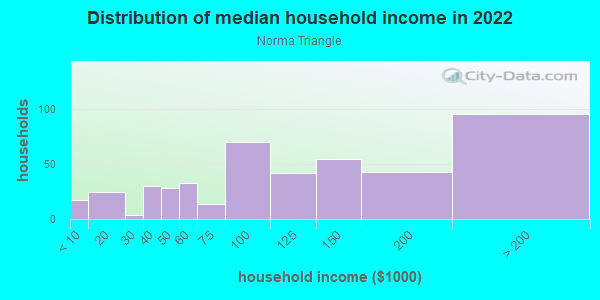
Median household income in 2022:
| Norma Triangle: | $154,289 |
| West Hollywood: | $89,034 |
Distribution of median household income
![Distribution of median household income]()
- 17Less than $10,000
- 25$10,000 to $19,999
- 4$20,000 to $29,999
- 30$30,000 to $39,999
- 28$40,000 to $49,999
- 33$50,000 to $59,999
- 14$60,000 to $74,999
- 70$75,000 to $99,999
- 42$100,000 to $124,999
- 55$125,000 to $149,999
- 43$150,000 to $199,999
- 96$200,000 or more
Distribution of owner-occupied house/condo value
![Distribution of owner-occupied house/condo value]()
- 25Less than $50,000
- 1$50,000 to $99,999
- 12$400,000 to $499,999
- 29$500,000 to $749,999
- 25$750,000 to $999,999
- 168$1,000,000 or more

Distribution of rent paid by renters
![Distribution of rent paid by renters]()
- 8$100 to $199
- 16$200 to $299
- 16$300 to $399
- 11$600 to $699
- 2$700 to $799
- 8$800 to $899
- 10$900 to $999
- 33$1,000 to $1,249
- 26$1,250 to $1,499
- 49$1,500 to $1,999
- 154$2,000 or more

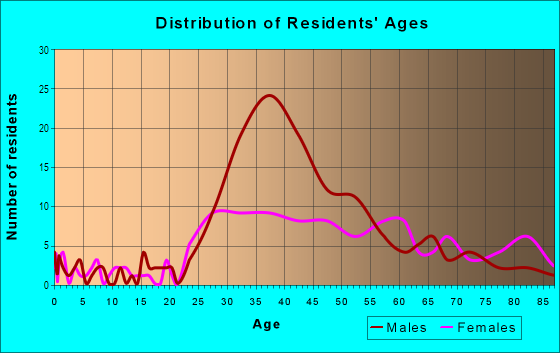
| Males: | 322 |
| Females: | 245 |
Males:
| This neighborhood: | 51.8 years |
| Whole city: | 43.5 years |
| This neighborhood: | 49.6 years |
| Whole city: | 36.4 years |
Average household size:
| Norma Triangle: | 1.9 people |
| West Hollywood: | 1.5 people |
Percentage of family households:
| Norma Triangle: | 26.6% |
| West Hollywood: | 14.5% |
| Here: | 24.0% |
| West Hollywood: | 15.1% |
Percentage of married-couple families with children (among all households):
| Norma Triangle: | 59.3% |
| West Hollywood: | 45.7% |
Percentage of single-mother households (among all households):
| Norma Triangle: | 8.6% |
| West Hollywood: | 16.3% |
Percentage of never married males 15 years old and over:
Percentage of never married females 15 years old and over:
| Norma Triangle: | 35.8% |
| West Hollywood: | 39.9% |
Percentage of never married females 15 years old and over:
| Norma Triangle: | 22.8% |
| city: | 23.7% |
Percentage of people that speak English not well or not at all:
| Norma Triangle: | 0.0% |
| West Hollywood: | 4.2% |
Percentage of people born in this state:
Percentage of people born in another U.S. state:
Percentage of native residents but born outside the U.S.:
Percentage of foreign born residents:
| Here: | 27.5% |
| West Hollywood: | 30.6% |
Percentage of people born in another U.S. state:
| Norma Triangle: | 42.6% |
| West Hollywood: | 44.7% |
Percentage of native residents but born outside the U.S.:
| Here: | 0.8% |
| city: | 0.9% |
Percentage of foreign born residents:
| Here: | 29.1% |
| West Hollywood: | 23.7% |

Owner-occupied
Renter-occupied


- Rooms in owner-occupied houses and condos in Norma Triangle
- 01 room
- 22 rooms
- 433 rooms
- 244 rooms
- 185 rooms
- 376 rooms
- 217 rooms
- 118 rooms
- 209+ rooms

- Rooms in renter-occupied apartments in Norma Triangle
- 401 room
- 302 rooms
- 1213 rooms
- 544 rooms
- 295 rooms
- 146 rooms
- 77 rooms
- 38 rooms
- 89+ rooms
Owner-occupied
Renter-occupied

- Bedrooms in owner-occupied houses and condos in Norma Triangle
- 0no bedroom
- 161 bedroom
- 812 bedrooms
- 223 bedrooms
- 324 bedrooms
- 345+ bedrooms

- Bedrooms in renter-occupied apartments in Norma Triangle
- 63no bedroom
- 1401 bedroom
- 802 bedrooms
- 373 bedrooms
- 74 bedrooms
- 25+ bedrooms
Average number of cars or other vehicles available in houses/condos:
Average number of cars or other vehicles available in apartments:
| This neighborhood: | 1.9 |
| West Hollywood: | 1.4 |
Average number of cars or other vehicles available in apartments:
| Here: | |
| city: |
Percentage of units with a mortgage:
| Norma Triangle: | 65.7% |
| West Hollywood: | 73.8% |
Average estimated value of detached houses in 2022 (35.7% of all units):
| Norma Triangle: | $5,523,175 |
| California: | $988,808 |

- Year house built in Norma Triangle
- 02020 or later
- 202010 to 2019
- 192000 to 2009
- 291990 to 1999
- 601980 to 1989
- 801970 to 1979
- 881960 to 1969
- 751950 to 1959
- 321940 to 1949
- 1721939 or earlier

City-data.com crime index for city in 2020 (higher means more crime):
| City: | 346.7 |
| U.S. average: | 219.5 |
Travel time to work (commute)
![Travel time to work (commute)]()
- 4Less than 5 minutes
- 225 to 9 minutes
- 2810 to 14 minutes
- 6315 to 19 minutes
- 5720 to 24 minutes
- 1525 to 29 minutes
- 5230 to 34 minutes
- 1235 to 39 minutes
- 1040 to 44 minutes
- 3045 to 59 minutes
- 1760 to 89 minutes
- 490 or more minutes

Means of transportation to work
![Means of transportation to work]()
- 55.0%201Drove a car alone
- 6.3%23Carpooled
- 4.4%16Bus
- 1.4%5Bicycle
- 6.0%22Walked
- 5.8%21Other means
- 29.0%106Worked at home

Time leaving home to go to work
![Time leaving home to go to work]()
- 1112:00 a.m. to 4:59 a.m.
- 45:00 a.m. to 5:29 a.m.
- 25:30 a.m. to 5:59 a.m.
- 66:00 a.m. to 6:29 a.m.
- 96:30 a.m. to 6:59 a.m.
- 207:00 a.m. to 7:29 a.m.
- 307:30 a.m. to 7:59 a.m.
- 678:00 a.m. to 8:29 a.m.
- 378:30 a.m. to 8:59 a.m.
- 759:00 a.m. to 9:59 a.m.
- 2310:00 a.m. to 10:59 a.m.
- 2112:00 p.m. to 3:59 p.m.
- 84:00 p.m. to 11:59 p.m.

Occupations of males:
- Percentage of males in management occupations (except farmers):
Here: 35.9% city: 16.2%
- Percentage of males in business and financial operations occupations:
Here: 10.4% city: 6.9%
- Percentage of males in computer and mathematical occupations:
Here: 2.1% city: 5.8%
- Percentage of males in architecture and engineering occupations:
Here: 1.4% city: 2.7%
- Percentage of males in life, physical, and social science occupations:
Here: 3.3% city: 1.2%
- Percentage of males in legal occupations:
Here: 5.5% city: 2.9%
- Percentage of males in education, training, and library occupations:
Here: 6.4% city: 3.6%
- Percentage of males in arts, design, entertainment, sports, and media occupations:
Here: 9.8% city: 15.6%
- Percentage of males in healthcare practitioners and technical occupations:
Here: 1.6% city: 6.0%
- Percentage of males in service occupations:
Here: 3.4% city: 8.4%
- Percentage of males in sales and office occupations:
Here: 13.6% city: 21.6%
- Percentage of males in transportation occupations:
Here: 1.2% city: 2.8%
Occupations of females:
- Percentage of females in management occupations (except farmers):
Here: 18.3% city: 13.7%
- Percentage of females in business and financial operations occupations:
Here: 5.3% city: 11.6%
- Percentage of females in computer and mathematical occupations:
Here: 1.4% city: 3.5%
- Percentage of females in architecture and engineering occupations:
Here: 1.5% city: 0.2%
- Percentage of females in life, physical, and social science occupations:
Here: 10.2% city: 1.5%
- Percentage of females in legal occupations:
Here: 5.7% city: 4.0%
- Percentage of females in education, training, and library occupations:
Here: 4.1% city: 4.3%
- Percentage of females in arts, design, entertainment, sports, and media occupations:
Here: 20.0% city: 13.9%
- Percentage of females in healthcare practitioners and technical occupations:
Here: 13.4% city: 9.1%
- Percentage of females in service occupations:
Here: 3.6% city: 13.3%
- Percentage of females in sales and office occupations:
Here: 14.4% city: 21.1%
- Percentage of females in production occupations:
Here: 3.6% city: 1.9%
Education in this neighborhood (subdivision or community):
- Percentage of people 3 years and older in K-12 schools:
Norma Triangle: 9.4% West Hollywood: 1.9%
- Percentage of people 3 years and older in undergraduate colleges:
Norma Triangle: 4.2% West Hollywood: 4.1%
- Percentage of people 3 years and older in grad. or professional schools:
Norma Triangle: 4.9% West Hollywood: 1.8%
- Percentage of students K-12 enrolled in private schools:
Norma Triangle: 55.8% West Hollywood: 3.6%
Percentage of population below poverty level:
| Norma Triangle: | 12.1% |
| West Hollywood: | 12.7% |
Median year owner moved in (as recorded in 2022):
| Norma Triangle: | 2005 |
| West Hollywood: | 2012 |
Percentage of married-couple families with both working:
| Norma Triangle: | 98.5% |
| West Hollywood: | 72.3% |

- 59.3%Utility gas
- 35.1%Electricity
- 3.7%No fuel used
- 1.8%Bottled, tank, or LP gas
Highways in this neighborhood:
Santa Monica Blvd (State Rte 2)
Length: 0.56 miles
Directions: SE-NW, SW-NE
Address range: 8900 to 8966
Directions: SE-NW, SW-NE
Address range: 8900 to 8966
Roads and streets:
Norma Pl
Length: 0.29 miles
Directions: E-W, SW-NE
Address range: 8900 to 9099
Directions: E-W, SW-NE
Address range: 8900 to 9099
Keith Ave
Length: 0.24 miles
Directions: E-W, SW-NE
Address range: 8900 to 9022
Directions: E-W, SW-NE
Address range: 8900 to 9022
Hilldale Ave
Length: 0.21 miles
Directions: N-S, SE-NW
Address range: 800 to 899
Directions: N-S, SE-NW
Address range: 800 to 899
N San Vicente Blvd
Length: 0.19 miles
Directions: N-S, SE-NW
Address range: 800 to 899
Directions: N-S, SE-NW
Address range: 800 to 899
Lloyd Pl
Length: 0.16 miles
Direction: SW-NE
Address range: 8900 to 9022
Direction: SW-NE
Address range: 8900 to 9022
Cinthia St (Cynthia St)
Length: 0.14 miles
Direction: E-W
Address range: 8945 to 9031
Direction: E-W
Address range: 8945 to 9031
Dicks St
Length: 0.11 miles
Direction: E-W
Address range: 8900 to 8999
Direction: E-W
Address range: 8900 to 8999
Willey Ln
Length: 0.10 miles
Direction: N-S
Address range: 700 to 799
Direction: N-S
Address range: 700 to 799
Nemo St
Length: 0.08 miles
Direction: E-W
Address range: 9000 to 9075
Direction: E-W
Address range: 9000 to 9075
Hammond St
Length: 0.08 miles
Direction: N-S
Address range: 800 to 899
Direction: N-S
Address range: 800 to 899
Vista Grande St
Length: 0.08 miles
Direction: E-W
Address range: 8900 to 8999
Direction: E-W
Address range: 8900 to 8999
N Robertson Blvd
Length: 0.07 miles
Direction: SE-NW
Address range: 700 to 899
Direction: SE-NW
Address range: 700 to 899
Ramage St
Length: 0.07 miles
Direction: SE-NW
Address range: 700 to 799
Direction: SE-NW
Address range: 700 to 799