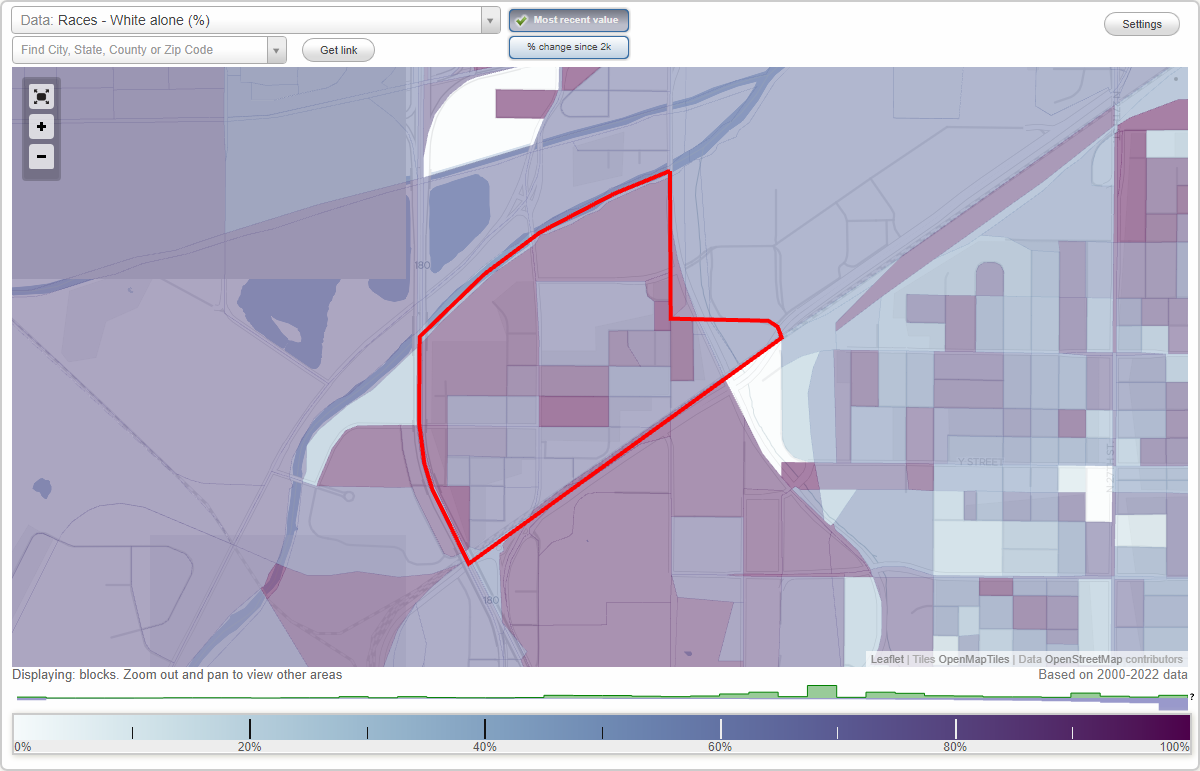
North Bottoms neighborhood in Lincoln, Nebraska (NE), 68508 detailed profile
Settings
X

Business Search - 14 Million verified businesses
Area: 0.355 square miles
Population: 380
Population density:
| North Bottoms: | 1,070 people per square mile |
| Lincoln: | 3,920 people per square mile |

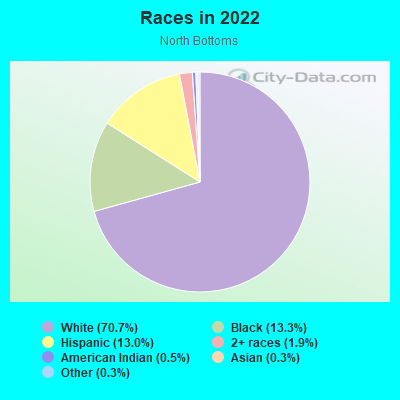
- 26670.7%White
- 5013.3%Black
- 4913.0%Hispanic or Latino
- 71.9%Two or more races
- 20.5%American Indian
- 10.3%Asian
- 10.3%Some other race
Distribution of median household income
![Distribution of median household income]()
- 22Less than $10,000
- 33$10,000 to $19,999
- 20$20,000 to $29,999
- 29$30,000 to $39,999
- 5$40,000 to $49,999
- 25$50,000 to $59,999
- 3$60,000 to $74,999
- 32$75,000 to $99,999
- 3$100,000 to $124,999
- 4$125,000 to $149,999
- 14$150,000 to $199,999
- 3$200,000 or more

Distribution of owner-occupied house/condo value
![Distribution of owner-occupied house/condo value]()
- 23Less than $50,000
- 22$50,000 to $99,999
- 18$100,000 to $149,999
- 39$150,000 to $199,999
- 18$200,000 to $249,999
- 3$250,000 to $299,999
- 9$500,000 to $749,999

Distribution of rent paid by renters
![Distribution of rent paid by renters]()
- 3$100 to $199
- 4$200 to $299
- 8$300 to $399
- 19$400 to $499
- 12$500 to $599
- 37$600 to $699
- 32$700 to $799
- 15$800 to $899
- 10$900 to $999
- 5$1,000 to $1,249
- 8$1,250 to $1,499
- 13$1,500 to $1,999
- 52$2,000 or more

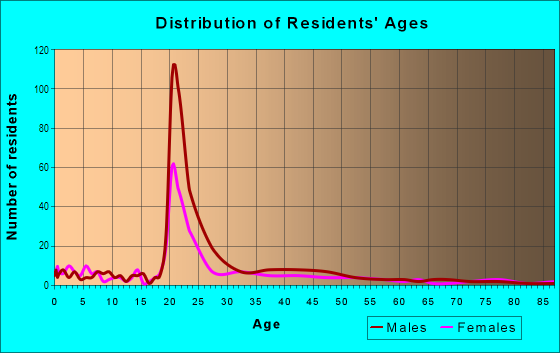
| Males: | 209 |
| Females: | 170 |
Males:
| This neighborhood: | 27.5 years |
| Whole city: | 33.1 years |
| This neighborhood: | 26.0 years |
| Whole city: | 34.8 years |
Percentage of family households:
| North Bottoms: | 28.1% |
| Lincoln: | 40.9% |
| Here: | 9.1% |
| Lincoln: | 41.1% |
Percentage of married-couple families with children (among all households):
| North Bottoms: | 11.7% |
| Lincoln: | 30.9% |
Percentage of single-mother households (among all households):
| North Bottoms: | 26.3% |
| Lincoln: | 7.2% |
Percentage of never married males 15 years old and over:
Percentage of never married females 15 years old and over:
| North Bottoms: | 40.1% |
| Lincoln: | 22.0% |
Percentage of never married females 15 years old and over:
| North Bottoms: | 27.8% |
| city: | 19.2% |
Percentage of people that speak English not well or not at all:
| North Bottoms: | 2.2% |
| Lincoln: | 2.3% |
Percentage of people born in this state:
Percentage of people born in another U.S. state:
Percentage of native residents but born outside the U.S.:
Percentage of foreign born residents:
| Here: | 59.4% |
| Lincoln: | 63.9% |
Percentage of people born in another U.S. state:
| North Bottoms: | 32.2% |
| Lincoln: | 27.1% |
Percentage of native residents but born outside the U.S.:
| Here: | 2.2% |
| city: | 0.9% |
Percentage of foreign born residents:
| Here: | 6.2% |
| Lincoln: | 8.0% |
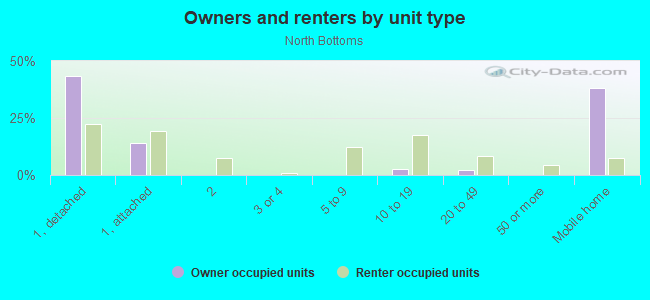
Owner-occupied
Renter-occupied

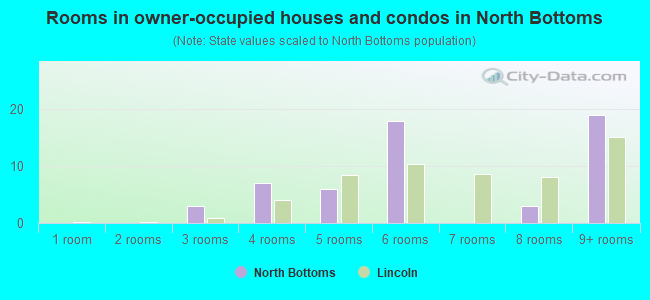
- Rooms in owner-occupied houses and condos in North Bottoms
- 01 room
- 02 rooms
- 33 rooms
- 74 rooms
- 65 rooms
- 186 rooms
- 07 rooms
- 38 rooms
- 199+ rooms
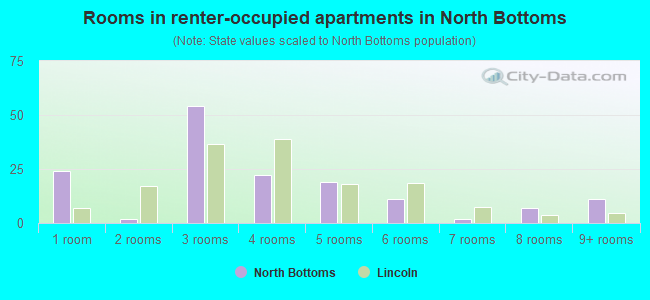
- Rooms in renter-occupied apartments in North Bottoms
- 241 room
- 22 rooms
- 543 rooms
- 224 rooms
- 195 rooms
- 116 rooms
- 27 rooms
- 78 rooms
- 119+ rooms
Owner-occupied
Renter-occupied
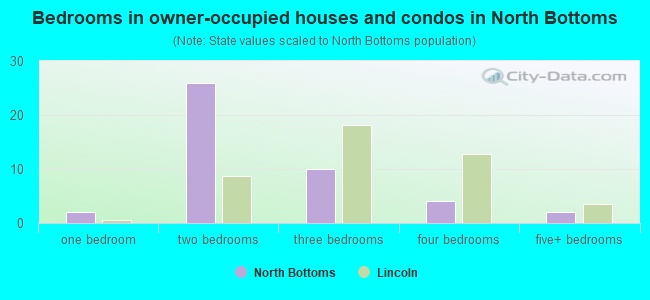
- Bedrooms in owner-occupied houses and condos in North Bottoms
- 0no bedroom
- 21 bedroom
- 262 bedrooms
- 103 bedrooms
- 44 bedrooms
- 25+ bedrooms
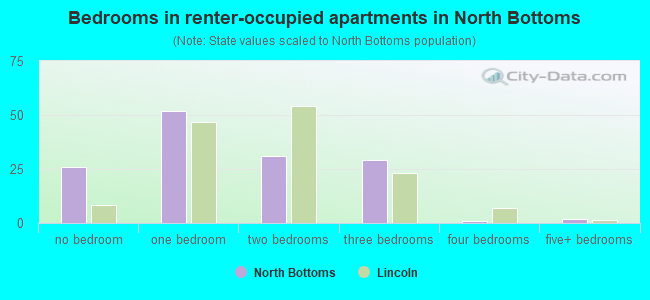
- Bedrooms in renter-occupied apartments in North Bottoms
- 26no bedroom
- 521 bedroom
- 312 bedrooms
- 293 bedrooms
- 14 bedrooms
- 25+ bedrooms
Average number of cars or other vehicles available in houses/condos:
Average number of cars or other vehicles available in apartments:
| This neighborhood: | |
| Lincoln: |
Average number of cars or other vehicles available in apartments:
| Here: | |
| city: |
Percentage of units with a mortgage:
| North Bottoms: | 37.9% |
| Lincoln: | 64.4% |
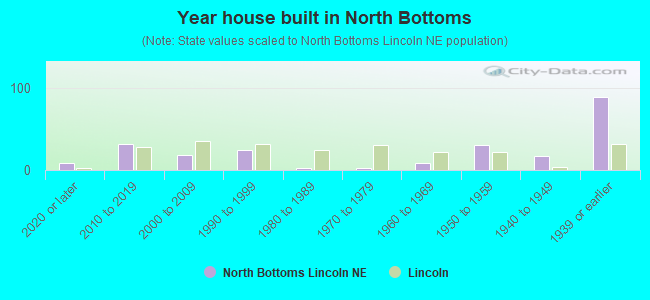
- Year house built in North Bottoms
- 82020 or later
- 322010 to 2019
- 182000 to 2009
- 241990 to 1999
- 21980 to 1989
- 21970 to 1979
- 91960 to 1969
- 311950 to 1959
- 171940 to 1949
- 891939 or earlier
City-data.com crime index for city in 2020 (higher means more crime):
| City: | 221.6 |
| U.S. average: | 219.5 |
Travel time to work (commute)
![Travel time to work (commute)]()
- 10Less than 5 minutes
- 985 to 9 minutes
- 12610 to 14 minutes
- 18215 to 19 minutes
- 12620 to 24 minutes
- 3625 to 29 minutes
- 930 to 34 minutes
- 235 to 39 minutes
- 340 to 44 minutes
- 2045 to 59 minutes
- 1160 to 89 minutes

Means of transportation to work
![Means of transportation to work]()
- 52.2%119Drove a car alone
- 15.4%35Carpooled
- 1.3%3Bus
- 1.8%4Taxi
- 5.7%13Bicycle
- 9.7%22Walked
- 3.1%7Other means
- 11.4%26Worked at home

Time leaving home to go to work
![Time leaving home to go to work]()
- 612:00 a.m. to 4:59 a.m.
- 65:00 a.m. to 5:29 a.m.
- 415:30 a.m. to 5:59 a.m.
- 266:00 a.m. to 6:29 a.m.
- 396:30 a.m. to 6:59 a.m.
- 787:00 a.m. to 7:29 a.m.
- 997:30 a.m. to 7:59 a.m.
- 648:00 a.m. to 8:29 a.m.
- 188:30 a.m. to 8:59 a.m.
- 299:00 a.m. to 9:59 a.m.
- 510:00 a.m. to 10:59 a.m.
- 2011:00 a.m. to 11:59 a.m.
- 10912:00 p.m. to 3:59 p.m.
- 704:00 p.m. to 11:59 p.m.

Occupations of males:
- Percentage of males in management occupations (except farmers):
Here: 5.4% city: 11.6%
- Percentage of males in business and financial operations occupations:
Here: 9.6% city: 5.5%
- Percentage of males in computer and mathematical occupations:
Here: 4.6% city: 5.3%
- Percentage of males in architecture and engineering occupations:
Here: 2.6% city: 2.9%
- Percentage of males in community and social services occupations:
Here: 2.9% city: 1.4%
- Percentage of males in education, training, and library occupations:
Here: 2.9% city: 5.5%
- Percentage of males in arts, design, entertainment, sports, and media occupations:
Here: 3.3% city: 2.3%
- Percentage of males in healthcare practitioners and technical occupations:
Here: 3.8% city: 2.5%
- Percentage of males in service occupations:
Here: 32.1% city: 13.0%
- Percentage of males in sales and office occupations:
Here: 3.3% city: 15.8%
- Percentage of males in farming, fishing, and forestry occupations:
Here: 1.0% city: 0.6%
- Percentage of males in construction, extraction, and maintenance occupations:
Here: 9.2% city: 8.6%
- Percentage of males in production occupations:
Here: 13.8% city: 8.3%
- Percentage of males in transportation occupations:
Here: 5.1% city: 4.7%
- Percentage of males in material moving occupations:
Here: 1.4% city: 4.8%
Occupations of females:
- Percentage of females in business and financial operations occupations:
Here: 13.6% city: 7.5%
- Percentage of females in education, training, and library occupations:
Here: 5.1% city: 10.7%
- Percentage of females in arts, design, entertainment, sports, and media occupations:
Here: 3.7% city: 2.3%
- Percentage of females in service occupations:
Here: 38.9% city: 21.9%
- Percentage of females in sales and office occupations:
Here: 38.1% city: 26.6%
Percentage of people 16-64 in Armed Forces:
| North Bottoms: | 1.5% |
| Lincoln: | 0.3% |
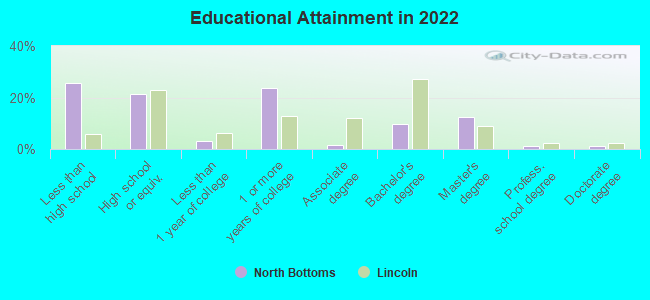
Education in this neighborhood (subdivision or community):
- Percentage of people 3 years and older in K-12 schools:
North Bottoms: 14.0% Lincoln: 16.3%
- Percentage of people 3 years and older in undergraduate colleges:
North Bottoms: 18.8% Lincoln: 10.7%
- Percentage of people 3 years and older in grad. or professional schools:
North Bottoms: 2.4% Lincoln: 2.3%
- Percentage of students K-12 enrolled in private schools:
North Bottoms: 13.5% Lincoln: 13.7%
Percentage of population below poverty level:
| North Bottoms: | 40.0% |
| Lincoln: | 14.0% |
Percentage of married-couple families with both working:
| North Bottoms: | 370.3% |
| Lincoln: | 80.4% |
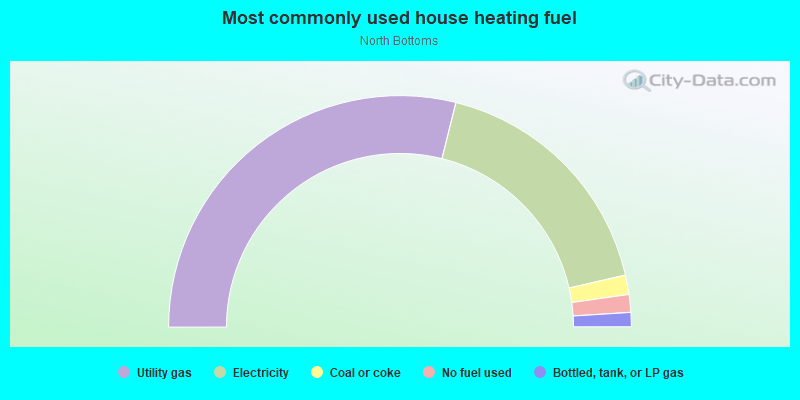
- 57.8%Utility gas
- 35.0%Electricity
- 2.7%Coal or coke
- 2.5%No fuel used
- 2.0%Bottled, tank, or LP gas
Limited-access highways (interstate or state) in this neighborhood:
I- 180 (US Hwy 34)
Length: 0.38 miles
Directions: N-S, SE-NW
Directions: N-S, SE-NW
Roads and streets:
New Hampshire St
Length: 0.70 miles
Direction: E-W
Address range: 600 to 1399
Direction: E-W
Address range: 600 to 1399
N 10th St
Length: 0.63 miles
Directions: N-S, SW-NE
Address range: 700 to 1899
Directions: N-S, SW-NE
Address range: 700 to 1899
Charleston St
Length: 0.58 miles
Direction: E-W
Address range: 618 to 1299
Direction: E-W
Address range: 618 to 1299
Claremont St
Length: 0.55 miles
Direction: E-W
Address range: 900 to 1499
Direction: E-W
Address range: 900 to 1499
N 14th St
Length: 0.53 miles
Direction: N-S
Address range: 1220 to 2150
Direction: N-S
Address range: 1220 to 2150
Military Rd
Length: 0.40 miles
Direction: E-W
Address range: 1000 to 1399
Direction: E-W
Address range: 1000 to 1399
Y St
Length: 0.40 miles
Direction: E-W
Address range: 700 to 1199
Direction: E-W
Address range: 700 to 1199
N 9th St
Length: 0.39 miles
Direction: N-S
Address range: 900 to 1499
Direction: N-S
Address range: 900 to 1499
N 12th St
Length: 0.25 miles
Direction: N-S
Address range: 1200 to 1599
Direction: N-S
Address range: 1200 to 1599
Holdrege St
Length: 0.21 miles
Direction: SW-NE
Direction: SW-NE
X St
Length: 0.21 miles
Direction: E-W
Address range: 632 to 799
Direction: E-W
Address range: 632 to 799
N 8th St
Length: 0.20 miles
Direction: N-S
Address range: 800 to 1099
Direction: N-S
Address range: 800 to 1099
N 7th St
Length: 0.20 miles
Direction: N-S
Address range: 1000 to 1299
Direction: N-S
Address range: 1000 to 1299
Court St
Length: 0.18 miles
Direction: E-W
Address range: 1200 to 1399
Direction: E-W
Address range: 1200 to 1399
N 15th St
Length: 0.10 miles
Direction: N-S
Address range: 1400 to 1499
Direction: N-S
Address range: 1400 to 1499
W St
Length: 0.10 miles
Direction: E-W
Address range: 800 to 899
Direction: E-W
Address range: 800 to 899
Rudolph St
Length: 0.07 miles
Direction: E-W
Address range: 1500 to 1599
Direction: E-W
Address range: 1500 to 1599
Jessie Pl
Length: 0.07 miles
Direction: N-S
Direction: N-S
N 11th St
Length: 0.04 miles
Direction: N-S
Direction: N-S
7th St
Length: 0.04 miles
Direction: N-S
Direction: N-S
N 13th St
Length: 0.03 miles
Direction: N-S
Address range: 1500 to 1599
Direction: N-S
Address range: 1500 to 1599
N 16th St
Length: 0.03 miles
Direction: N-S
Address range: 1500 to 1599
Direction: N-S
Address range: 1500 to 1599
Railroad features:
Union Pacific RR
Length: 1.43 miles
Directions: E-W, SW-NE
Directions: E-W, SW-NE
Burlington Northern Santa Fe Rlwy
Length: 1.07 miles
Direction: SW-NE
Direction: SW-NE
Other features:
Antelope Crk
Length: 0.01 miles
Direction: SE-NW
Direction: SE-NW