North Gate neighborhood in Baton Rouge, Louisiana (LA), 70802, 70803 detailed profile
Settings
X

Business Search - 14 Million verified businesses
Area: 0.044 square miles
Population: 196
Population density:
| North Gate: | 4,428 people per square mile |
| Baton Rouge: | 2,882 people per square mile |

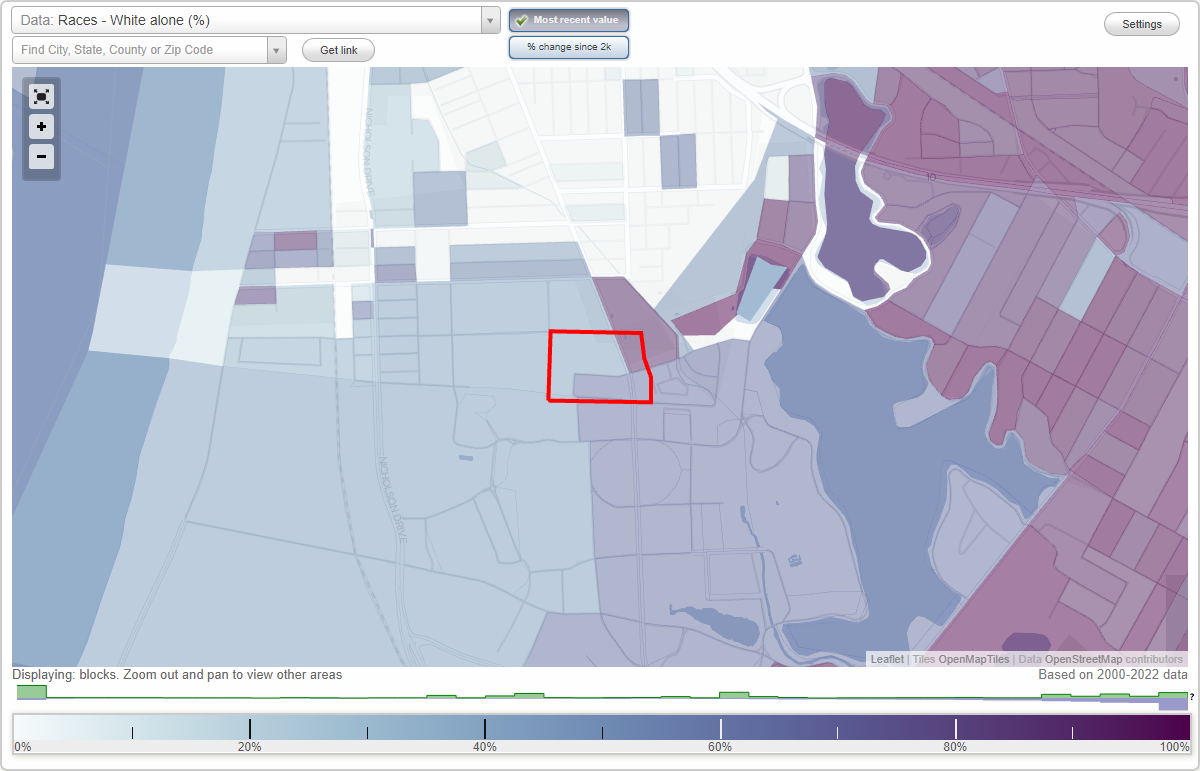
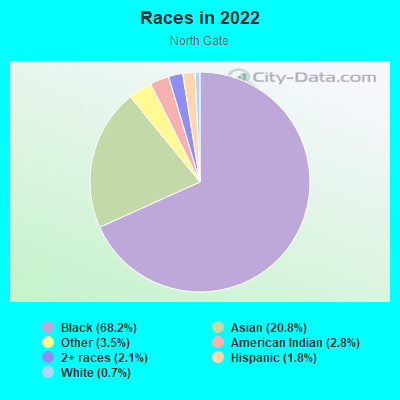
- 19368.2%Black
- 5920.8%Asian
- 103.5%Some other race
- 82.8%American Indian
- 62.1%Two or more races
- 51.8%Hispanic or Latino
- 20.7%White
Median household income in 2022:
| North Gate: | $39,896 |
| Baton Rouge: | $50,304 |
Distribution of median household income
![Distribution of median household income]()
- 7Less than $10,000
- 15$10,000 to $19,999
- 4$20,000 to $29,999
- 38$30,000 to $39,999
- 9$40,000 to $49,999
- 6$50,000 to $59,999
- 12$60,000 to $74,999
- 6$75,000 to $99,999
- 4$100,000 to $124,999
- 18$125,000 to $149,999
- 2$150,000 to $199,999
- 8$200,000 or more

Distribution of owner-occupied house/condo value
![Distribution of owner-occupied house/condo value]()
- 7Less than $50,000
- 15$50,000 to $99,999
- 10$100,000 to $149,999
- 6$150,000 to $199,999
- 2$200,000 to $249,999
- 2$300,000 to $399,999
- 5$400,000 to $499,999
- 3$500,000 to $749,999
- 4$750,000 to $999,999
- 3$1,000,000 or more

Distribution of rent paid by renters
![Distribution of rent paid by renters]()
- 3Less than $100
- 6$100 to $199
- 4$400 to $499
- 13$500 to $599
- 6$600 to $699
- 40$700 to $799
- 16$800 to $899
- 49$900 to $999
- 59$1,000 to $1,249
- 4$1,250 to $1,499
- 17$1,500 to $1,999
- 3$2,000 or more

Median rent in 2022:
| North Gate: | $665 |
| Baton Rouge: | $832 |
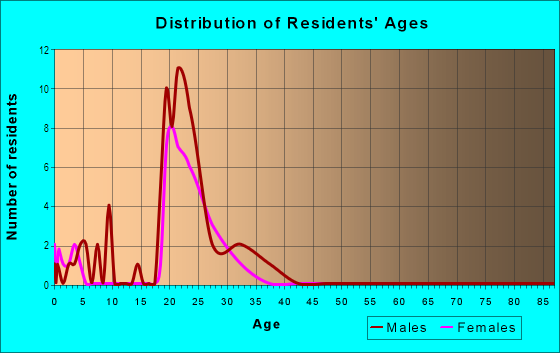
| Males: | 77 |
| Females: | 118 |
Males:
| This neighborhood: | 58.1 years |
| Whole city: | 29.6 years |
| This neighborhood: | 47.7 years |
| Whole city: | 32.8 years |
Average household size:
| North Gate: | 2.7 people |
| Baton Rouge: | 2.3 people |
Percentage of family households:
| North Gate: | 47.7% |
| Baton Rouge: | 36.6% |
| Here: | 23.9% |
| Baton Rouge: | 27.8% |
Percentage of married-couple families with children (among all households):
| North Gate: | 21.4% |
| Baton Rouge: | 15.1% |
Percentage of single-mother households (among all households):
| North Gate: | 9.2% |
| Baton Rouge: | 22.4% |
Percentage of never married males 15 years old and over:
Percentage of never married females 15 years old and over:
| North Gate: | 10.1% |
| Baton Rouge: | 27.3% |
Percentage of never married females 15 years old and over:
| North Gate: | 18.9% |
| city: | 27.2% |
Percentage of people that speak English not well or not at all:
| North Gate: | 0.0% |
| Baton Rouge: | 1.8% |
Percentage of people born in this state:
Percentage of people born in another U.S. state:
Percentage of native residents but born outside the U.S.:
Percentage of foreign born residents:
| Here: | 67.5% |
| Baton Rouge: | 74.7% |
Percentage of people born in another U.S. state:
| North Gate: | 18.0% |
| Baton Rouge: | 17.8% |
Percentage of native residents but born outside the U.S.:
| Here: | 0.0% |
| city: | 0.5% |
Percentage of foreign born residents:
| Here: | 14.6% |
| Baton Rouge: | 7.0% |
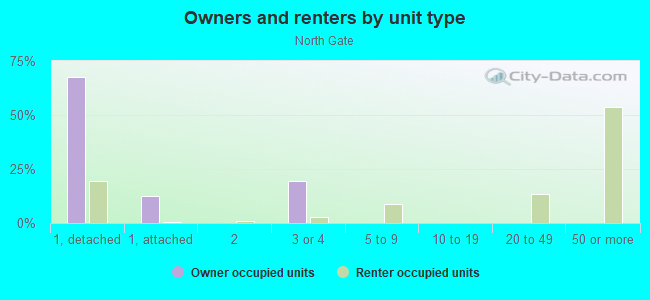
Owner-occupied
Renter-occupied

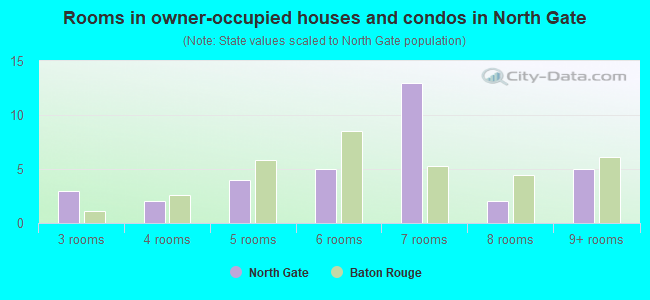
- Rooms in owner-occupied houses and condos in North Gate
- 01 room
- 02 rooms
- 33 rooms
- 24 rooms
- 45 rooms
- 56 rooms
- 137 rooms
- 28 rooms
- 59+ rooms
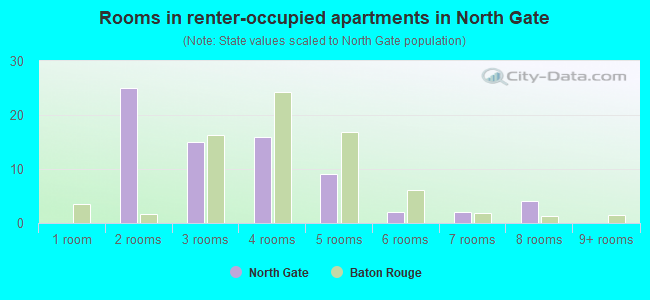
- Rooms in renter-occupied apartments in North Gate
- 01 room
- 252 rooms
- 153 rooms
- 164 rooms
- 95 rooms
- 26 rooms
- 27 rooms
- 48 rooms
- 09+ rooms
Owner-occupied
Renter-occupied
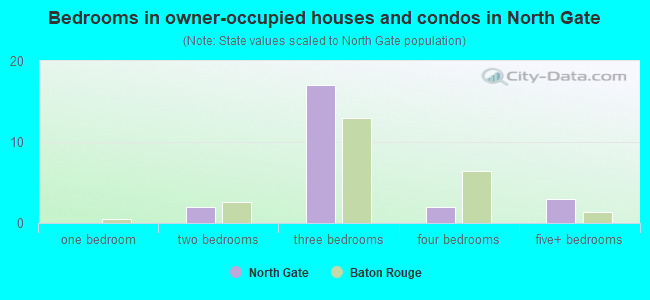
- Bedrooms in owner-occupied houses and condos in North Gate
- 0no bedroom
- 01 bedroom
- 22 bedrooms
- 173 bedrooms
- 24 bedrooms
- 35+ bedrooms
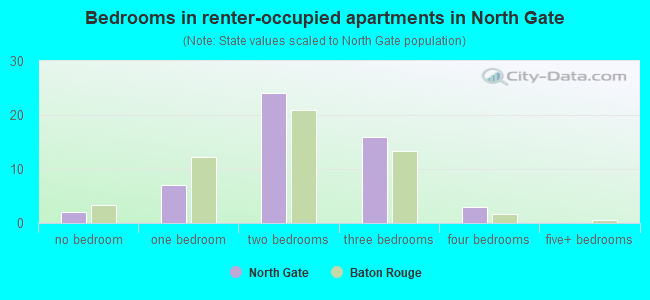
- Bedrooms in renter-occupied apartments in North Gate
- 2no bedroom
- 71 bedroom
- 242 bedrooms
- 163 bedrooms
- 34 bedrooms
- 05+ bedrooms
Average number of cars or other vehicles available in houses/condos:
Average number of cars or other vehicles available in apartments:
| This neighborhood: | 1.4 |
| Baton Rouge: | 1.7 |
Average number of cars or other vehicles available in apartments:
| Here: | 0.7 |
| city: | 1.3 |
Percentage of units with a mortgage:
| North Gate: | 37.8% |
| Baton Rouge: | 56.3% |
Average estimated value of detached houses in 2022 (96.7% of all units):
| North Gate: | $100,077 |
| Louisiana: | $273,555 |
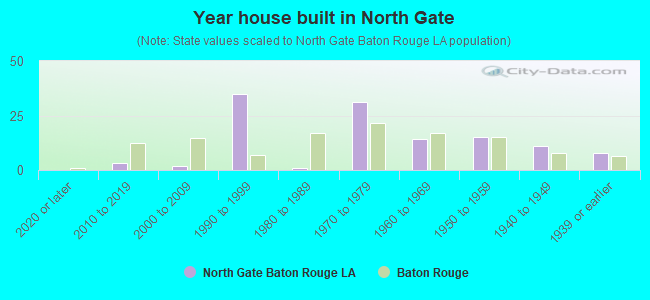
- Year house built in North Gate
- 02020 or later
- 32010 to 2019
- 22000 to 2009
- 351990 to 1999
- 11980 to 1989
- 311970 to 1979
- 141960 to 1969
- 151950 to 1959
- 111940 to 1949
- 81939 or earlier
City-data.com crime index for city in 2020 (higher means more crime):
| City: | 544.1 |
| U.S. average: | 219.5 |
Travel time to work (commute)
![Travel time to work (commute)]()
- 6Less than 5 minutes
- 445 to 9 minutes
- 8910 to 14 minutes
- 10215 to 19 minutes
- 2020 to 24 minutes
- 425 to 29 minutes
- 530 to 34 minutes
- 435 to 39 minutes
- 245 to 59 minutes
- 860 to 89 minutes

Means of transportation to work
![Means of transportation to work]()
- 47.9%29Drove a car alone
- 8.3%5Carpooled
- 8.3%5Bus
- 6.6%4Bicycle
- 14.9%9Walked
- 9.9%6Worked at home

Time leaving home to go to work
![Time leaving home to go to work]()
- 712:00 a.m. to 4:59 a.m.
- 165:30 a.m. to 5:59 a.m.
- 116:00 a.m. to 6:29 a.m.
- 276:30 a.m. to 6:59 a.m.
- 287:00 a.m. to 7:29 a.m.
- 417:30 a.m. to 7:59 a.m.
- 358:00 a.m. to 8:29 a.m.
- 148:30 a.m. to 8:59 a.m.
- 549:00 a.m. to 9:59 a.m.
- 610:00 a.m. to 10:59 a.m.
- 712:00 p.m. to 3:59 p.m.
- 384:00 p.m. to 11:59 p.m.

Occupations of males:
- Percentage of males in management occupations (except farmers):
Here: 6.7% city: 9.5%
- Percentage of males in business and financial operations occupations:
Here: 21.0% city: 3.6%
- Percentage of males in computer and mathematical occupations:
Here: 75.7% city: 3.0%
- Percentage of males in architecture and engineering occupations:
Here: 30.3% city: 4.2%
- Percentage of males in life, physical, and social science occupations:
Here: 13.5% city: 1.5%
- Percentage of males in community and social services occupations:
Here: 21.0% city: 1.3%
- Percentage of males in legal occupations:
Here: 5.0% city: 2.3%
- Percentage of males in education, training, and library occupations:
Here: 129.5% city: 6.9%
- Percentage of males in arts, design, entertainment, sports, and media occupations:
Here: 7.6% city: 2.5%
- Percentage of males in service occupations:
Here: 49.2% city: 16.2%
- Percentage of males in sales and office occupations:
Here: 28.3% city: 12.7%
- Percentage of males in construction, extraction, and maintenance occupations:
Here: 71.5% city: 8.7%
- Percentage of males in production occupations:
Here: 4.2% city: 6.5%
- Percentage of males in transportation occupations:
Here: 18.3% city: 6.6%
Occupations of females:
- Percentage of females in management occupations (except farmers):
Here: 29.3% city: 8.6%
- Percentage of females in business and financial operations occupations:
Here: 3.6% city: 4.9%
- Percentage of females in life, physical, and social science occupations:
Here: 16.1% city: 1.3%
- Percentage of females in education, training, and library occupations:
Here: 8.0% city: 10.7%
- Percentage of females in arts, design, entertainment, sports, and media occupations:
Here: 14.6% city: 2.3%
- Percentage of females in healthcare practitioners and technical occupations:
Here: 7.3% city: 7.6%
- Percentage of females in service occupations:
Here: 81.9% city: 24.5%
- Percentage of females in sales and office occupations:
Here: 6.5% city: 26.5%
- Percentage of females in production occupations:
Here: 8.8% city: 1.8%
- Percentage of females in transportation occupations:
Here: 38.0% city: 1.4%
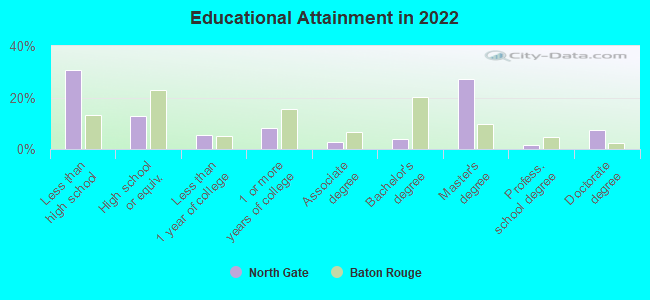
Education in this neighborhood (subdivision or community):
- Percentage of people 3 years and older in K-12 schools:
North Gate: 8.5% Baton Rouge: 14.3%
- Percentage of people 3 years and older in undergraduate colleges:
North Gate: 59.3% Baton Rouge: 14.0%
- Percentage of people 3 years and older in grad. or professional schools:
North Gate: 16.4% Baton Rouge: 2.5%
- Percentage of students K-12 enrolled in private schools:
North Gate: 25.0% Baton Rouge: 22.0%
Percentage of population below poverty level:
| North Gate: | 33.7% |
| Baton Rouge: | 22.4% |
Median year owner moved in (as recorded in 2022):
Median year renter moved in (as recorded in 2022):
| North Gate: | 1992 |
| Baton Rouge: | 2007 |
Median year renter moved in (as recorded in 2022):
| North Gate: | 2014 |
| Baton Rouge: | 2020 |
Percentage of married-couple families with both working:
| North Gate: | 290.3% |
| Baton Rouge: | 80.7% |
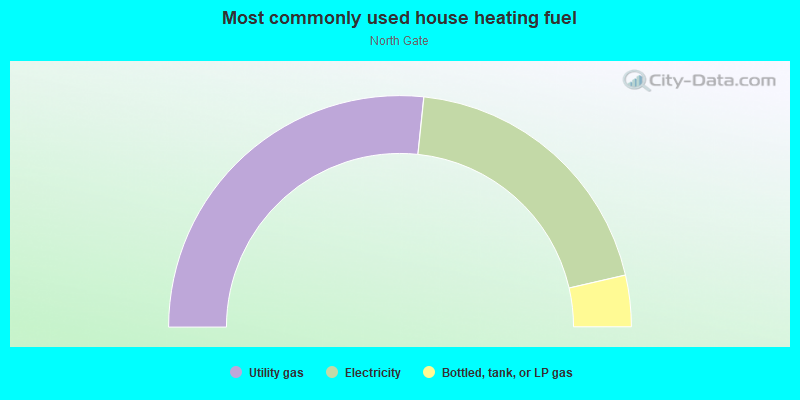
- 53.3%Utility gas
- 39.5%Electricity
- 7.2%Bottled, tank, or LP gas
Roads and streets:
W Chimes St
Length: 0.17 miles
Direction: E-W
Address range: 100 to 299
Direction: E-W
Address range: 100 to 299
Highland Rd
Length: 0.16 miles
Directions: N-S, SE-NW
Address range: 3200 to 3399
Directions: N-S, SE-NW
Address range: 3200 to 3399
W State St
Length: 0.16 miles
Direction: E-W
Address range: 100 to 299
Direction: E-W
Address range: 100 to 299
Lake St
Length: 0.07 miles
Directions: E-W, N-S, SE-NW, SW-NE
Address range: 3300 to 3399
Directions: E-W, N-S, SE-NW, SW-NE
Address range: 3300 to 3399
E State St
Length: 0.06 miles
Direction: E-W
Address range: 100 to 193
Direction: E-W
Address range: 100 to 193