North Rock neighborhood in Rockford, Illinois (IL), 61103 detailed profile
Settings
X


Business Search - 14 Million verified businesses
Area: 1.133 square miles
Population: 384
Population density:
| North Rock: | 339 people per square mile |
| Rockford: | 2,604 people per square mile |

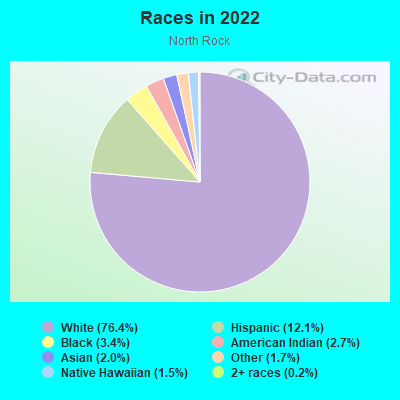
- 31076.4%White
- 4912.1%Hispanic or Latino
- 143.4%Black
- 112.7%American Indian
- 82.0%Asian
- 71.7%Some other race
- 61.5%Native Hawaiian and Other
Pacific Islander - 10.2%Two or more races
Median household income in 2022:
| North Rock: | $83,106 |
| Rockford: | $53,994 |
Distribution of median household income
![Distribution of median household income]()
- 2Less than $10,000
- 59$10,000 to $19,999
- 23$20,000 to $29,999
- 135$30,000 to $39,999
- 5$40,000 to $49,999
- 10$50,000 to $59,999
- 20$60,000 to $74,999
- 20$75,000 to $99,999
- 18$100,000 to $124,999
- 5$125,000 to $149,999
- 27$150,000 to $199,999
- 10$200,000 or more

Distribution of owner-occupied house/condo value
![Distribution of owner-occupied house/condo value]()
- 39Less than $50,000
- 179$50,000 to $99,999
- 28$100,000 to $149,999
- 13$150,000 to $199,999
- 26$200,000 to $249,999
- 14$250,000 to $299,999
- 8$300,000 to $399,999
- 2$400,000 to $499,999
- 3$500,000 to $749,999
- 13$1,000,000 or more

Distribution of rent paid by renters
![Distribution of rent paid by renters]()
- 32$100 to $199
- 39$200 to $299
- 42$300 to $399
- 116$400 to $499
- 46$500 to $599
- 82$600 to $699
- 119$700 to $799
- 294$800 to $899
- 2$900 to $999
- 27$1,000 to $1,249
- 18$1,250 to $1,499
- 15$1,500 to $1,999
- 106$2,000 or more

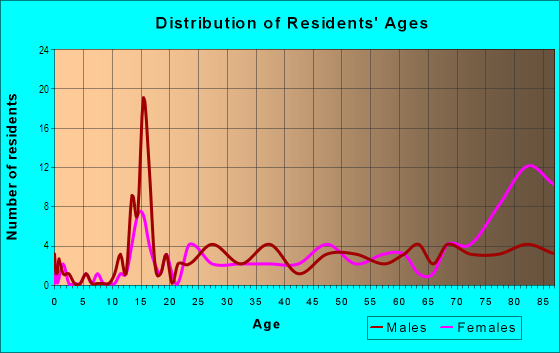
| Males: | 182 |
| Females: | 201 |
Males:
| This neighborhood: | 39.9 years |
| Whole city: | 35.2 years |
| This neighborhood: | 38.0 years |
| Whole city: | 39.3 years |
Average household size:
| North Rock: | 2.8 people |
| Rockford: | 2.4 people |
Percentage of family households:
| North Rock: | 65.9% |
| Rockford: | 39.3% |
| Here: | 57.6% |
| Rockford: | 36.1% |
Percentage of married-couple families with children (among all households):
| North Rock: | 26.3% |
| Rockford: | 19.8% |
Percentage of single-mother households (among all households):
| North Rock: | 6.0% |
| Rockford: | 16.9% |
Percentage of never married males 15 years old and over:
Percentage of never married females 15 years old and over:
| North Rock: | 15.8% |
| Rockford: | 20.2% |
Percentage of never married females 15 years old and over:
| North Rock: | 14.6% |
| city: | 19.9% |
Percentage of people that speak English not well or not at all:
| North Rock: | 3.1% |
| Rockford: | 2.9% |
Percentage of people born in this state:
Percentage of people born in another U.S. state:
Percentage of native residents but born outside the U.S.:
Percentage of foreign born residents:
| Here: | 68.1% |
| Rockford: | 70.1% |
Percentage of people born in another U.S. state:
| North Rock: | 22.0% |
| Rockford: | 17.3% |
Percentage of native residents but born outside the U.S.:
| Here: | 0.9% |
| city: | 2.2% |
Percentage of foreign born residents:
| Here: | 9.0% |
| Rockford: | 10.4% |
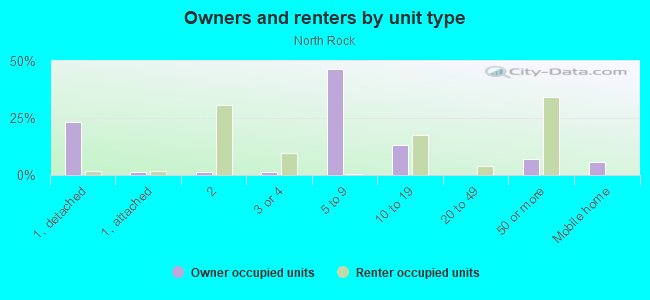
Owner-occupied
Renter-occupied

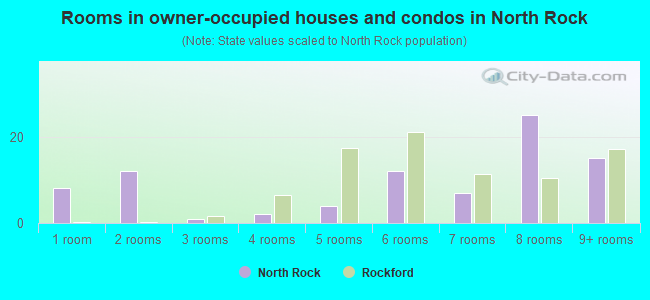
- Rooms in owner-occupied houses and condos in North Rock
- 81 room
- 122 rooms
- 13 rooms
- 24 rooms
- 45 rooms
- 126 rooms
- 77 rooms
- 258 rooms
- 159+ rooms
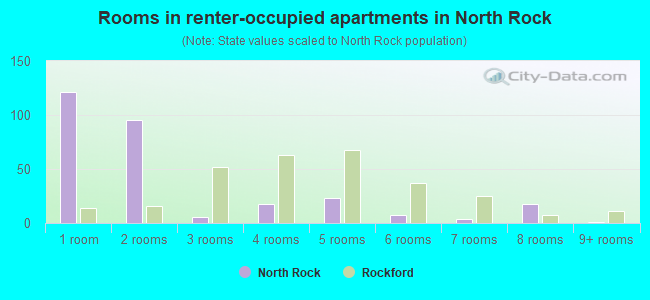
- Rooms in renter-occupied apartments in North Rock
- 1211 room
- 952 rooms
- 63 rooms
- 184 rooms
- 235 rooms
- 76 rooms
- 47 rooms
- 188 rooms
- 19+ rooms
Owner-occupied
Renter-occupied
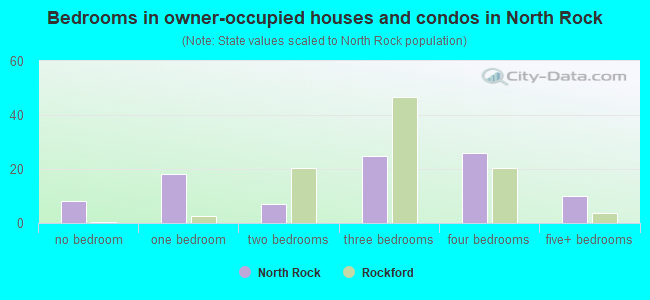
- Bedrooms in owner-occupied houses and condos in North Rock
- 8no bedroom
- 181 bedroom
- 72 bedrooms
- 253 bedrooms
- 264 bedrooms
- 105+ bedrooms
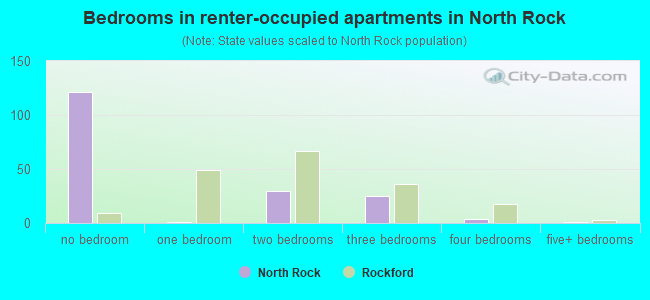
- Bedrooms in renter-occupied apartments in North Rock
- 121no bedroom
- 11 bedroom
- 302 bedrooms
- 253 bedrooms
- 44 bedrooms
- 15+ bedrooms
Average number of cars or other vehicles available in houses/condos:
Average number of cars or other vehicles available in apartments:
| This neighborhood: | 2.2 |
| Rockford: | 1.9 |
Average number of cars or other vehicles available in apartments:
| Here: | 1.9 |
| city: | 1.1 |
Percentage of units with a mortgage:
| North Rock: | 90.1% |
| Rockford: | 63.1% |
Average estimated value of detached houses in 2022 (49.3% of all units):
| North Rock: | $130,646 |
| Illinois: | $310,164 |
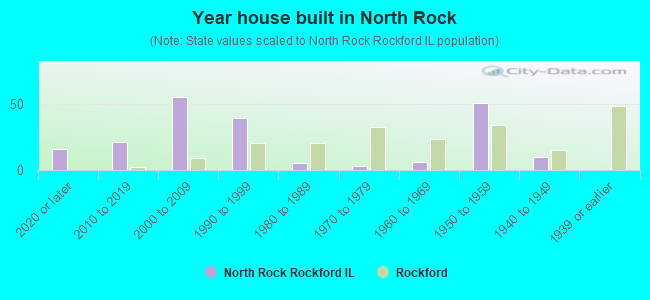
- Year house built in North Rock
- 162020 or later
- 212010 to 2019
- 552000 to 2009
- 391990 to 1999
- 51980 to 1989
- 31970 to 1979
- 61960 to 1969
- 511950 to 1959
- 101940 to 1949
- 01939 or earlier
City-data.com crime index for city in 2020 (higher means more crime):
| City: | 525.8 |
| U.S. average: | 219.5 |
Travel time to work (commute)
![Travel time to work (commute)]()
- 7Less than 5 minutes
- 165 to 9 minutes
- 3410 to 14 minutes
- 5115 to 19 minutes
- 4920 to 24 minutes
- 2625 to 29 minutes
- 2630 to 34 minutes
- 135 to 39 minutes
- 540 to 44 minutes
- 945 to 59 minutes
- 1060 to 89 minutes
- 390 or more minutes

Means of transportation to work
![Means of transportation to work]()
- 85.1%160Drove a car alone
- 4.3%8Carpooled
- 3.7%7Bus
- 2.1%4Taxi
- 22.4%42Bicycle
- 2.7%5Walked
- 5.9%11Other means
- 6.9%13Worked at home

Time leaving home to go to work
![Time leaving home to go to work]()
- 1012:00 a.m. to 4:59 a.m.
- 85:00 a.m. to 5:29 a.m.
- 115:30 a.m. to 5:59 a.m.
- 296:00 a.m. to 6:29 a.m.
- 266:30 a.m. to 6:59 a.m.
- 347:00 a.m. to 7:29 a.m.
- 407:30 a.m. to 7:59 a.m.
- 138:00 a.m. to 8:29 a.m.
- 128:30 a.m. to 8:59 a.m.
- 39:00 a.m. to 9:59 a.m.
- 210:00 a.m. to 10:59 a.m.
- 211:00 a.m. to 11:59 a.m.
- 1312:00 p.m. to 3:59 p.m.
- 264:00 p.m. to 11:59 p.m.

Occupations of males:
- Percentage of males in management occupations (except farmers):
Here: 12.6% city: 7.0%
- Percentage of males in business and financial operations occupations:
Here: 3.7% city: 2.3%
- Percentage of males in computer and mathematical occupations:
Here: 6.9% city: 2.7%
- Percentage of males in architecture and engineering occupations:
Here: 2.0% city: 3.2%
- Percentage of males in community and social services occupations:
Here: 6.2% city: 1.9%
- Percentage of males in legal occupations:
Here: 2.3% city: 0.8%
- Percentage of males in healthcare practitioners and technical occupations:
Here: 8.8% city: 2.2%
- Percentage of males in service occupations:
Here: 3.4% city: 12.6%
- Percentage of males in sales and office occupations:
Here: 21.3% city: 16.0%
- Percentage of males in construction, extraction, and maintenance occupations:
Here: 2.5% city: 6.8%
- Percentage of males in production occupations:
Here: 16.4% city: 18.7%
- Percentage of males in transportation occupations:
Here: 2.3% city: 6.0%
- Percentage of males in material moving occupations:
Here: 3.2% city: 10.5%
Occupations of females:
- Percentage of females in management occupations (except farmers):
Here: 7.0% city: 6.2%
- Percentage of females in business and financial operations occupations:
Here: 13.9% city: 3.4%
- Percentage of females in community and social services occupations:
Here: 6.4% city: 2.0%
- Percentage of females in legal occupations:
Here: 2.5% city: 0.6%
- Percentage of females in education, training, and library occupations:
Here: 14.0% city: 6.1%
- Percentage of females in arts, design, entertainment, sports, and media occupations:
Here: 3.4% city: 1.2%
- Percentage of females in healthcare practitioners and technical occupations:
Here: 16.8% city: 10.2%
- Percentage of females in service occupations:
Here: 8.5% city: 26.8%
- Percentage of females in sales and office occupations:
Here: 21.5% city: 25.9%
- Percentage of females in production occupations:
Here: 2.1% city: 7.5%
- Percentage of females in material moving occupations:
Here: 7.3% city: 4.8%
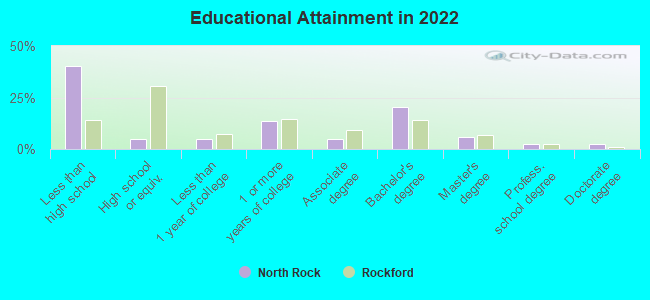
Education in this neighborhood (subdivision or community):
- Percentage of people 3 years and older in K-12 schools:
North Rock: 23.9% Rockford: 17.1%
- Percentage of people 3 years and older in undergraduate colleges:
North Rock: 3.5% Rockford: 3.4%
- Percentage of people 3 years and older in grad. or professional schools:
North Rock: 1.2% Rockford: 0.7%
- Percentage of students K-12 enrolled in private schools:
North Rock: 24.7% Rockford: 14.7%
Percentage of population below poverty level:
| North Rock: | 21.9% |
| Rockford: | 21.1% |
Median year owner moved in (as recorded in 2022):
| North Rock: | 2005 |
| Rockford: | 2010 |
Percentage of married-couple families with both working:
| North Rock: | 95.4% |
| Rockford: | 64.5% |
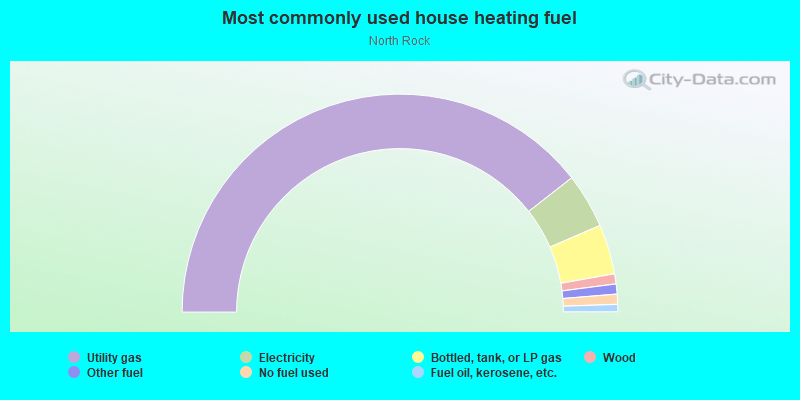
- 78.9%Utility gas
- 8.1%Electricity
- 7.4%Bottled, tank, or LP gas
- 1.5%Wood
- 1.5%Other fuel
- 1.5%No fuel used
- 1.1%Fuel oil, kerosene, etc.
Highways in this neighborhood:
State Rte 2 (N Main St)
Length: 0.21 miles
Direction: N-S
Address range: 5504 to 5703
Direction: N-S
Address range: 5504 to 5703
Roads and streets:
Shepherd Trl
Length: 2.12 miles
Directions: E-W, N-S, SE-NW, SW-NE
Address range: 4600 to 4998
Directions: E-W, N-S, SE-NW, SW-NE
Address range: 4600 to 4998
Elmwood Rd
Length: 1.04 miles
Directions: E-W, SE-NW
Address range: 1200 to 1949
Directions: E-W, SE-NW
Address range: 1200 to 1949
Hiawatha Dr
Length: 0.49 miles
Directions: E-W, N-S, SW-NE
Address range: 4700 to 4999
Directions: E-W, N-S, SW-NE
Address range: 4700 to 4999
Browns Beach Rd
Length: 0.45 miles
Directions: N-S, SE-NW
Address range: 5001 to 5325
Directions: N-S, SE-NW
Address range: 5001 to 5325
Northrock Dr
Length: 0.37 miles
Directions: N-S, SE-NW
Address range: 5000 to 5501
Directions: N-S, SE-NW
Address range: 5000 to 5501
Northrock Ct
Length: 0.33 miles
Direction: E-W
Address range: 1400 to 1799
Direction: E-W
Address range: 1400 to 1799
Johns Woods Dr
Length: 0.31 miles
Direction: E-W
Address range: 1 to 67
Direction: E-W
Address range: 1 to 67
Rose Rd
Length: 0.31 miles
Directions: N-S, SE-NW
Directions: N-S, SE-NW
Briar Ln
Length: 0.31 miles
Directions: E-W, SE-NW
Address range: 1 to 99
Directions: E-W, SE-NW
Address range: 1 to 99
Braur Pkwy
Length: 0.22 miles
Direction: E-W
Direction: E-W
Nebeshone Ln
Length: 0.20 miles
Directions: E-W, N-S
Address range: 5600 to 5799
Directions: E-W, N-S
Address range: 5600 to 5799
Spooner Dr
Length: 0.15 miles
Direction: N-S
Address range: 5000 to 5199
Direction: N-S
Address range: 5000 to 5199
Castle Dr
Length: 0.13 miles
Direction: E-W
Address range: 1800 to 1899
Direction: E-W
Address range: 1800 to 1899
Light St
Length: 0.09 miles
Direction: E-W
Address range: 833 to 998
Direction: E-W
Address range: 833 to 998
Harlem Rd
Length: 0.02 miles
Direction: E-W
Direction: E-W
Railroad features:
Soo Line RR
Length: 1.76 miles
Directions: N-S, SW-NE
Directions: N-S, SW-NE