Northeast (Northeast Historic District) neighborhood in Evanston, Illinois (IL), 60201, 60208 detailed profile
Settings
X


Business Search - 14 Million verified businesses
Area: 0.145 square miles
Population: 965
Population density:
| Northeast (Northeast Historic District): | 6,637 people per square mile |
| Evanston: | 9,752 people per square mile |

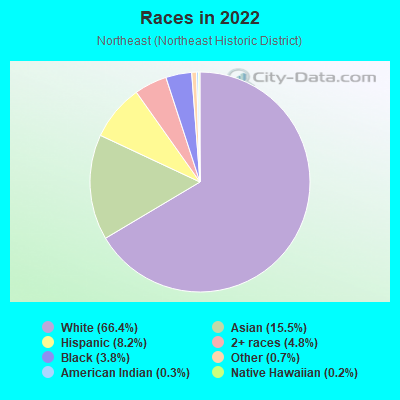
- 64766.4%White
- 15115.5%Asian
- 808.2%Hispanic or Latino
- 474.8%Two or more races
- 373.8%Black
- 70.7%Some other race
- 30.3%American Indian
- 20.2%Native Hawaiian and Other
Pacific Islander
Median household income in 2022:
| Northeast (Northeast Historic District): | $96,717 |
| Evanston: | $97,144 |
Distribution of median household income
![Distribution of median household income]()
- 31Less than $10,000
- 30$10,000 to $19,999
- 24$20,000 to $29,999
- 20$30,000 to $39,999
- 15$40,000 to $49,999
- 37$50,000 to $59,999
- 22$60,000 to $74,999
- 22$75,000 to $99,999
- 19$100,000 to $124,999
- 17$125,000 to $149,999
- 20$150,000 to $199,999
- 92$200,000 or more

Distribution of owner-occupied house/condo value
![Distribution of owner-occupied house/condo value]()
- 31$50,000 to $99,999
- 20$100,000 to $149,999
- 20$150,000 to $199,999
- 13$200,000 to $249,999
- 10$250,000 to $299,999
- 9$300,000 to $399,999
- 14$400,000 to $499,999
- 27$500,000 to $749,999
- 39$750,000 to $999,999
- 99$1,000,000 or more

Distribution of rent paid by renters
![Distribution of rent paid by renters]()
- 75$200 to $299
- 101$300 to $399
- 14$400 to $499
- 25$500 to $599
- 11$600 to $699
- 41$700 to $799
- 34$800 to $899
- 4$900 to $999
- 19$1,000 to $1,249
- 32$1,250 to $1,499
- 37$1,500 to $1,999
- 142$2,000 or more

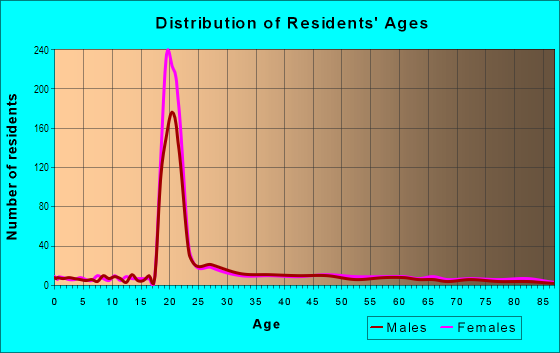
| Males: | 433 |
| Females: | 531 |
Males:
| This neighborhood: | 30.4 years |
| Whole city: | 39.6 years |
| This neighborhood: | 29.2 years |
| Whole city: | 42.5 years |
Average household size:
| Northeast (Northeast Historic District): | 2.2 people |
| Evanston: | 27.0 people |
Percentage of family households:
| Northeast (Northeast Historic District): | 33.8% |
| Evanston: | 36.2% |
| Here: | 42.4% |
| Evanston: | 36.9% |
Percentage of married-couple families with children (among all households):
| Northeast (Northeast Historic District): | 27.8% |
| Evanston: | 31.7% |
Percentage of single-mother households (among all households):
| Northeast (Northeast Historic District): | 4.5% |
| Evanston: | 9.5% |
Percentage of never married males 15 years old and over:
Percentage of never married females 15 years old and over:
| Northeast (Northeast Historic District): | 25.2% |
| Evanston: | 20.0% |
Percentage of never married females 15 years old and over:
| Northeast (Northeast Historic District): | 35.8% |
| city: | 24.1% |
Percentage of people that speak English not well or not at all:
| Northeast (Northeast Historic District): | 0.2% |
| Evanston: | 1.2% |
Percentage of people born in this state:
Percentage of people born in another U.S. state:
Percentage of native residents but born outside the U.S.:
Percentage of foreign born residents:
| Here: | 42.8% |
| Evanston: | 48.3% |
Percentage of people born in another U.S. state:
| Northeast (Northeast Historic District): | 40.6% |
| Evanston: | 35.9% |
Percentage of native residents but born outside the U.S.:
| Here: | 1.4% |
| city: | 2.0% |
Percentage of foreign born residents:
| Here: | 15.2% |
| Evanston: | 13.8% |
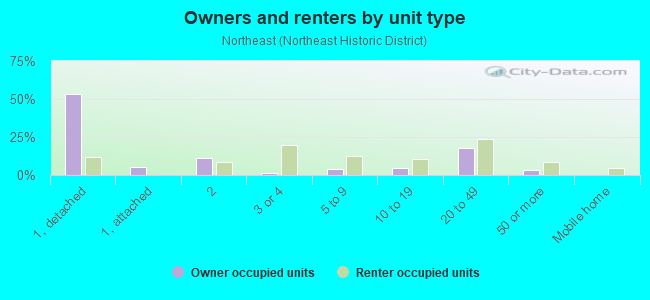
Owner-occupied
Renter-occupied

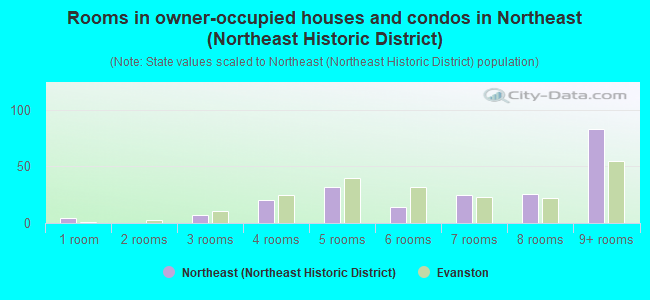
- Rooms in owner-occupied houses and condos in Northeast <
> - 41 room
- 02 rooms
- 73 rooms
- 204 rooms
- 325 rooms
- 146 rooms
- 257 rooms
- 268 rooms
- 839+ rooms
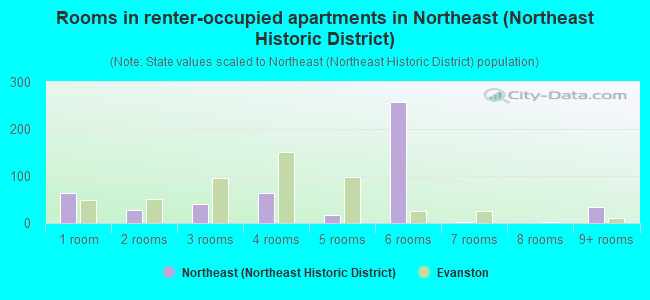
- Rooms in renter-occupied apartments in Northeast <
> - 641 room
- 282 rooms
- 413 rooms
- 634 rooms
- 185 rooms
- 2586 rooms
- 27 rooms
- 08 rooms
- 339+ rooms
Owner-occupied
Renter-occupied
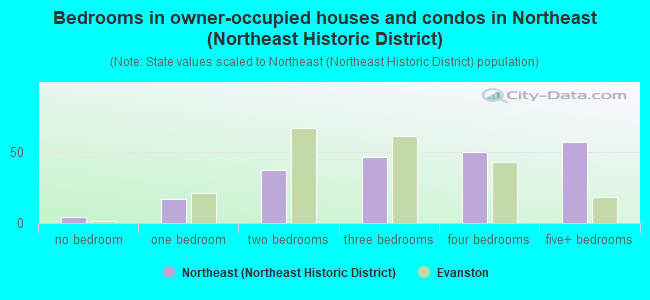
- Bedrooms in owner-occupied houses and condos in Northeast <
> - 4no bedroom
- 171 bedroom
- 372 bedrooms
- 463 bedrooms
- 504 bedrooms
- 575+ bedrooms
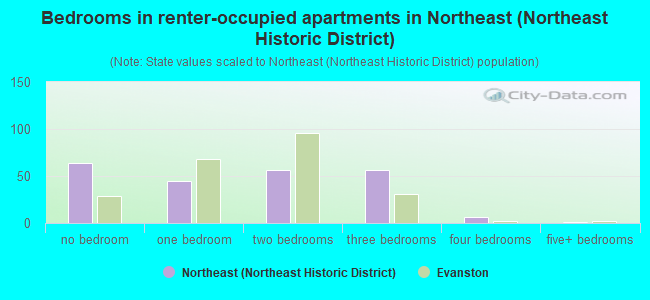
- Bedrooms in renter-occupied apartments in Northeast <
> - 64no bedroom
- 451 bedroom
- 562 bedrooms
- 563 bedrooms
- 64 bedrooms
- 15+ bedrooms
Average number of cars or other vehicles available in houses/condos:
Average number of cars or other vehicles available in apartments:
| This neighborhood: | 0.8 |
| Evanston: | 1.5 |
Average number of cars or other vehicles available in apartments:
| Here: | 1.3 |
| city: | 0.8 |
Percentage of units with a mortgage:
| Northeast (Northeast Historic District): | 52.2% |
| Evanston: | 66.0% |
Housing prices:
- Average estimated value of detached houses in 2022 (42.8% of all units):
Northeast (Northeast Historic District): $1,272,915 Evanston: $655,275
- Average estimated '22 value of housing units in 5-or-more-unit structures (5.4% of all units):
Northeast (Northeast Historic District): $250,986 Evanston: $328,239
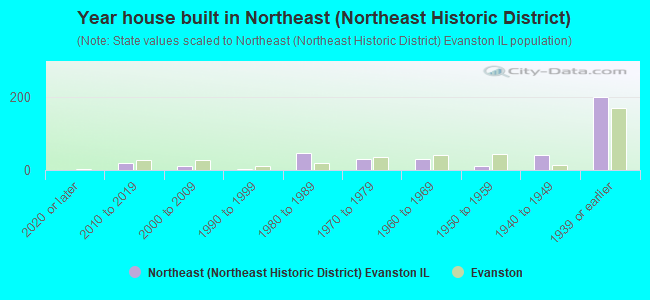
- Year house built in Northeast <
> - 02020 or later
- 192010 to 2019
- 112000 to 2009
- 31990 to 1999
- 461980 to 1989
- 301970 to 1979
- 311960 to 1969
- 121950 to 1959
- 411940 to 1949
- 1991939 or earlier
City-data.com crime index for city in 2020 (higher means more crime):
| City: | 130.2 |
| U.S. average: | 219.5 |
Travel time to work (commute)
![Travel time to work (commute)]()
- 17Less than 5 minutes
- 545 to 9 minutes
- 7110 to 14 minutes
- 5415 to 19 minutes
- 3420 to 24 minutes
- 725 to 29 minutes
- 1630 to 34 minutes
- 735 to 39 minutes
- 340 to 44 minutes
- 3245 to 59 minutes
- 2260 to 89 minutes
- 490 or more minutes

Means of transportation to work
![Means of transportation to work]()
- 32.3%137Drove a car alone
- 2.1%9Carpooled
- 1.9%8Bus
- 5.9%25Subway or elevated rail
- 4.9%21Long-distance train or commuter rail
- 0.2%1Light rail, streetcar or trolley
- 5.2%22Bicycle
- 29.4%125Walked
- 0.2%1Other means
- 20.5%87Worked at home

Time leaving home to go to work
![Time leaving home to go to work]()
- 712:00 a.m. to 4:59 a.m.
- 15:00 a.m. to 5:29 a.m.
- 65:30 a.m. to 5:59 a.m.
- 46:00 a.m. to 6:29 a.m.
- 156:30 a.m. to 6:59 a.m.
- 307:00 a.m. to 7:29 a.m.
- 307:30 a.m. to 7:59 a.m.
- 408:00 a.m. to 8:29 a.m.
- 388:30 a.m. to 8:59 a.m.
- 489:00 a.m. to 9:59 a.m.
- 2110:00 a.m. to 10:59 a.m.
- 1511:00 a.m. to 11:59 a.m.
- 4512:00 p.m. to 3:59 p.m.
- 194:00 p.m. to 11:59 p.m.

Occupations of males:
- Percentage of males in management occupations (except farmers):
Here: 17.3% city: 15.8%
- Percentage of males in business and financial operations occupations:
Here: 8.5% city: 8.9%
- Percentage of males in computer and mathematical occupations:
Here: 4.9% city: 8.5%
- Percentage of males in life, physical, and social science occupations:
Here: 7.9% city: 4.5%
- Percentage of males in community and social services occupations:
Here: 2.3% city: 1.6%
- Percentage of males in legal occupations:
Here: 3.5% city: 3.9%
- Percentage of males in education, training, and library occupations:
Here: 25.2% city: 11.6%
- Percentage of males in arts, design, entertainment, sports, and media occupations:
Here: 9.4% city: 4.3%
- Percentage of males in healthcare practitioners and technical occupations:
Here: 3.0% city: 2.5%
- Percentage of males in service occupations:
Here: 8.5% city: 10.6%
- Percentage of males in sales and office occupations:
Here: 7.9% city: 13.0%
- Percentage of males in material moving occupations:
Here: 1.9% city: 3.6%
Occupations of females:
- Percentage of females in management occupations (except farmers):
Here: 6.9% city: 13.2%
- Percentage of females in business and financial operations occupations:
Here: 7.1% city: 8.2%
- Percentage of females in computer and mathematical occupations:
Here: 3.6% city: 3.3%
- Percentage of females in architecture and engineering occupations:
Here: 1.1% city: 1.1%
- Percentage of females in life, physical, and social science occupations:
Here: 4.7% city: 3.2%
- Percentage of females in community and social services occupations:
Here: 5.0% city: 3.4%
- Percentage of females in legal occupations:
Here: 3.0% city: 1.9%
- Percentage of females in education, training, and library occupations:
Here: 15.7% city: 15.2%
- Percentage of females in arts, design, entertainment, sports, and media occupations:
Here: 5.2% city: 5.3%
- Percentage of females in healthcare practitioners and technical occupations:
Here: 3.2% city: 8.9%
- Percentage of females in service occupations:
Here: 14.5% city: 16.3%
- Percentage of females in sales and office occupations:
Here: 26.7% city: 17.8%
- Percentage of females in production occupations:
Here: 2.1% city: 0.7%
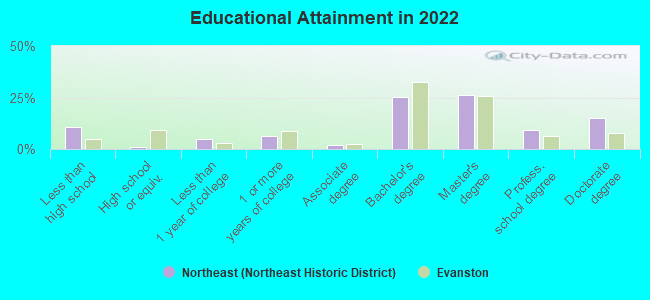
Education in this neighborhood (subdivision or community):
- Percentage of people 3 years and older in K-12 schools:
Northeast (Northeast Historic District): 12.9% Evanston: 14.3%
- Percentage of people 3 years and older in undergraduate colleges:
Northeast (Northeast Historic District): 41.2% Evanston: 11.6%
- Percentage of people 3 years and older in grad. or professional schools:
Northeast (Northeast Historic District): 6.1% Evanston: 5.1%
- Percentage of students K-12 enrolled in private schools:
Northeast (Northeast Historic District): 27.4% Evanston: 17.2%
Percentage of population below poverty level:
| Northeast (Northeast Historic District): | 17.5% |
| Evanston: | 10.3% |
Median year owner moved in (as recorded in 2022):
Median year renter moved in (as recorded in 2022):
| Northeast (Northeast Historic District): | 2005 |
| Evanston: | 2010 |
Median year renter moved in (as recorded in 2022):
| Northeast (Northeast Historic District): | 2019 |
| Evanston: | 2021 |
Percentage of married-couple families with both working:
| Northeast (Northeast Historic District): | 98.0% |
| Evanston: | 78.6% |
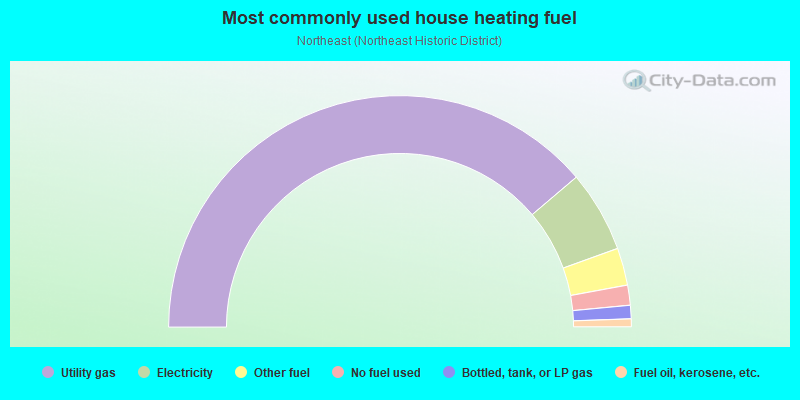
- 77.6%Utility gas
- 11.4%Electricity
- 5.2%Other fuel
- 2.8%No fuel used
- 1.9%Bottled, tank, or LP gas
- 1.1%Fuel oil, kerosene, etc.
Roads and streets:
Orrington Ave
Length: 0.58 miles
Direction: N-S
Address range: 1871 to 2337
Direction: N-S
Address range: 1871 to 2337
Sherman Ave
Length: 0.38 miles
Direction: N-S
Address range: 2046 to 2365
Direction: N-S
Address range: 2046 to 2365
Colfax St
Length: 0.36 miles
Direction: E-W
Address range: 636 to 865
Direction: E-W
Address range: 636 to 865
Noyes St
Length: 0.20 miles
Direction: E-W
Address range: 664 to 799
Direction: E-W
Address range: 664 to 799
Sheridan Rd
Length: 0.20 miles
Direction: N-S
Address range: 1910 to 2211
Direction: N-S
Address range: 1910 to 2211
Foster St
Length: 0.17 miles
Direction: E-W
Address range: 600 to 699
Direction: E-W
Address range: 600 to 699
Haven St
Length: 0.17 miles
Direction: E-W
Address range: 600 to 699
Direction: E-W
Address range: 600 to 699
Garrett Pl
Length: 0.17 miles
Direction: E-W
Address range: 600 to 699
Direction: E-W
Address range: 600 to 699
Emerson St
Length: 0.17 miles
Direction: E-W
Address range: 600 to 722
Direction: E-W
Address range: 600 to 722
Simpson St
Length: 0.14 miles
Direction: E-W
Address range: 700 to 799
Direction: E-W
Address range: 700 to 799
Library Pl
Length: 0.11 miles
Direction: E-W
Address range: 634 to 699
Direction: E-W
Address range: 634 to 699
Dartmouth Pl
Length: 0.11 miles
Direction: E-W
Address range: 636 to 699
Direction: E-W
Address range: 636 to 699
Colfax Ct
Length: 0.04 miles
Direction: N-S
Direction: N-S