Northeast Lexington Residential neighborhood in Lexington, Kentucky (KY), 40508 detailed profile
Settings
X


Area: 0.033 square miles
Population: 264
Population density: 8,012 people per square mile

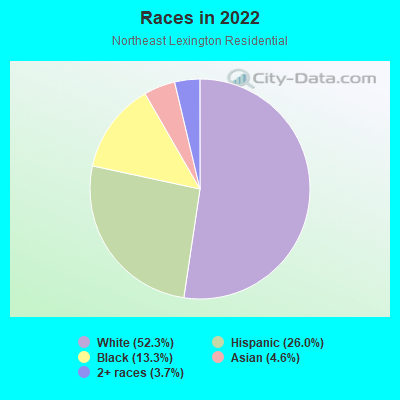
- 16952.3%White
- 8426.0%Hispanic or Latino
- 4313.3%Black
- 154.6%Asian
- 123.7%Two or more races

Median household income in 2022:
| Northeast Lexington Residential: | $54,913 |
| Kentucky: | $59,341 |
Distribution of median household income
![Distribution of median household income]()
- 32Less than $10,000
- 16$10,000 to $19,999
- 34$20,000 to $29,999
- 13$30,000 to $39,999
- 10$40,000 to $49,999
- 14$50,000 to $59,999
- 9$60,000 to $74,999
- 8$75,000 to $99,999
- 13$100,000 to $124,999
- 8$125,000 to $149,999
- 19$150,000 to $199,999
- 6$200,000 or more

Distribution of owner-occupied house/condo value
![Distribution of owner-occupied house/condo value]()
- 4Less than $50,000
- 36$50,000 to $99,999
- 8$100,000 to $149,999
- 11$150,000 to $199,999
- 6$200,000 to $249,999
- 9$250,000 to $299,999
- 11$300,000 to $399,999
- 7$400,000 to $499,999
- 5$500,000 to $749,999

Distribution of rent paid by renters
![Distribution of rent paid by renters]()
- 21$300 to $399
- 28$400 to $499
- 43$500 to $599
- 20$600 to $699
- 13$700 to $799
- 15$800 to $899
- 5$900 to $999
- 8$1,000 to $1,249
- 4$1,250 to $1,499

Median rent in 2022:
| Northeast Lexington Residential: | $625 |
| Kentucky: | $702 |
| Males: | 122 |
| Females: | 142 |
| Males: | 32.7 years |
| Females: | 31.1 years |
Average household size:
| Northeast Lexington Residential: | 16.3 people |
| Kentucky: | 2.4 people |
Percentage of family households:
| Northeast Lexington Residential: | 31.9% |
| Kentucky: | 45.9% |
| Here: | 25.6% |
| Kentucky: | 47.1% |
Percentage of married-couple families with children (among all households):
| Northeast Lexington Residential: | 35.3% |
| Kentucky: | 58.4% |
Percentage of single-mother households (among all households):
| Northeast Lexington Residential: | 25.5% |
| Kentucky: | 9.3% |
Percentage of never married males 15 years old and over:
Percentage of never married females 15 years old and over:
| Northeast Lexington Residential: | 27.0% |
| Kentucky: | 16.3% |
Percentage of never married females 15 years old and over:
| Northeast Lexington Residential: | 21.8% |
| Kentucky: | 13.5% |
Percentage of people that speak English not well or not at all:
| Northeast Lexington Residential: | 0.4% |
| Kentucky: | 1.1% |
Percentage of people born in this state:
Percentage of people born in another U.S. state:
Percentage of native residents but born outside the U.S.:
Percentage of foreign born residents:
| Here: | 66.6% |
| Kentucky: | 67.2% |
Percentage of people born in another U.S. state:
| Northeast Lexington Residential: | 26.5% |
| Kentucky: | 28.0% |
Percentage of native residents but born outside the U.S.:
| Here: | 0.3% |
| Kentucky: | 0.8% |
Percentage of foreign born residents:
| Here: | 6.6% |
| Kentucky: | 4.0% |
Owner-occupied
Renter-occupied

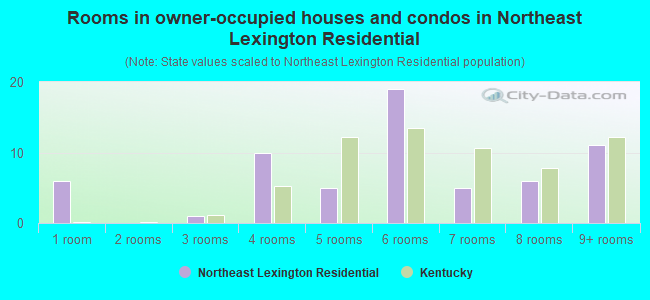
- Rooms in owner-occupied houses and condos in Northeast Lexington Residential
- 61 room
- 02 rooms
- 13 rooms
- 104 rooms
- 55 rooms
- 196 rooms
- 57 rooms
- 68 rooms
- 119+ rooms
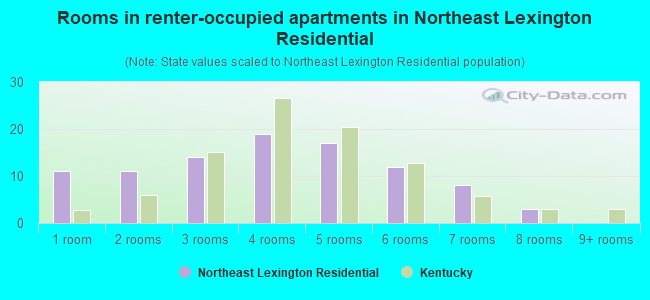
- Rooms in renter-occupied apartments in Northeast Lexington Residential
- 111 room
- 112 rooms
- 143 rooms
- 194 rooms
- 175 rooms
- 126 rooms
- 87 rooms
- 38 rooms
- 09+ rooms
Owner-occupied
Renter-occupied
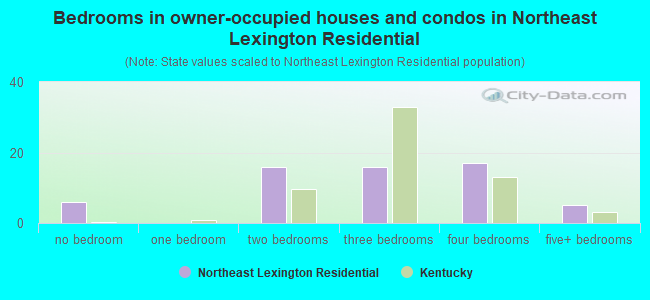
- Bedrooms in owner-occupied houses and condos in Northeast Lexington Residential
- 6no bedroom
- 01 bedroom
- 162 bedrooms
- 163 bedrooms
- 174 bedrooms
- 55+ bedrooms
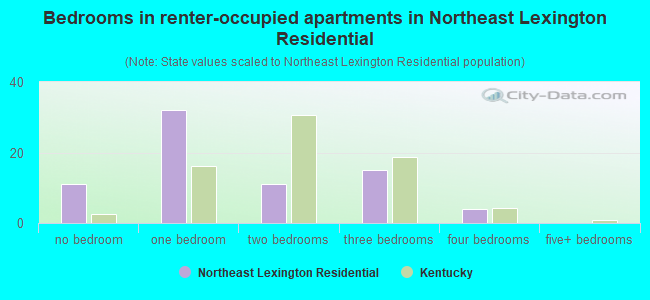
- Bedrooms in renter-occupied apartments in Northeast Lexington Residential
- 11no bedroom
- 321 bedroom
- 112 bedrooms
- 153 bedrooms
- 44 bedrooms
- 05+ bedrooms
Average number of cars or other vehicles available in houses/condos:
Average number of cars or other vehicles available in apartments:
| This neighborhood: | 1.4 |
| Kentucky: | 2.1 |
Average number of cars or other vehicles available in apartments:
| Here: | 1.1 |
| Kentucky: | 1.3 |
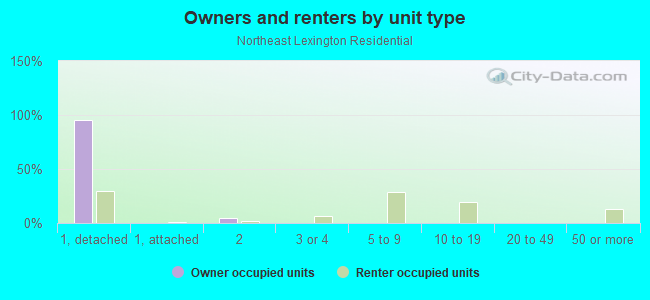
Percentage of units with a mortgage:
| Northeast Lexington Residential: | 92.3% |
| Kentucky: | 56.7% |
Average estimated value of detached houses in 2022 (60.2% of all units):
| Northeast Lexington Residential: | $144,238 |
| Kentucky: | $256,452 |
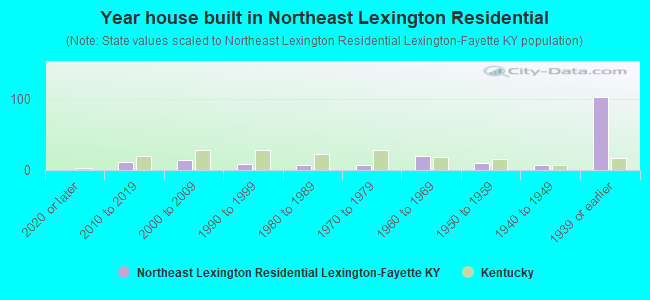
- Year house built in Northeast Lexington Residential
- 02020 or later
- 112010 to 2019
- 142000 to 2009
- 91990 to 1999
- 71980 to 1989
- 71970 to 1979
- 201960 to 1969
- 101950 to 1959
- 71940 to 1949
- 1021939 or earlier
Travel time to work (commute)
![Travel time to work (commute)]()
- 5Less than 5 minutes
- 285 to 9 minutes
- 1710 to 14 minutes
- 3015 to 19 minutes
- 1520 to 24 minutes
- 325 to 29 minutes
- 630 to 34 minutes
- 435 to 39 minutes
- 745 to 59 minutes
- 260 to 89 minutes

Means of transportation to work
![Means of transportation to work]()
- 67.7%110Drove a car alone
- 4.9%8Carpooled
- 1.8%3Bus
- 11.1%18Motorcycle
- 4.9%8Bicycle
- 7.4%12Walked
- 9.9%16Worked at home

Time leaving home to go to work
![Time leaving home to go to work]()
- 412:00 a.m. to 4:59 a.m.
- 45:00 a.m. to 5:29 a.m.
- 55:30 a.m. to 5:59 a.m.
- 66:00 a.m. to 6:29 a.m.
- 56:30 a.m. to 6:59 a.m.
- 97:00 a.m. to 7:29 a.m.
- 217:30 a.m. to 7:59 a.m.
- 168:00 a.m. to 8:29 a.m.
- 138:30 a.m. to 8:59 a.m.
- 129:00 a.m. to 9:59 a.m.
- 410:00 a.m. to 10:59 a.m.
- 311:00 a.m. to 11:59 a.m.
- 712:00 p.m. to 3:59 p.m.
- 24:00 p.m. to 11:59 p.m.

Occupations of males:
- Percentage of males in management occupations (except farmers):
Here: 35.6% Kentucky: 10.7%
- Percentage of males in business and financial operations occupations:
Here: 1.6% Kentucky: 4.0%
- Percentage of males in computer and mathematical occupations:
Here: 3.0% Kentucky: 3.0%
- Percentage of males in architecture and engineering occupations:
Here: 2.5% Kentucky: 2.7%
- Percentage of males in life, physical, and social science occupations:
Here: 1.3% Kentucky: 0.8%
- Percentage of males in community and social services occupations:
Here: 2.7% Kentucky: 1.4%
- Percentage of males in education, training, and library occupations:
Here: 12.4% Kentucky: 2.9%
- Percentage of males in arts, design, entertainment, sports, and media occupations:
Here: 5.9% Kentucky: 1.3%
- Percentage of males in healthcare practitioners and technical occupations:
Here: 1.7% Kentucky: 3.1%
- Percentage of males in service occupations:
Here: 4.8% Kentucky: 12.5%
- Percentage of males in sales and office occupations:
Here: 4.7% Kentucky: 14.0%
- Percentage of males in construction, extraction, and maintenance occupations:
Here: 2.4% Kentucky: 8.7%
- Percentage of males in production occupations:
Here: 11.1% Kentucky: 12.3%
- Percentage of males in transportation occupations:
Here: 1.6% Kentucky: 6.7%
- Percentage of males in material moving occupations:
Here: 5.9% Kentucky: 7.7%
Occupations of females:
- Percentage of females in management occupations (except farmers):
Here: 3.3% Kentucky: 8.4%
- Percentage of females in business and financial operations occupations:
Here: 3.5% Kentucky: 5.3%
- Percentage of females in computer and mathematical occupations:
Here: 7.0% Kentucky: 1.2%
- Percentage of females in architecture and engineering occupations:
Here: 3.3% Kentucky: 0.6%
- Percentage of females in life, physical, and social science occupations:
Here: 3.0% Kentucky: 0.8%
- Percentage of females in community and social services occupations:
Here: 4.9% Kentucky: 2.8%
- Percentage of females in education, training, and library occupations:
Here: 17.4% Kentucky: 9.3%
- Percentage of females in healthcare practitioners and technical occupations:
Here: 15.0% Kentucky: 11.8%
- Percentage of females in service occupations:
Here: 27.1% Kentucky: 19.1%
- Percentage of females in sales and office occupations:
Here: 11.8% Kentucky: 27.8%
- Percentage of females in transportation occupations:
Here: 2.6% Kentucky: 1.1%
- Percentage of females in material moving occupations:
Here: 3.5% Kentucky: 3.2%
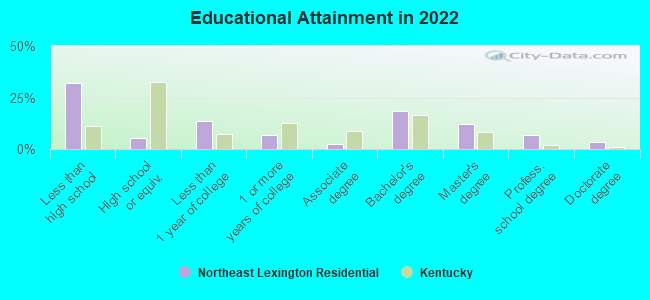
Education in this neighborhood (subdivision or community):
- Percentage of people 3 years and older in K-12 schools:
Northeast Lexington Residential: 26.1% Kentucky: 16.5%
- Percentage of people 3 years and older in undergraduate colleges:
Northeast Lexington Residential: 9.9% Kentucky: 4.1%
- Percentage of people 3 years and older in grad. or professional schools:
Northeast Lexington Residential: 14.2% Kentucky: 1.3%
- Percentage of students K-12 enrolled in private schools:
Northeast Lexington Residential: 15.2% Kentucky: 16.3%
Percentage of population below poverty level:
| Northeast Lexington Residential: | 16.9% |
| Kentucky: | 16.5% |
Median year owner moved in (as recorded in 2022):
Median year renter moved in (as recorded in 2022):
| Northeast Lexington Residential: | 2013 |
| Kentucky: | 2010 |
Median year renter moved in (as recorded in 2022):
| Northeast Lexington Residential: | 2019 |
| Kentucky: | 2020 |
Percentage of married-couple families with both working:
| Northeast Lexington Residential: | 100.0% |
| Kentucky: | 70.7% |
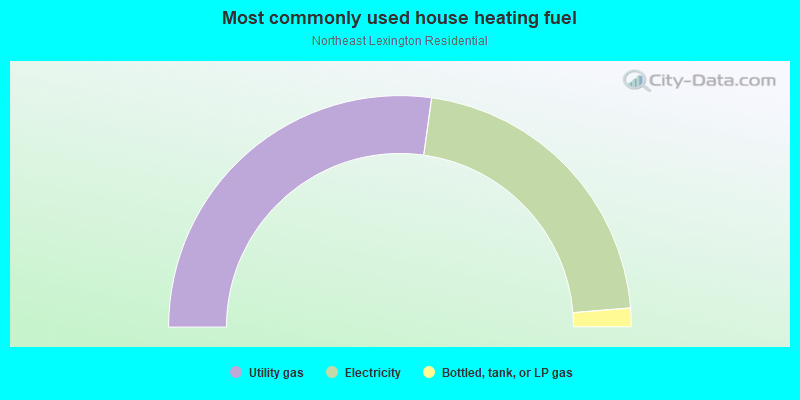
- 54.4%Utility gas
- 43.0%Electricity
- 2.6%Bottled, tank, or LP gas
Roads and streets:
N Martin Luther King Blvd
Length: 0.23 miles
Direction: SW-NE
Address range: 315 to 499
Direction: SW-NE
Address range: 315 to 499
Campsie Pl
Length: 0.18 miles
Directions: SE-NW, SW-NE
Address range: 200 to 399
Directions: SE-NW, SW-NE
Address range: 200 to 399
Kleiser Aly
Length: 0.18 miles
Direction: SW-NE
Address range: 400 to 499
Direction: SW-NE
Address range: 400 to 499
E 5th St
Length: 0.12 miles
Direction: SE-NW
Address range: 114 to 216
Direction: SE-NW
Address range: 114 to 216
E 4th St
Length: 0.12 miles
Direction: SE-NW
Address range: 200 to 241
Direction: SE-NW
Address range: 200 to 241
Wilkerson Aly
Length: 0.09 miles
Direction: SW-NE
Address range: 400 to 499
Direction: SW-NE
Address range: 400 to 499