Norwood Park neighborhood in Des Moines, Iowa (IA), 50314 detailed profile
Settings
X


Business Search - 14 Million verified businesses
Area: 0.043 square miles
Population: 226
Population density:
| Norwood Park: | 5,273 people per square mile |
| Des Moines: | 2,783 people per square mile |

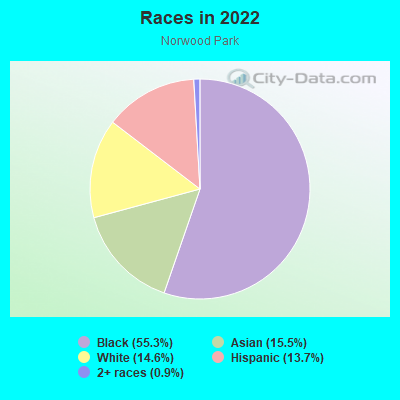
- 12555.3%Black
- 3515.5%Asian
- 3314.6%White
- 3113.7%Hispanic or Latino
- 20.9%Two or more races
Median household income in 2022:
| Norwood Park: | $50,093 |
| Des Moines: | $58,018 |
Distribution of median household income
![Distribution of median household income]()
- 5Less than $10,000
- 21$10,000 to $19,999
- 14$20,000 to $29,999
- 18$30,000 to $39,999
- 10$40,000 to $49,999
- 8$50,000 to $59,999
- 22$60,000 to $74,999
- 6$75,000 to $99,999
- 7$100,000 to $124,999
- 3$125,000 to $149,999
- 3$150,000 to $199,999

Distribution of owner-occupied house/condo value
![Distribution of owner-occupied house/condo value]()
- 10Less than $50,000
- 21$50,000 to $99,999
- 18$100,000 to $149,999
- 14$150,000 to $199,999
- 4$200,000 to $249,999
- 3$250,000 to $299,999

Distribution of rent paid by renters
![Distribution of rent paid by renters]()
- 9$400 to $499
- 13$500 to $599
- 7$600 to $699
- 2$700 to $799
- 6$800 to $899
- 1$900 to $999
- 18$1,000 to $1,249

Median rent in 2022:
| Norwood Park: | $843 |
| Des Moines: | $873 |
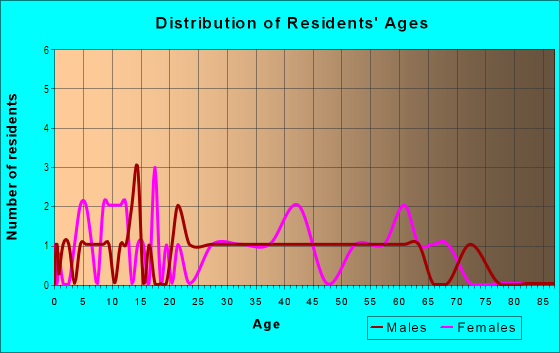
| Males: | 114 |
| Females: | 112 |
Males:
| This neighborhood: | 27.3 years |
| Whole city: | 34.7 years |
| This neighborhood: | 30.5 years |
| Whole city: | 35.5 years |
Average household size:
| Norwood Park: | 2.9 people |
| Des Moines: | 2.2 people |
Percentage of family households:
| Norwood Park: | 60.4% |
| Des Moines: | 40.8% |
| Here: | 37.2% |
| Des Moines: | 32.7% |
Percentage of married-couple families with children (among all households):
| Norwood Park: | 14.9% |
| Des Moines: | 26.2% |
Percentage of single-mother households (among all households):
| Norwood Park: | 25.6% |
| Des Moines: | 14.0% |
Percentage of never married males 15 years old and over:
Percentage of never married females 15 years old and over:
| Norwood Park: | 25.7% |
| Des Moines: | 21.4% |
Percentage of never married females 15 years old and over:
| Norwood Park: | 16.8% |
| city: | 19.3% |
Percentage of people that speak English not well or not at all:
| Norwood Park: | 7.6% |
| Des Moines: | 5.0% |
Percentage of people born in this state:
Percentage of people born in another U.S. state:
Percentage of native residents but born outside the U.S.:
Percentage of foreign born residents:
| Here: | 60.3% |
| Des Moines: | 64.1% |
Percentage of people born in another U.S. state:
| Norwood Park: | 14.9% |
| Des Moines: | 19.2% |
Percentage of native residents but born outside the U.S.:
| Here: | 0.5% |
| city: | 0.5% |
Percentage of foreign born residents:
| Here: | 24.2% |
| Des Moines: | 16.2% |
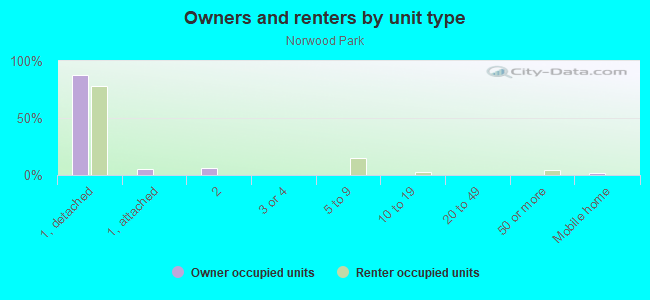
Owner-occupied
Renter-occupied

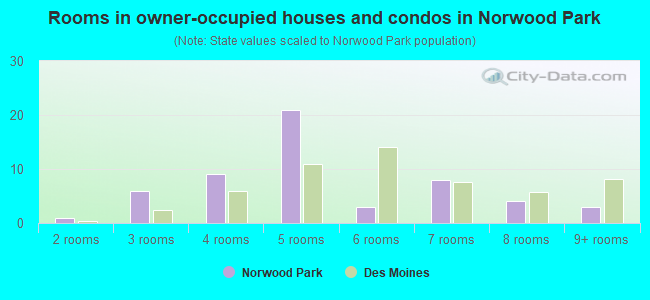
- Rooms in owner-occupied houses and condos in Norwood Park
- 01 room
- 12 rooms
- 63 rooms
- 94 rooms
- 215 rooms
- 36 rooms
- 87 rooms
- 48 rooms
- 39+ rooms
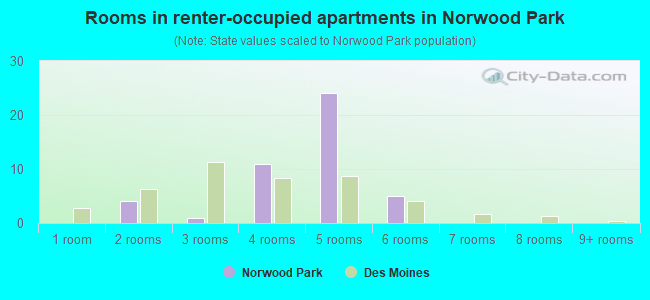
- Rooms in renter-occupied apartments in Norwood Park
- 01 room
- 42 rooms
- 13 rooms
- 114 rooms
- 245 rooms
- 56 rooms
- 07 rooms
- 08 rooms
- 09+ rooms
Owner-occupied
Renter-occupied
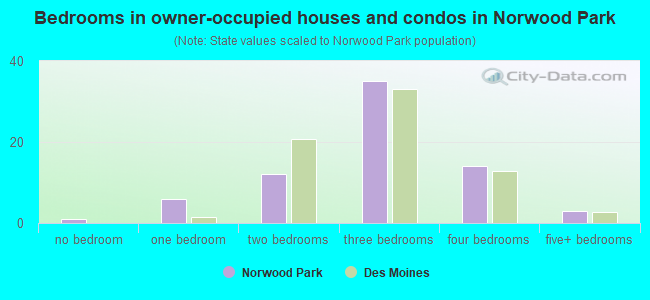
- Bedrooms in owner-occupied houses and condos in Norwood Park
- 1no bedroom
- 61 bedroom
- 122 bedrooms
- 353 bedrooms
- 144 bedrooms
- 35+ bedrooms
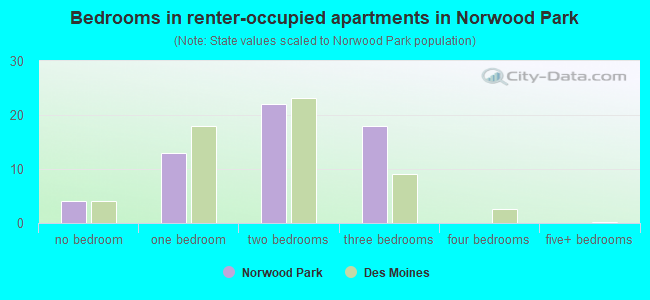
- Bedrooms in renter-occupied apartments in Norwood Park
- 4no bedroom
- 131 bedroom
- 222 bedrooms
- 183 bedrooms
- 04 bedrooms
- 05+ bedrooms
Average number of cars or other vehicles available in houses/condos:
Average number of cars or other vehicles available in apartments:
| This neighborhood: | 1.6 |
| Des Moines: | 1.9 |
Average number of cars or other vehicles available in apartments:
| Here: | 1.5 |
| city: | 1.2 |
Percentage of units with a mortgage:
| Norwood Park: | 78.5% |
| Des Moines: | 69.7% |
Average estimated value of detached houses in 2022 (89.7% of all units):
| Norwood Park: | $116,733 |
| Des Moines: | $201,532 |
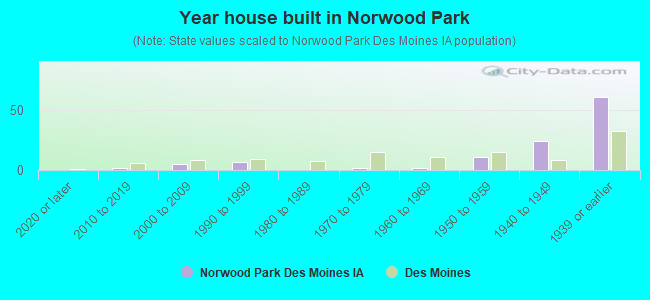
- Year house built in Norwood Park
- 02020 or later
- 22010 to 2019
- 52000 to 2009
- 71990 to 1999
- 01980 to 1989
- 21970 to 1979
- 21960 to 1969
- 111950 to 1959
- 241940 to 1949
- 611939 or earlier
City-data.com crime index for city in 2020 (higher means more crime):
| City: | 422.4 |
| U.S. average: | 219.5 |
Travel time to work (commute)
![Travel time to work (commute)]()
- 2Less than 5 minutes
- 235 to 9 minutes
- 4210 to 14 minutes
- 2715 to 19 minutes
- 1520 to 24 minutes
- 225 to 29 minutes
- 730 to 34 minutes
- 245 to 59 minutes

Means of transportation to work
![Means of transportation to work]()
- 57.8%58Drove a car alone
- 19.9%20Carpooled
- 3.0%3Bus
- 5.0%5Bicycle
- 2.0%2Other means
- 17.9%18Worked at home

Time leaving home to go to work
![Time leaving home to go to work]()
- 412:00 a.m. to 4:59 a.m.
- 45:00 a.m. to 5:29 a.m.
- 35:30 a.m. to 5:59 a.m.
- 76:00 a.m. to 6:29 a.m.
- 86:30 a.m. to 6:59 a.m.
- 187:00 a.m. to 7:29 a.m.
- 157:30 a.m. to 7:59 a.m.
- 58:00 a.m. to 8:29 a.m.
- 48:30 a.m. to 8:59 a.m.
- 89:00 a.m. to 9:59 a.m.
- 810:00 a.m. to 10:59 a.m.
- 311:00 a.m. to 11:59 a.m.
- 2212:00 p.m. to 3:59 p.m.
- 54:00 p.m. to 11:59 p.m.

Occupations of males:
- Percentage of males in management occupations (except farmers):
Here: 2.8% city: 9.3%
- Percentage of males in business and financial operations occupations:
Here: 22.5% city: 5.5%
- Percentage of males in computer and mathematical occupations:
Here: 1.0% city: 6.0%
- Percentage of males in service occupations:
Here: 14.3% city: 13.1%
- Percentage of males in sales and office occupations:
Here: 26.8% city: 15.2%
- Percentage of males in construction, extraction, and maintenance occupations:
Here: 10.5% city: 10.0%
- Percentage of males in transportation occupations:
Here: 10.5% city: 6.3%
- Percentage of males in material moving occupations:
Here: 15.3% city: 7.2%
Occupations of females:
- Percentage of females in management occupations (except farmers):
Here: 26.9% city: 8.5%
- Percentage of females in business and financial operations occupations:
Here: 6.9% city: 7.3%
- Percentage of females in legal occupations:
Here: 3.0% city: 1.3%
- Percentage of females in healthcare practitioners and technical occupations:
Here: 9.8% city: 7.6%
- Percentage of females in service occupations:
Here: 35.8% city: 23.4%
- Percentage of females in sales and office occupations:
Here: 13.2% city: 27.7%
- Percentage of females in farming, fishing, and forestry occupations:
Here: 3.0% city: 0.1%
- Percentage of females in production occupations:
Here: 7.3% city: 5.0%
- Percentage of females in material moving occupations:
Here: 1.1% city: 2.1%
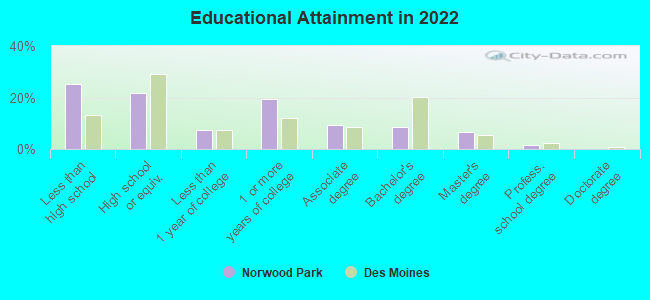
Education in this neighborhood (subdivision or community):
- Percentage of people 3 years and older in K-12 schools:
Norwood Park: 19.0% Des Moines: 17.5%
- Percentage of people 3 years and older in undergraduate colleges:
Norwood Park: 5.8% Des Moines: 3.7%
- Percentage of people 3 years and older in grad. or professional schools:
Norwood Park: 0.0% Des Moines: 1.6%
- Percentage of students K-12 enrolled in private schools:
Norwood Park: 0.0% Des Moines: 6.9%
Percentage of population below poverty level:
| Norwood Park: | 44.3% |
| Des Moines: | 14.7% |
Median year owner moved in (as recorded in 2022):
| Norwood Park: | 2007 |
| Des Moines: | 2011 |
Percentage of married-couple families with both working:
| Norwood Park: | 25.0% |
| Des Moines: | 73.4% |
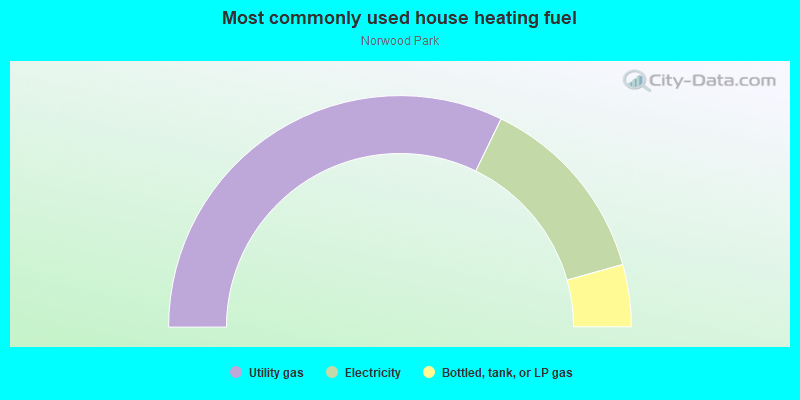
- 64.4%Utility gas
- 26.9%Electricity
- 8.7%Bottled, tank, or LP gas
Roads and streets:
18th St
Length: 0.19 miles
Direction: N-S
Address range: 1900 to 2199
Direction: N-S
Address range: 1900 to 2199
Lincoln Ave
Length: 0.15 miles
Direction: E-W
Address range: 1600 to 1799
Direction: E-W
Address range: 1600 to 1799
Allison Ave
Length: 0.15 miles
Direction: E-W
Address range: 1600 to 1799
Direction: E-W
Address range: 1600 to 1799
Francis Ave
Length: 0.08 miles
Direction: E-W
Address range: 1600 to 1799
Direction: E-W
Address range: 1600 to 1799
16th St
Length: 0.07 miles
Direction: N-S
Address range: 1918 to 2099
Direction: N-S
Address range: 1918 to 2099