Old Forest neighborhood in Lansing, Michigan (MI), 48906, 48915 detailed profile
Settings
X


Business Search - 14 Million verified businesses
Area: 0.325 square miles
Population: 3,841
Population density:
| Old Forest: | 11,823 people per square mile |
| Lansing: | 3,223 people per square mile |

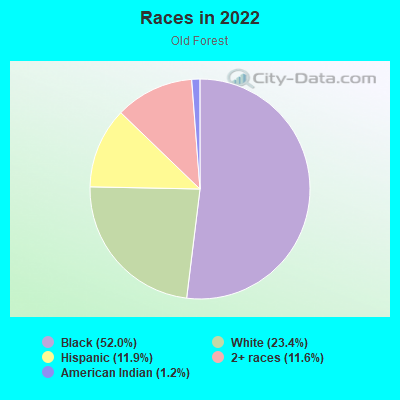
- 2,02052.0%Black
- 90723.4%White
- 46011.9%Hispanic or Latino
- 44911.6%Two or more races
- 451.2%American Indian
Median household income in 2022:
| Old Forest: | $42,992 |
| Lansing: | $48,962 |
Distribution of median household income
![Distribution of median household income]()
- 83Less than $10,000
- 288$10,000 to $19,999
- 255$20,000 to $29,999
- 215$30,000 to $39,999
- 256$40,000 to $49,999
- 246$50,000 to $59,999
- 237$60,000 to $74,999
- 92$75,000 to $99,999
- 74$100,000 to $124,999
- 40$125,000 to $149,999
- 61$200,000 or more

Distribution of owner-occupied house/condo value
![Distribution of owner-occupied house/condo value]()
- 246$50,000 to $99,999
- 58$100,000 to $149,999
- 25$150,000 to $199,999
- 26$200,000 to $249,999
- 84$300,000 to $399,999

Distribution of rent paid by renters
![Distribution of rent paid by renters]()
- 116$100 to $199
- 93$300 to $399
- 253$400 to $499
- 206$500 to $599
- 78$600 to $699
- 355$700 to $799
- 282$800 to $899
- 101$900 to $999
- 234$1,000 to $1,249
- 28$1,250 to $1,499
- 25$1,500 to $1,999

Median rent in 2022:
| Old Forest: | $799 |
| Lansing: | $773 |
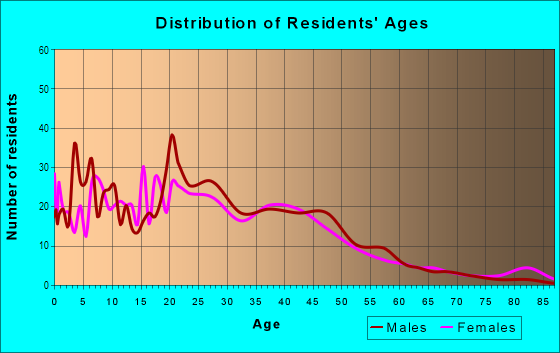
| Males: | 1,785 |
| Females: | 2,056 |
Males:
| This neighborhood: | 29.0 years |
| Whole city: | 33.0 years |
| This neighborhood: | 23.5 years |
| Whole city: | 34.5 years |
Average household size:
| Old Forest: | 2.4 people |
| Lansing: | 2.1 people |
Percentage of family households:
| Old Forest: | 46.0% |
| Lansing: | 33.9% |
| Here: | 10.2% |
| Lansing: | 27.4% |
Percentage of married-couple families with children (among all households):
| Old Forest: | 24.0% |
| Lansing: | 23.0% |
Percentage of single-mother households (among all households):
| Old Forest: | 18.3% |
| Lansing: | 14.1% |
Percentage of never married males 15 years old and over:
Percentage of never married females 15 years old and over:
| Old Forest: | 37.7% |
| Lansing: | 24.9% |
Percentage of never married females 15 years old and over:
| Old Forest: | 35.1% |
| city: | 21.6% |
Percentage of people that speak English not well or not at all:
| Old Forest: | 0.0% |
| Lansing: | 2.3% |
Percentage of people born in this state:
Percentage of people born in another U.S. state:
Percentage of native residents but born outside the U.S.:
Percentage of foreign born residents:
| Here: | 62.7% |
| Lansing: | 72.5% |
Percentage of people born in another U.S. state:
| Old Forest: | 17.5% |
| Lansing: | 19.1% |
Percentage of native residents but born outside the U.S.:
| Here: | 0.3% |
| city: | 0.8% |
Percentage of foreign born residents:
| Here: | 19.5% |
| Lansing: | 7.6% |
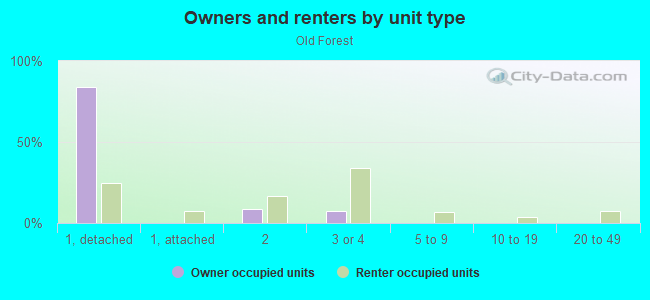
Owner-occupied
Renter-occupied

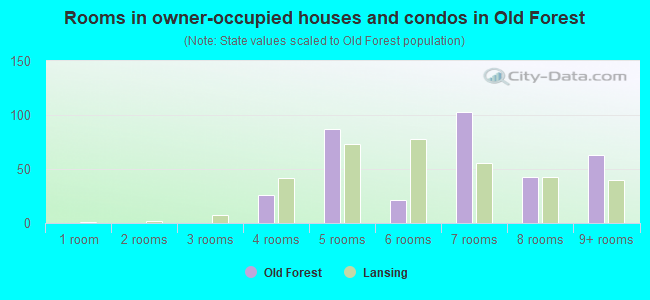
- Rooms in owner-occupied houses and condos in Old Forest
- 01 room
- 02 rooms
- 03 rooms
- 264 rooms
- 875 rooms
- 216 rooms
- 1037 rooms
- 438 rooms
- 639+ rooms
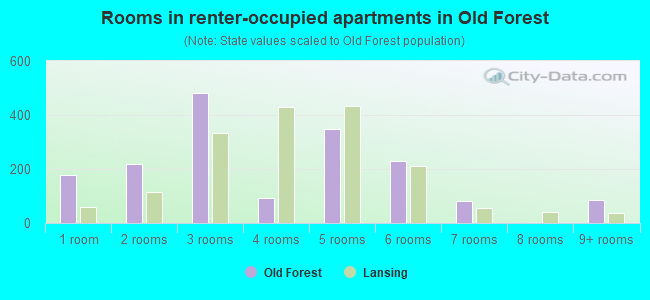
- Rooms in renter-occupied apartments in Old Forest
- 1771 room
- 2202 rooms
- 4803 rooms
- 924 rooms
- 3475 rooms
- 2286 rooms
- 817 rooms
- 08 rooms
- 869+ rooms
Owner-occupied
Renter-occupied
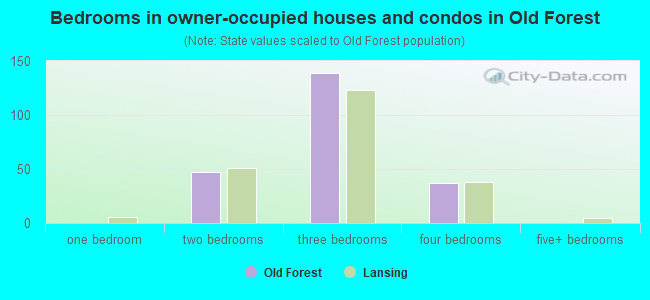
- Bedrooms in owner-occupied houses and condos in Old Forest
- 0no bedroom
- 01 bedroom
- 472 bedrooms
- 1393 bedrooms
- 374 bedrooms
- 05+ bedrooms
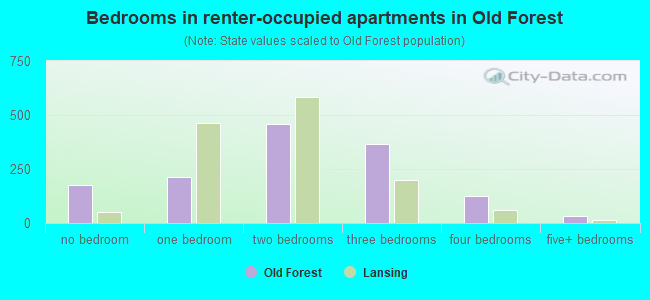
- Bedrooms in renter-occupied apartments in Old Forest
- 177no bedroom
- 2131 bedroom
- 4572 bedrooms
- 3653 bedrooms
- 1274 bedrooms
- 325+ bedrooms
Average number of cars or other vehicles available in houses/condos:
Average number of cars or other vehicles available in apartments:
| This neighborhood: | 1.5 |
| Lansing: | 1.7 |
Average number of cars or other vehicles available in apartments:
| Here: | 0.9 |
| city: | 1.1 |
Percentage of units with a mortgage:
| Old Forest: | 83.7% |
| Lansing: | 65.6% |
Average estimated value of detached houses in 2022 (43.8% of all units):
| Old Forest: | $108,761 |
| Lansing: | $121,378 |
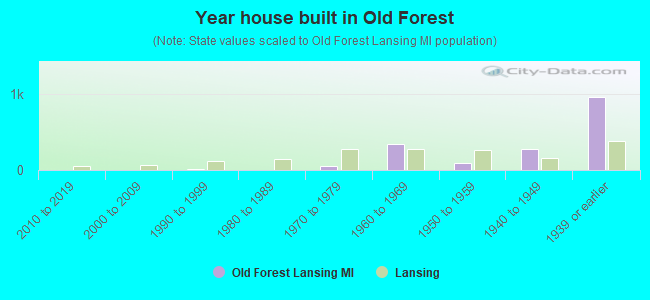
- Year house built in Old Forest
- 02020 or later
- 02010 to 2019
- 02000 to 2009
- 151990 to 1999
- 01980 to 1989
- 461970 to 1979
- 3391960 to 1969
- 971950 to 1959
- 2771940 to 1949
- 9521939 or earlier
City-data.com crime index for city in 2020 (higher means more crime):
| City: | 553.0 |
| U.S. average: | 219.5 |
Travel time to work (commute)
![Travel time to work (commute)]()
- 68Less than 5 minutes
- 885 to 9 minutes
- 23110 to 14 minutes
- 22615 to 19 minutes
- 15720 to 24 minutes
- 5825 to 29 minutes
- 10930 to 34 minutes
- 5435 to 39 minutes
- 740 to 44 minutes
- 10045 to 59 minutes
- 3760 to 89 minutes
- 790 or more minutes

Means of transportation to work
![Means of transportation to work]()
- 45.3%771Drove a car alone
- 14.4%246Carpooled
- 4.3%73Bus
- 0.2%3Bicycle
- 33.8%576Walked
- 0.2%3Other means
- 19.0%324Worked at home

Time leaving home to go to work
![Time leaving home to go to work]()
- 8412:00 a.m. to 4:59 a.m.
- 555:30 a.m. to 5:59 a.m.
- 1096:00 a.m. to 6:29 a.m.
- 466:30 a.m. to 6:59 a.m.
- 977:00 a.m. to 7:29 a.m.
- 897:30 a.m. to 7:59 a.m.
- 1208:00 a.m. to 8:29 a.m.
- 1128:30 a.m. to 8:59 a.m.
- 1079:00 a.m. to 9:59 a.m.
- 5210:00 a.m. to 10:59 a.m.
- 6312:00 p.m. to 3:59 p.m.
- 1744:00 p.m. to 11:59 p.m.

Occupations of males:
- Percentage of males in business and financial operations occupations:
Here: 1.8% city: 4.1%
- Percentage of males in computer and mathematical occupations:
Here: 23.9% city: 6.1%
- Percentage of males in community and social services occupations:
Here: 3.7% city: 1.5%
- Percentage of males in education, training, and library occupations:
Here: 10.0% city: 4.9%
- Percentage of males in service occupations:
Here: 10.3% city: 17.2%
- Percentage of males in sales and office occupations:
Here: 9.9% city: 13.3%
- Percentage of males in construction, extraction, and maintenance occupations:
Here: 8.2% city: 6.5%
- Percentage of males in production occupations:
Here: 5.4% city: 9.4%
- Percentage of males in transportation occupations:
Here: 12.1% city: 6.7%
- Percentage of males in material moving occupations:
Here: 13.4% city: 8.5%
Occupations of females:
- Percentage of females in management occupations (except farmers):
Here: 12.7% city: 6.9%
- Percentage of females in business and financial operations occupations:
Here: 2.0% city: 6.7%
- Percentage of females in computer and mathematical occupations:
Here: 1.8% city: 2.4%
- Percentage of females in architecture and engineering occupations:
Here: 1.6% city: 0.7%
- Percentage of females in life, physical, and social science occupations:
Here: 1.2% city: 1.6%
- Percentage of females in community and social services occupations:
Here: 1.2% city: 2.9%
- Percentage of females in education, training, and library occupations:
Here: 16.2% city: 8.7%
- Percentage of females in service occupations:
Here: 30.4% city: 25.0%
- Percentage of females in sales and office occupations:
Here: 14.3% city: 25.9%
- Percentage of females in production occupations:
Here: 9.7% city: 5.6%
- Percentage of females in transportation occupations:
Here: 7.7% city: 1.5%
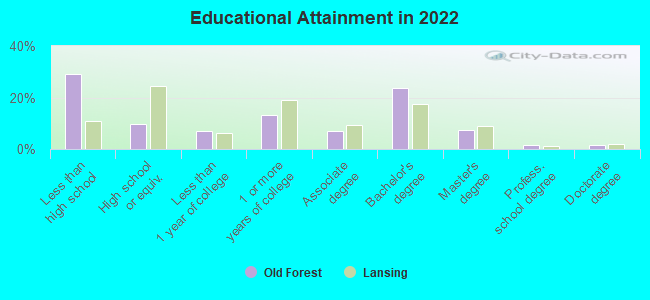
Education in this neighborhood (subdivision or community):
- Percentage of people 3 years and older in K-12 schools:
Old Forest: 37.4% Lansing: 14.3%
- Percentage of people 3 years and older in undergraduate colleges:
Old Forest: 18.9% Lansing: 4.6%
- Percentage of people 3 years and older in grad. or professional schools:
Old Forest: 5.7% Lansing: 2.6%
- Percentage of students K-12 enrolled in private schools:
Old Forest: 4.3% Lansing: 7.9%
Percentage of population below poverty level:
| Old Forest: | 43.0% |
| Lansing: | 22.2% |
Median year owner moved in (as recorded in 2022):
Median year renter moved in (as recorded in 2022):
| Old Forest: | 2002 |
| Lansing: | 2012 |
Median year renter moved in (as recorded in 2022):
| Old Forest: | 2016 |
| Lansing: | 2020 |
Percentage of married-couple families with both working:
| Old Forest: | 104.4% |
| Lansing: | 59.6% |
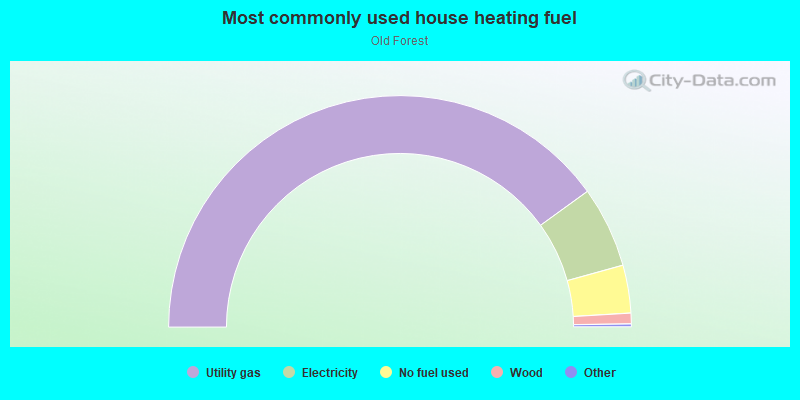
- 80.0%Utility gas
- 11.3%Electricity
- 6.7%No fuel used
- 1.5%Wood
Highways in this neighborhood:
W Oakland Rd (I- 69 Bus, State Hwy 43)
Length: 0.83 miles
Direction: E-W
Address range: 300 to 999
Direction: E-W
Address range: 300 to 999
Roads and streets:
W Willow St
Length: 0.55 miles
Direction: E-W
Address range: 300 to 999
Direction: E-W
Address range: 300 to 999
N Pine St
Length: 0.54 miles
Direction: N-S
Address range: 700 to 1299
Direction: N-S
Address range: 700 to 1299
N Chestnut St
Length: 0.54 miles
Direction: N-S
Address range: 700 to 1299
Direction: N-S
Address range: 700 to 1299
N Walnut St
Length: 0.54 miles
Direction: N-S
Address range: 700 to 1299
Direction: N-S
Address range: 700 to 1299
W Maple St
Length: 0.50 miles
Direction: E-W
Address range: 300 to 799
Direction: E-W
Address range: 300 to 799
Princeton Ave
Length: 0.47 miles
Direction: N-S
Address range: 710 to 1299
Direction: N-S
Address range: 710 to 1299
W Madison St
Length: 0.44 miles
Direction: E-W
Address range: 300 to 699
Direction: E-W
Address range: 300 to 699
W Grand River Ave
Length: 0.32 miles
Direction: E-W
Address range: 300 to 599
Direction: E-W
Address range: 300 to 599
W Kilborn St
Length: 0.31 miles
Direction: E-W
Address range: 300 to 599
Direction: E-W
Address range: 300 to 599
Seymour Ave
Length: 0.27 miles
Direction: N-S
Address range: 800 to 1099
Direction: N-S
Address range: 800 to 1099
Daleford Ave
Length: 0.24 miles
Direction: E-W
Address range: 700 to 913
Direction: E-W
Address range: 700 to 913
Englewood Ct
Length: 0.23 miles
Direction: E-W
Address range: 700 to 999
Direction: E-W
Address range: 700 to 999
Edgewood Ct
Length: 0.21 miles
Direction: N-S
Address range: 700 to 999
Direction: N-S
Address range: 700 to 999
Wisconsin Ave
Length: 0.21 miles
Direction: N-S
Address range: 712 to 999
Direction: N-S
Address range: 712 to 999
Chicago Ave
Length: 0.21 miles
Direction: N-S
Address range: 710 to 999
Direction: N-S
Address range: 710 to 999
Summerville Ave
Length: 0.21 miles
Direction: N-S
Address range: 700 to 999
Direction: N-S
Address range: 700 to 999
N Sycamore St
Length: 0.20 miles
Direction: N-S
Address range: 800 to 999
Direction: N-S
Address range: 800 to 999
Brook St
Length: 0.17 miles
Direction: E-W
Address range: 600 to 799
Direction: E-W
Address range: 600 to 799
Bluff St
Length: 0.12 miles
Direction: E-W
Address range: 600 to 699
Direction: E-W
Address range: 600 to 699
State St
Length: 0.11 miles
Directions: N-S, SW-NE
Address range: 900 to 1099
Directions: N-S, SW-NE
Address range: 900 to 1099
Leonard Ct
Length: 0.10 miles
Direction: N-S
Address range: 800 to 915
Direction: N-S
Address range: 800 to 915
N Grand River Ave
Length: 0.09 miles
Direction: N-S
Address range: 1200 to 1299
Direction: N-S
Address range: 1200 to 1299
Lawler Ct
Length: 0.07 miles
Direction: E-W
Address range: 1 to 99
Direction: E-W
Address range: 1 to 99
Daleford St
Length: 0.06 miles
Direction: E-W
Address range: 900 to 1013
Direction: E-W
Address range: 900 to 1013