Old Northside neighborhood in Indianapolis, Indiana (IN), 46202 detailed profile
Settings
X


Business Search - 14 Million verified businesses
Area: 0.327 square miles
Population: 5,040
Population density:
| Old Northside: | 15,418 people per square mile |
| Indianapolis: | 2,425 people per square mile |

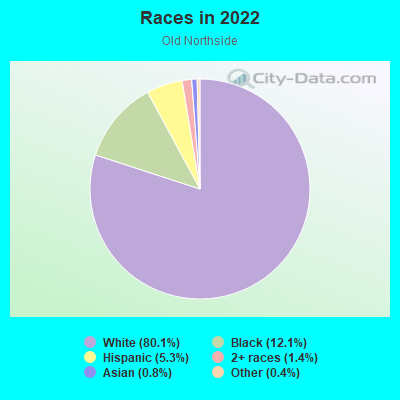
- 4,05180.1%White
- 61012.1%Black
- 2675.3%Hispanic or Latino
- 721.4%Two or more races
- 380.8%Asian
- 220.4%Some other race
Median household income in 2022:
| Old Northside: | $80,969 |
| Indianapolis: | $61,501 |
Distribution of median household income
![Distribution of median household income]()
- 124Less than $10,000
- 146$10,000 to $19,999
- 170$20,000 to $29,999
- 94$30,000 to $39,999
- 149$40,000 to $49,999
- 191$50,000 to $59,999
- 259$60,000 to $74,999
- 514$75,000 to $99,999
- 34$100,000 to $124,999
- 162$125,000 to $149,999
- 336$150,000 to $199,999
- 259$200,000 or more

Distribution of owner-occupied house/condo value
![Distribution of owner-occupied house/condo value]()
- 90Less than $50,000
- 131$50,000 to $99,999
- 40$100,000 to $149,999
- 344$150,000 to $199,999
- 8$200,000 to $249,999
- 34$250,000 to $299,999
- 43$300,000 to $399,999
- 314$400,000 to $499,999
- 327$500,000 to $749,999
- 230$750,000 to $999,999

Distribution of rent paid by renters
![Distribution of rent paid by renters]()
- 69$100 to $199
- 13$200 to $299
- 89$300 to $399
- 7$400 to $499
- 23$500 to $599
- 174$600 to $699
- 167$700 to $799
- 119$800 to $899
- 162$900 to $999
- 378$1,000 to $1,249
- 34$1,250 to $1,499
- 34$1,500 to $1,999
- 43$2,000 or more

Median rent in 2022:
| Old Northside: | $976 |
| Indianapolis: | $846 |
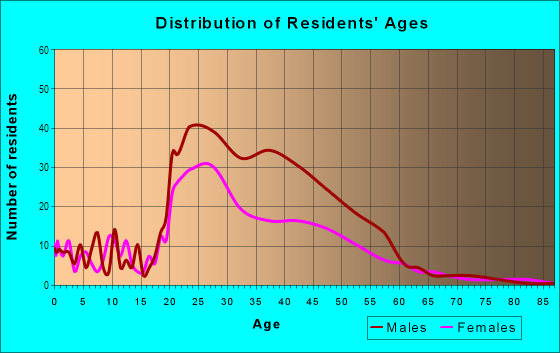
| Males: | 2,668 |
| Females: | 2,371 |
Males:
| This neighborhood: | 41.2 years |
| Whole city: | 32.9 years |
| This neighborhood: | 37.8 years |
| Whole city: | 35.4 years |
Average household size:
| Old Northside: | 1.9 people |
| Indianapolis: | 2.3 people |
Percentage of family households:
| Old Northside: | 29.9% |
| Indianapolis: | 42.9% |
| Here: | 39.9% |
| Indianapolis: | 37.4% |
Percentage of married-couple families with children (among all households):
| Old Northside: | 42.4% |
| Indianapolis: | 26.5% |
Percentage of single-mother households (among all households):
| Old Northside: | 4.1% |
| Indianapolis: | 12.9% |
Percentage of never married males 15 years old and over:
Percentage of never married females 15 years old and over:
| Old Northside: | 29.3% |
| Indianapolis: | 19.9% |
Percentage of never married females 15 years old and over:
| Old Northside: | 14.5% |
| city: | 19.2% |
Percentage of people that speak English not well or not at all:
| Old Northside: | 0.0% |
| Indianapolis: | 4.2% |
Percentage of people born in this state:
Percentage of people born in another U.S. state:
Percentage of native residents but born outside the U.S.:
Percentage of foreign born residents:
| Here: | 61.2% |
| Indianapolis: | 63.1% |
Percentage of people born in another U.S. state:
| Old Northside: | 34.5% |
| Indianapolis: | 23.6% |
Percentage of native residents but born outside the U.S.:
| Here: | 0.8% |
| city: | 1.1% |
Percentage of foreign born residents:
| Here: | 3.7% |
| Indianapolis: | 12.2% |
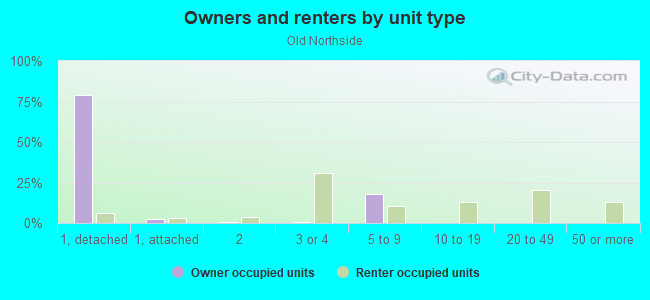
Owner-occupied
Renter-occupied

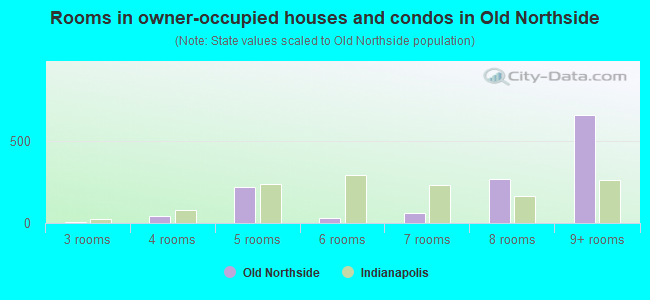
- Rooms in owner-occupied houses and condos in Old Northside
- 51 room
- 02 rooms
- 63 rooms
- 424 rooms
- 2205 rooms
- 336 rooms
- 637 rooms
- 2678 rooms
- 6619+ rooms
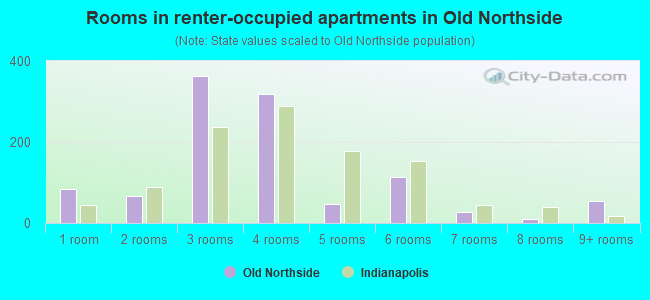
- Rooms in renter-occupied apartments in Old Northside
- 841 room
- 672 rooms
- 3643 rooms
- 3184 rooms
- 465 rooms
- 1146 rooms
- 277 rooms
- 118 rooms
- 559+ rooms
Owner-occupied
Renter-occupied
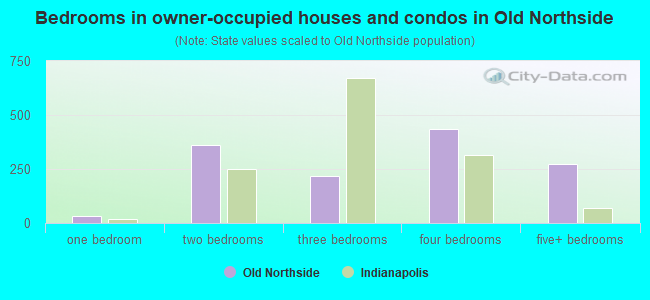
- Bedrooms in owner-occupied houses and condos in Old Northside
- 5no bedroom
- 341 bedroom
- 3602 bedrooms
- 2163 bedrooms
- 4374 bedrooms
- 2755+ bedrooms
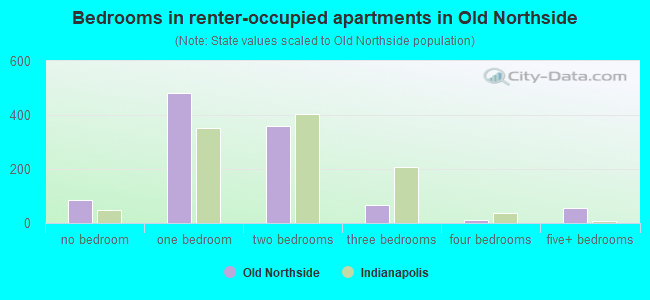
- Bedrooms in renter-occupied apartments in Old Northside
- 84no bedroom
- 4831 bedroom
- 3602 bedrooms
- 673 bedrooms
- 114 bedrooms
- 555+ bedrooms
Average number of cars or other vehicles available in houses/condos:
Average number of cars or other vehicles available in apartments:
| This neighborhood: | 2.1 |
| Indianapolis: | 2.0 |
Average number of cars or other vehicles available in apartments:
| Here: | 1.0 |
| city: | 1.2 |
Percentage of units with a mortgage:
| Old Northside: | 78.0% |
| Indianapolis: | 68.8% |
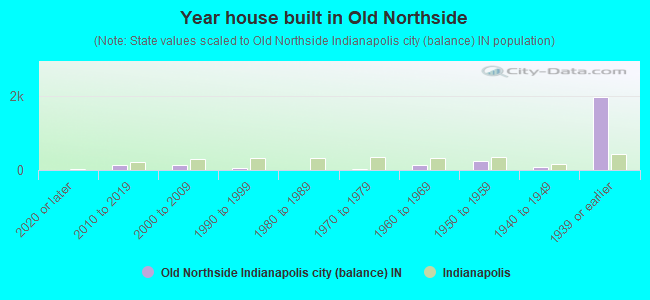
- Year house built in Old Northside
- 92020 or later
- 1402010 to 2019
- 1272000 to 2009
- 631990 to 1999
- 81980 to 1989
- 201970 to 1979
- 1351960 to 1969
- 2581950 to 1959
- 691940 to 1949
- 1,9771939 or earlier
City-data.com crime index for city in 2020 (higher means more crime):
| City: | 465.4 |
| U.S. average: | 219.5 |
Travel time to work (commute)
![Travel time to work (commute)]()
- 31Less than 5 minutes
- 1795 to 9 minutes
- 30210 to 14 minutes
- 16715 to 19 minutes
- 14820 to 24 minutes
- 12625 to 29 minutes
- 7230 to 34 minutes
- 2435 to 39 minutes
- 140 to 44 minutes
- 7245 to 59 minutes
- 6160 to 89 minutes
- 2690 or more minutes

Means of transportation to work
![Means of transportation to work]()
- 74.6%2,405Drove a car alone
- 3.5%114Carpooled
- 4.2%135Bus
- 1.4%46Bicycle
- 1.4%46Walked
- 0.4%12Other means
- 14.7%475Worked at home

Time leaving home to go to work
![Time leaving home to go to work]()
- 5012:00 a.m. to 4:59 a.m.
- 365:30 a.m. to 5:59 a.m.
- 806:00 a.m. to 6:29 a.m.
- 656:30 a.m. to 6:59 a.m.
- 1977:00 a.m. to 7:29 a.m.
- 1067:30 a.m. to 7:59 a.m.
- 1418:00 a.m. to 8:29 a.m.
- 1068:30 a.m. to 8:59 a.m.
- 1039:00 a.m. to 9:59 a.m.
- 7810:00 a.m. to 10:59 a.m.
- 2111:00 a.m. to 11:59 a.m.
- 5712:00 p.m. to 3:59 p.m.
- 944:00 p.m. to 11:59 p.m.

Occupations of males:
- Percentage of males in management occupations (except farmers):
Here: 27.1% city: 10.3%
- Percentage of males in business and financial operations occupations:
Here: 6.3% city: 5.4%
- Percentage of males in computer and mathematical occupations:
Here: 2.5% city: 4.6%
- Percentage of males in architecture and engineering occupations:
Here: 1.0% city: 2.6%
- Percentage of males in life, physical, and social science occupations:
Here: 2.5% city: 1.0%
- Percentage of males in education, training, and library occupations:
Here: 9.8% city: 2.8%
- Percentage of males in arts, design, entertainment, sports, and media occupations:
Here: 2.0% city: 1.9%
- Percentage of males in healthcare practitioners and technical occupations:
Here: 2.2% city: 2.7%
- Percentage of males in service occupations:
Here: 18.3% city: 12.5%
- Percentage of males in sales and office occupations:
Here: 27.1% city: 15.6%
- Percentage of males in production occupations:
Here: 2.2% city: 9.0%
- Percentage of males in transportation occupations:
Here: 2.8% city: 6.4%
Occupations of females:
- Percentage of females in management occupations (except farmers):
Here: 12.1% city: 8.6%
- Percentage of females in business and financial operations occupations:
Here: 8.0% city: 6.9%
- Percentage of females in life, physical, and social science occupations:
Here: 1.3% city: 1.2%
- Percentage of females in community and social services occupations:
Here: 15.7% city: 2.8%
- Percentage of females in legal occupations:
Here: 2.6% city: 1.3%
- Percentage of females in education, training, and library occupations:
Here: 8.0% city: 7.5%
- Percentage of females in arts, design, entertainment, sports, and media occupations:
Here: 3.5% city: 2.1%
- Percentage of females in healthcare practitioners and technical occupations:
Here: 21.1% city: 10.8%
- Percentage of females in service occupations:
Here: 16.3% city: 18.5%
- Percentage of females in sales and office occupations:
Here: 12.8% city: 26.4%
- Percentage of females in transportation occupations:
Here: 1.9% city: 1.2%
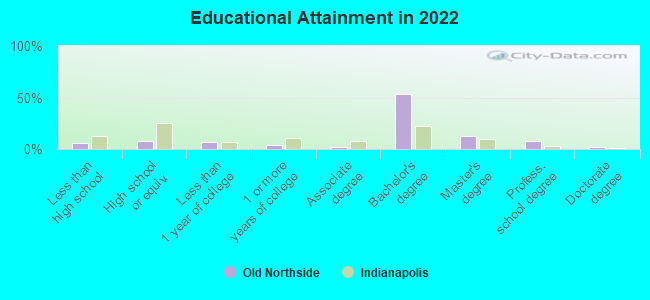
Education in this neighborhood (subdivision or community):
- Percentage of people 3 years and older in K-12 schools:
Old Northside: 15.6% Indianapolis: 17.3%
- Percentage of people 3 years and older in undergraduate colleges:
Old Northside: 2.9% Indianapolis: 4.5%
- Percentage of people 3 years and older in grad. or professional schools:
Old Northside: 3.7% Indianapolis: 1.9%
- Percentage of students K-12 enrolled in private schools:
Old Northside: 16.0% Indianapolis: 14.8%
Percentage of population below poverty level:
| Old Northside: | 17.3% |
| Indianapolis: | 15.9% |
Median year owner moved in (as recorded in 2022):
Median year renter moved in (as recorded in 2022):
| Old Northside: | 2011 |
| Indianapolis: | 2012 |
Median year renter moved in (as recorded in 2022):
| Old Northside: | 2019 |
| Indianapolis: | 2020 |
Percentage of married-couple families with both working:
| Old Northside: | 100.0% |
| Indianapolis: | 72.1% |
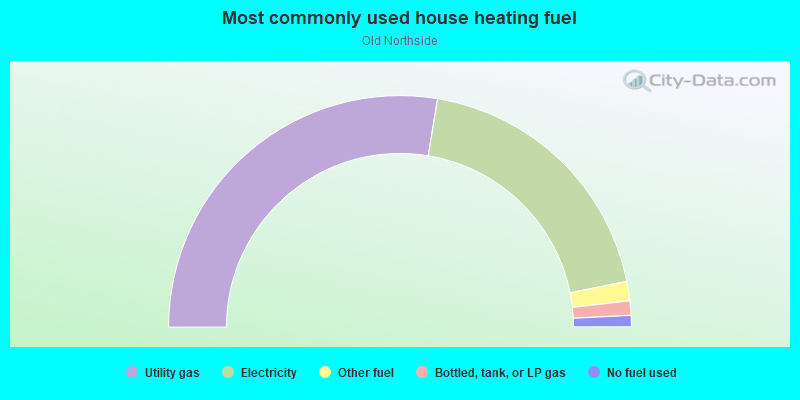
- 55.2%Utility gas
- 38.5%Electricity
- 2.7%Other fuel
- 2.0%Bottled, tank, or LP gas
- 1.6%No fuel used
Limited-access highways (interstate or state) in this neighborhood:
I- 65
Length: 1.80 miles
Directions: E-W, SW-NE
Directions: E-W, SW-NE
I- 70
Length: 0.39 miles
Directions: E-W, N-S, SW-NE
Directions: E-W, N-S, SW-NE
Roads and streets:
E 15th St
Length: 0.81 miles
Directions: E-W, SW-NE
Address range: 200 to 899
Directions: E-W, SW-NE
Address range: 200 to 899
E 13th St
Length: 0.77 miles
Direction: E-W
Address range: 100 to 699
Direction: E-W
Address range: 100 to 699
E 14th St
Length: 0.76 miles
Direction: E-W
Address range: 100 to 799
Direction: E-W
Address range: 100 to 799
E 12th St
Length: 0.43 miles
Direction: E-W
Address range: 200 to 599
Direction: E-W
Address range: 200 to 599
Hudson St
Length: 0.39 miles
Directions: E-W, N-S
Address range: 1100 to 1499
Directions: E-W, N-S
Address range: 1100 to 1499
N Alabama St
Length: 0.38 miles
Direction: N-S
Address range: 1140 to 1547
Direction: N-S
Address range: 1140 to 1547
N Delaware St
Length: 0.35 miles
Direction: N-S
Address range: 1100 to 1499
Direction: N-S
Address range: 1100 to 1499
Central Ave
Length: 0.34 miles
Direction: N-S
Address range: 1166 to 1599
Direction: N-S
Address range: 1166 to 1599
N Ogden St
Length: 0.34 miles
Direction: N-S
Address range: 1200 to 1499
Direction: N-S
Address range: 1200 to 1499
N Talbott St
Length: 0.32 miles
Direction: N-S
Address range: 1200 to 1599
Direction: N-S
Address range: 1200 to 1599
Peck St
Length: 0.31 miles
Direction: N-S
Address range: 1200 to 1499
Direction: N-S
Address range: 1200 to 1499
N New Jersey St
Length: 0.31 miles
Direction: N-S
Address range: 1200 to 1499
Direction: N-S
Address range: 1200 to 1499
N College Ave
Length: 0.26 miles
Direction: N-S
Address range: 1200 to 1499
Direction: N-S
Address range: 1200 to 1499
N Park Ave
Length: 0.25 miles
Direction: N-S
Address range: 1200 to 1499
Direction: N-S
Address range: 1200 to 1499
N Pennsylvania St
Length: 0.23 miles
Direction: N-S
Address range: 1102 to 1406
Direction: N-S
Address range: 1102 to 1406
Broadway St (N Broadway)
Length: 0.22 miles
Direction: N-S
Address range: 1200 to 1499
Direction: N-S
Address range: 1200 to 1499
E Alley 1250 N
Length: 0.17 miles
Direction: E-W
Direction: E-W
Lewis St
Length: 0.17 miles
Direction: N-S
Address range: 1300 to 1499
Direction: N-S
Address range: 1300 to 1499
N Alley 550 E
Length: 0.09 miles
Direction: N-S
Direction: N-S
Myron St
Length: 0.08 miles
Direction: N-S
Direction: N-S
E Alley 1550 N
Length: 0.07 miles
Direction: E-W
Direction: E-W
E Alley 1200 N
Length: 0.06 miles
Direction: E-W
Direction: E-W
Carrollton Ave
Length: 0.05 miles
Direction: N-S
Address range: 1400 to 1499
Direction: N-S
Address range: 1400 to 1499
N Alley 250 E
Length: 0.03 miles
Directions: N-S, SW-NE
Directions: N-S, SW-NE
N Alley 675 E
Length: 0.03 miles
Direction: N-S
Direction: N-S
Railroad features:
Csx RR (Louisville and Nashville RR)
Length: 0.15 miles
Direction: N-S
Direction: N-S