Old Town neighborhood in Arlington, Texas (TX), 76011 detailed profile
Settings
X


Business Search - 14 Million verified businesses
Area: 0.250 square miles
Population: 1,095
Population density:
| Old Town: | 4,376 people per square mile |
| Arlington: | 4,118 people per square mile |

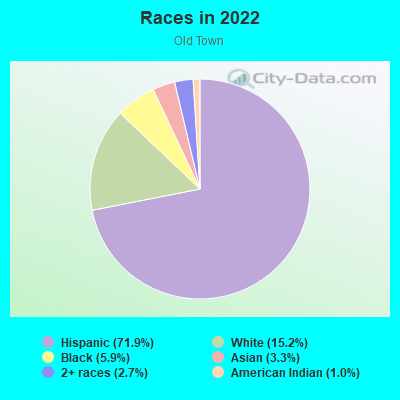
- 82971.9%Hispanic or Latino
- 17515.2%White
- 685.9%Black
- 383.3%Asian
- 312.7%Two or more races
- 121.0%American Indian
Median household income in 2022:
| Old Town: | $41,285 |
| Arlington: | $70,433 |
Distribution of median household income
![Distribution of median household income]()
- 30Less than $10,000
- 54$10,000 to $19,999
- 67$20,000 to $29,999
- 85$30,000 to $39,999
- 50$40,000 to $49,999
- 34$50,000 to $59,999
- 29$60,000 to $74,999
- 27$75,000 to $99,999
- 26$100,000 to $124,999
- 26$125,000 to $149,999
- 13$150,000 to $199,999
- 5$200,000 or more

Distribution of owner-occupied house/condo value
![Distribution of owner-occupied house/condo value]()
- 30Less than $50,000
- 50$50,000 to $99,999
- 29$100,000 to $149,999
- 22$150,000 to $199,999
- 24$200,000 to $249,999
- 6$250,000 to $299,999
- 4$300,000 to $399,999
- 8$400,000 to $499,999
- 5$500,000 to $749,999

Distribution of rent paid by renters
![Distribution of rent paid by renters]()
- 11$200 to $299
- 51$300 to $399
- 24$400 to $499
- 30$500 to $599
- 14$600 to $699
- 44$700 to $799
- 50$800 to $899
- 43$900 to $999
- 93$1,000 to $1,249
- 12$1,250 to $1,499
- 47$1,500 to $1,999
- 12$2,000 or more

Median rent in 2022:
| Old Town: | $916 |
| Arlington: | $1,162 |
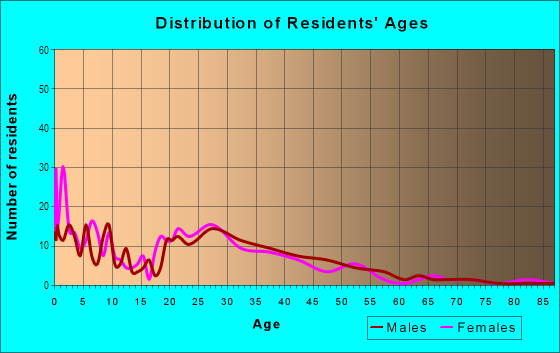
| Males: | 606 |
| Females: | 489 |
Males:
| This neighborhood: | 32.2 years |
| Whole city: | 32.2 years |
| This neighborhood: | 27.1 years |
| Whole city: | 33.4 years |
Average household size:
| Old Town: | 15.9 people |
| Arlington: | 2.8 people |
Percentage of family households:
| Old Town: | 50.9% |
| Arlington: | 49.5% |
| Here: | 28.8% |
| Arlington: | 43.9% |
Percentage of married-couple families with children (among all households):
| Old Town: | 16.2% |
| Arlington: | 23.1% |
Percentage of single-mother households (among all households):
| Old Town: | 8.0% |
| Arlington: | 8.5% |
Percentage of never married males 15 years old and over:
Percentage of never married females 15 years old and over:
| Old Town: | 22.9% |
| Arlington: | 20.6% |
Percentage of never married females 15 years old and over:
| Old Town: | 17.7% |
| city: | 19.7% |
Percentage of people that speak English not well or not at all:
| Old Town: | 22.5% |
| Arlington: | 6.6% |
Percentage of people born in this state:
Percentage of people born in another U.S. state:
Percentage of native residents but born outside the U.S.:
Percentage of foreign born residents:
| Here: | 41.2% |
| Arlington: | 50.9% |
Percentage of people born in another U.S. state:
| Old Town: | 17.4% |
| Arlington: | 25.9% |
Percentage of native residents but born outside the U.S.:
| Here: | 3.6% |
| city: | 1.9% |
Percentage of foreign born residents:
| Here: | 37.7% |
| Arlington: | 21.3% |
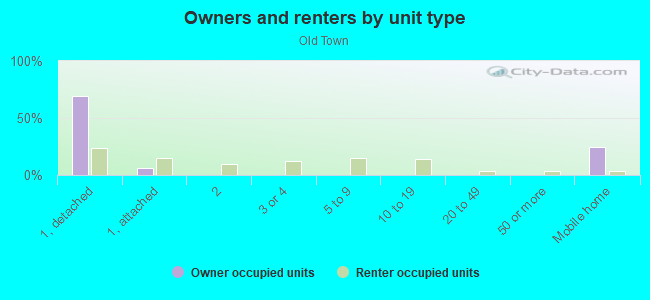
Owner-occupied
Renter-occupied

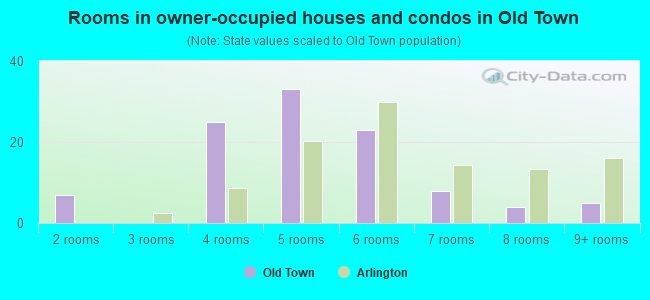
- Rooms in owner-occupied houses and condos in Old Town
- 01 room
- 72 rooms
- 03 rooms
- 254 rooms
- 335 rooms
- 236 rooms
- 87 rooms
- 48 rooms
- 59+ rooms
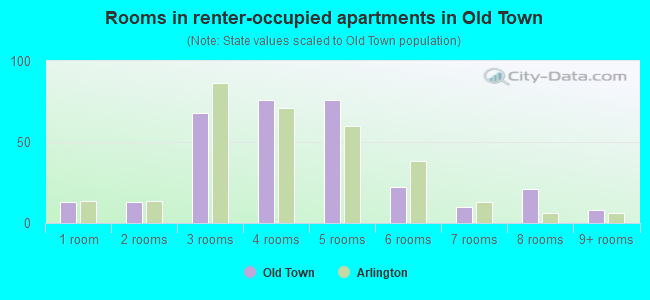
- Rooms in renter-occupied apartments in Old Town
- 131 room
- 132 rooms
- 683 rooms
- 764 rooms
- 765 rooms
- 226 rooms
- 107 rooms
- 218 rooms
- 89+ rooms
Owner-occupied
Renter-occupied
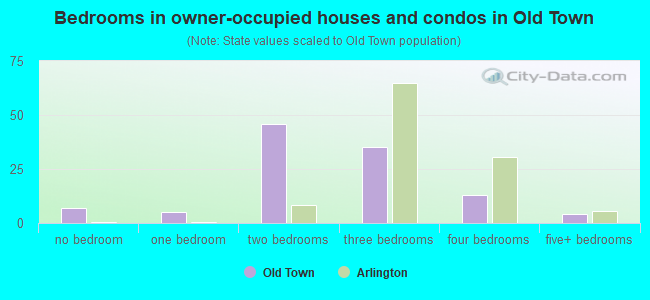
- Bedrooms in owner-occupied houses and condos in Old Town
- 7no bedroom
- 51 bedroom
- 462 bedrooms
- 353 bedrooms
- 134 bedrooms
- 45+ bedrooms
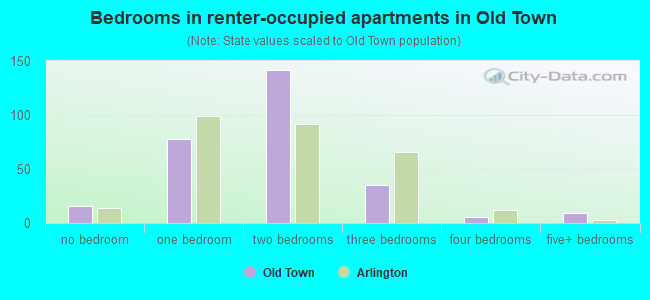
- Bedrooms in renter-occupied apartments in Old Town
- 16no bedroom
- 781 bedroom
- 1422 bedrooms
- 353 bedrooms
- 64 bedrooms
- 95+ bedrooms
Average number of cars or other vehicles available in houses/condos:
Average number of cars or other vehicles available in apartments:
| This neighborhood: | 2.2 |
| Arlington: | 2.2 |
Average number of cars or other vehicles available in apartments:
| Here: | 1.6 |
| city: | 1.4 |
Percentage of units with a mortgage:
| Old Town: | 25.1% |
| Arlington: | 60.9% |
Average estimated value of detached houses in 2022 (37.1% of all units):
| Old Town: | $141,886 |
| Arlington: | $288,155 |
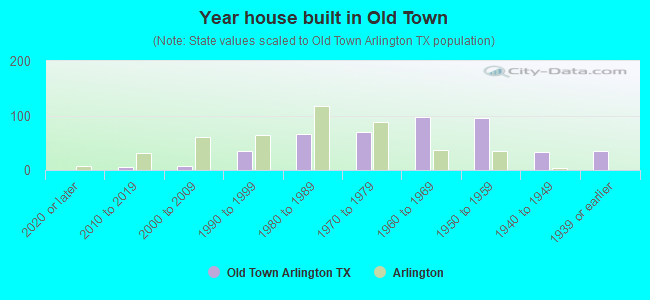
- Year house built in Old Town
- 02020 or later
- 62010 to 2019
- 72000 to 2009
- 341990 to 1999
- 661980 to 1989
- 691970 to 1979
- 981960 to 1969
- 961950 to 1959
- 331940 to 1949
- 351939 or earlier
City-data.com crime index for city in 2020 (higher means more crime):
| City: | 285.6 |
| U.S. average: | 219.5 |
Travel time to work (commute)
![Travel time to work (commute)]()
- 4Less than 5 minutes
- 655 to 9 minutes
- 4610 to 14 minutes
- 10715 to 19 minutes
- 10920 to 24 minutes
- 1625 to 29 minutes
- 11930 to 34 minutes
- 1235 to 39 minutes
- 1440 to 44 minutes
- 3645 to 59 minutes
- 1460 to 89 minutes
- 690 or more minutes

Means of transportation to work
![Means of transportation to work]()
- 70.1%381Drove a car alone
- 23.9%130Carpooled
- 2.0%11Bicycle
- 2.4%13Walked
- 5.5%30Other means
- 2.8%15Worked at home

Time leaving home to go to work
![Time leaving home to go to work]()
- 2312:00 a.m. to 4:59 a.m.
- 615:00 a.m. to 5:29 a.m.
- 365:30 a.m. to 5:59 a.m.
- 706:00 a.m. to 6:29 a.m.
- 286:30 a.m. to 6:59 a.m.
- 707:00 a.m. to 7:29 a.m.
- 397:30 a.m. to 7:59 a.m.
- 628:00 a.m. to 8:29 a.m.
- 188:30 a.m. to 8:59 a.m.
- 149:00 a.m. to 9:59 a.m.
- 2010:00 a.m. to 10:59 a.m.
- 411:00 a.m. to 11:59 a.m.
- 3612:00 p.m. to 3:59 p.m.
- 644:00 p.m. to 11:59 p.m.

Occupations of males:
- Percentage of males in management occupations (except farmers):
Here: 4.9% city: 8.8%
- Percentage of males in healthcare practitioners and technical occupations:
Here: 1.2% city: 2.2%
- Percentage of males in service occupations:
Here: 22.9% city: 12.9%
- Percentage of males in sales and office occupations:
Here: 6.5% city: 17.0%
- Percentage of males in construction, extraction, and maintenance occupations:
Here: 33.2% city: 10.8%
- Percentage of males in production occupations:
Here: 13.0% city: 8.0%
- Percentage of males in transportation occupations:
Here: 2.3% city: 7.6%
- Percentage of males in material moving occupations:
Here: 7.3% city: 7.5%
Occupations of females:
- Percentage of females in management occupations (except farmers):
Here: 7.7% city: 9.3%
- Percentage of females in business and financial operations occupations:
Here: 7.0% city: 6.1%
- Percentage of females in community and social services occupations:
Here: 1.6% city: 2.5%
- Percentage of females in education, training, and library occupations:
Here: 6.2% city: 9.2%
- Percentage of females in arts, design, entertainment, sports, and media occupations:
Here: 1.4% city: 1.7%
- Percentage of females in service occupations:
Here: 33.0% city: 19.8%
- Percentage of females in sales and office occupations:
Here: 19.2% city: 30.1%
- Percentage of females in construction, extraction, and maintenance occupations:
Here: 8.9% city: 0.4%
- Percentage of females in production occupations:
Here: 11.2% city: 3.6%
- Percentage of females in material moving occupations:
Here: 2.4% city: 3.3%
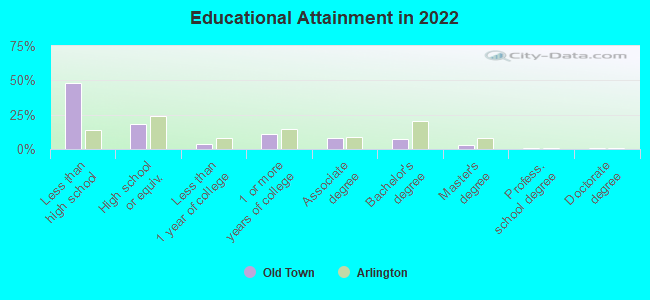
Education in this neighborhood (subdivision or community):
- Percentage of people 3 years and older in K-12 schools:
Old Town: 19.4% Arlington: 19.2%
- Percentage of people 3 years and older in undergraduate colleges:
Old Town: 9.9% Arlington: 8.1%
- Percentage of people 3 years and older in grad. or professional schools:
Old Town: 2.8% Arlington: 1.4%
- Percentage of students K-12 enrolled in private schools:
Old Town: 6.3% Arlington: 7.1%
Percentage of population below poverty level:
| Old Town: | 26.4% |
| Arlington: | 11.7% |
Median year owner moved in (as recorded in 2022):
Median year renter moved in (as recorded in 2022):
| Old Town: | 2004 |
| Arlington: | 2010 |
Median year renter moved in (as recorded in 2022):
| Old Town: | 2017 |
| Arlington: | 2020 |
Percentage of married-couple families with both working:
| Old Town: | 59.6% |
| Arlington: | 62.4% |
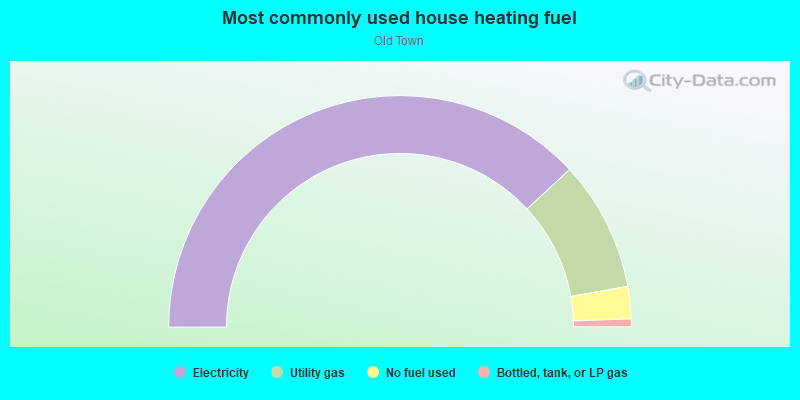
- 76.1%Electricity
- 18.2%Utility gas
- 4.5%No fuel used
- 1.1%Bottled, tank, or LP gas
Highways in this neighborhood:
W Division St (State Hwy 180)
Length: 0.30 miles
Direction: E-W
Address range: 100 to 499
Direction: E-W
Address range: 100 to 499
State Hwy 180 (E Division St)
Length: 0.25 miles
Direction: E-W
Address range: 100 to 399
Direction: E-W
Address range: 100 to 399
Roads and streets:
N Mesquite St
Length: 0.42 miles
Direction: N-S
Address range: 200 to 599
Direction: N-S
Address range: 200 to 599
N Elm St
Length: 0.42 miles
Direction: N-S
Address range: 200 to 599
Direction: N-S
Address range: 200 to 599
N Center St
Length: 0.42 miles
Direction: N-S
Address range: 200 to 599
Direction: N-S
Address range: 200 to 599
N East St
Length: 0.40 miles
Direction: N-S
Address range: 200 to 599
Direction: N-S
Address range: 200 to 599
Nl Robinson Dr
Length: 0.35 miles
Directions: N-S, SE-NW
Address range: 300 to 711
Directions: N-S, SE-NW
Address range: 300 to 711
N Pecan St
Length: 0.34 miles
Direction: N-S
Address range: 200 to 499
Direction: N-S
Address range: 200 to 499
N Oak St
Length: 0.34 miles
Directions: N-S, SW-NE
Address range: 200 to 599
Directions: N-S, SW-NE
Address range: 200 to 599
W Houston St
Length: 0.30 miles
Directions: E-W, SE-NW
Directions: E-W, SE-NW
W North St
Length: 0.30 miles
Direction: E-W
Address range: 100 to 499
Direction: E-W
Address range: 100 to 499
W Sanford St
Length: 0.30 miles
Direction: E-W
Address range: 100 to 499
Direction: E-W
Address range: 100 to 499
W Front St
Length: 0.30 miles
Direction: E-W
Address range: 100 to 499
Direction: E-W
Address range: 100 to 499
E Front St
Length: 0.29 miles
Direction: E-W
Address range: 100 to 457
Direction: E-W
Address range: 100 to 457
E Sanford St
Length: 0.26 miles
Direction: E-W
Address range: 100 to 399
Direction: E-W
Address range: 100 to 399
Indiana St
Length: 0.25 miles
Direction: N-S
Address range: 300 to 599
Direction: N-S
Address range: 300 to 599
E North St
Length: 0.25 miles
Direction: E-W
Address range: 100 to 399
Direction: E-W
Address range: 100 to 399
Maple St
Length: 0.19 miles
Direction: E-W
Address range: 100 to 299
Direction: E-W
Address range: 100 to 299
Prairie St
Length: 0.13 miles
Direction: E-W
Address range: 300 to 499
Direction: E-W
Address range: 300 to 499
N West St
Length: 0.09 miles
Direction: N-S
Address range: 200 to 299
Direction: N-S
Address range: 200 to 299
Jerry Crocker St
Length: 0.08 miles
Direction: N-S
Address range: 200 to 299
Direction: N-S
Address range: 200 to 299