Old Town neighborhood in Bellingham, Washington (WA), 98225 detailed profile
Settings
X


Business Search - 14 Million verified businesses
Area: 0.220 square miles
Population: 1,031
Population density:
| Old Town: | 4,695 people per square mile |
| Bellingham: | 3,662 people per square mile |

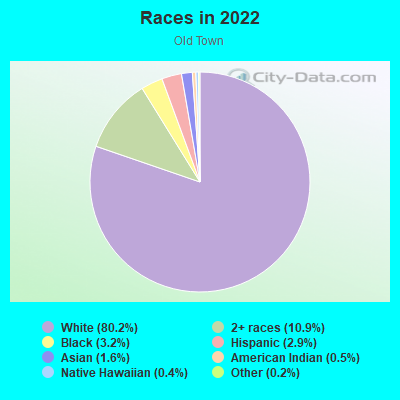
- 71969.9%White
- 13012.6%Hispanic or Latino
- 605.8%Two or more races
- 565.4%Asian
- 333.2%American Indian
- 181.7%Native Hawaiian and Other
Pacific Islander - 131.3%Black
Median household income in 2022:
| Old Town: | $52,602 |
| Bellingham: | $64,748 |
Distribution of median household income
![Distribution of median household income]()
- 122Less than $10,000
- 121$10,000 to $19,999
- 90$20,000 to $29,999
- 46$30,000 to $39,999
- 40$40,000 to $49,999
- 66$50,000 to $59,999
- 64$60,000 to $74,999
- 61$75,000 to $99,999
- 15$100,000 to $124,999
- 5$125,000 to $149,999
- 23$150,000 to $199,999
- 5$200,000 or more

Distribution of owner-occupied house/condo value
![Distribution of owner-occupied house/condo value]()
- 6Less than $50,000
- 2$150,000 to $199,999
- 1$200,000 to $249,999
- 4$250,000 to $299,999
- 21$300,000 to $399,999
- 6$400,000 to $499,999
- 3$500,000 to $749,999
- 22$750,000 to $999,999

Distribution of rent paid by renters
![Distribution of rent paid by renters]()
- 44$100 to $199
- 35$200 to $299
- 2$300 to $399
- 17$400 to $499
- 5$500 to $599
- 54$600 to $699
- 37$700 to $799
- 28$800 to $899
- 43$900 to $999
- 183$1,000 to $1,249
- 87$1,250 to $1,499
- 81$1,500 to $1,999
- 16$2,000 or more

Median rent in 2022:
| Old Town: | $1,099 |
| Bellingham: | $1,372 |
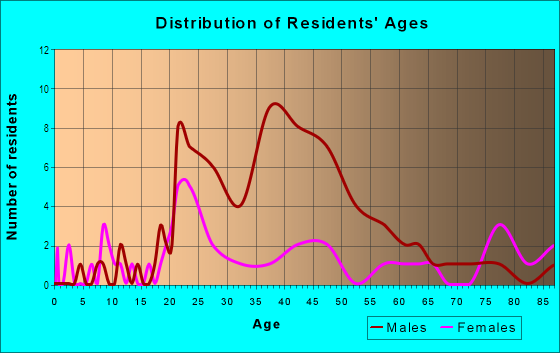
| Males: | 633 |
| Females: | 398 |
Males:
| This neighborhood: | 24.8 years |
| Whole city: | 35.5 years |
| This neighborhood: | 25.5 years |
| Whole city: | 33.5 years |
Average household size:
| Old Town: | 1.5 people |
| Bellingham: | 2.1 people |
Percentage of family households:
| Old Town: | 14.0% |
| Bellingham: | 30.7% |
| Here: | 6.6% |
| Bellingham: | 34.3% |
Percentage of married-couple families with children (among all households):
| Old Town: | 69.5% |
| Bellingham: | 29.6% |
Percentage of single-mother households (among all households):
| Old Town: | 49.6% |
| Bellingham: | 11.1% |
Percentage of never married males 15 years old and over:
Percentage of never married females 15 years old and over:
| Old Town: | 45.0% |
| Bellingham: | 22.3% |
Percentage of never married females 15 years old and over:
| Old Town: | 21.8% |
| city: | 23.0% |
Percentage of people that speak English not well or not at all:
| Old Town: | 1.0% |
| Bellingham: | 1.4% |
Percentage of people born in this state:
Percentage of people born in another U.S. state:
Percentage of native residents but born outside the U.S.:
Percentage of foreign born residents:
| Here: | 43.5% |
| Bellingham: | 46.3% |
Percentage of people born in another U.S. state:
| Old Town: | 43.0% |
| Bellingham: | 40.0% |
Percentage of native residents but born outside the U.S.:
| Here: | 3.6% |
| city: | 2.9% |
Percentage of foreign born residents:
| Here: | 9.9% |
| Bellingham: | 10.8% |
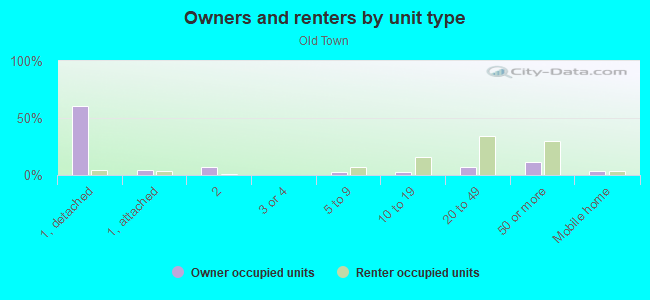
Owner-occupied
Renter-occupied

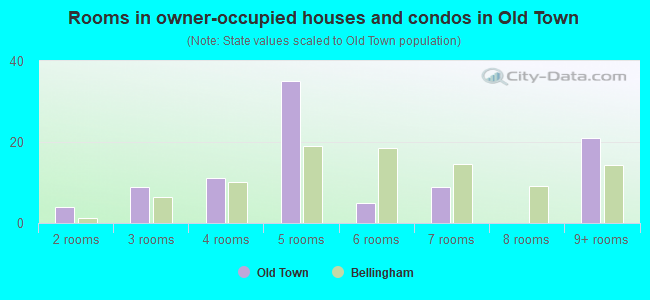
- Rooms in owner-occupied houses and condos in Old Town
- 01 room
- 42 rooms
- 93 rooms
- 114 rooms
- 355 rooms
- 56 rooms
- 97 rooms
- 08 rooms
- 219+ rooms
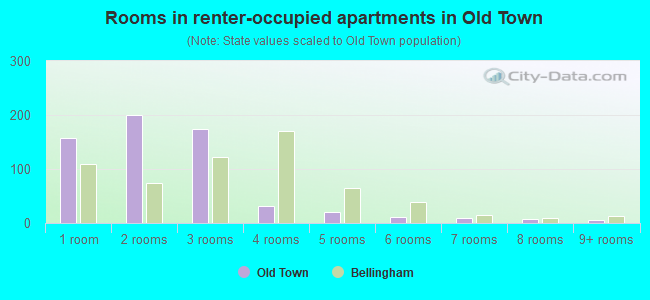
- Rooms in renter-occupied apartments in Old Town
- 1581 room
- 2002 rooms
- 1743 rooms
- 324 rooms
- 215 rooms
- 116 rooms
- 107 rooms
- 78 rooms
- 59+ rooms
Owner-occupied
Renter-occupied
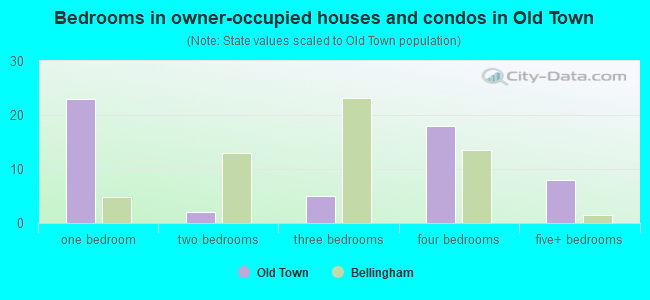
- Bedrooms in owner-occupied houses and condos in Old Town
- 0no bedroom
- 231 bedroom
- 22 bedrooms
- 53 bedrooms
- 184 bedrooms
- 85+ bedrooms
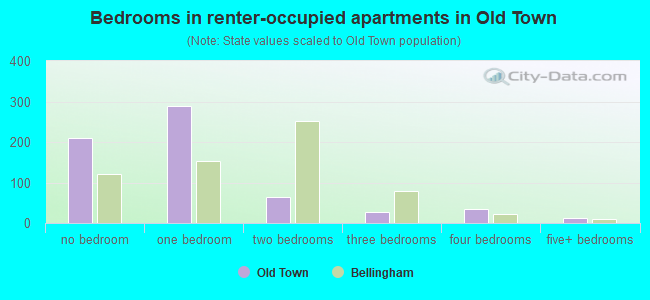
- Bedrooms in renter-occupied apartments in Old Town
- 211no bedroom
- 2891 bedroom
- 652 bedrooms
- 273 bedrooms
- 344 bedrooms
- 135+ bedrooms
Average number of cars or other vehicles available in houses/condos:
Average number of cars or other vehicles available in apartments:
| This neighborhood: | 0.6 |
| Bellingham: | 2.0 |
Average number of cars or other vehicles available in apartments:
| Here: | 1.0 |
| city: | 1.5 |
Percentage of units with a mortgage:
| Old Town: | 59.2% |
| Bellingham: | 61.8% |
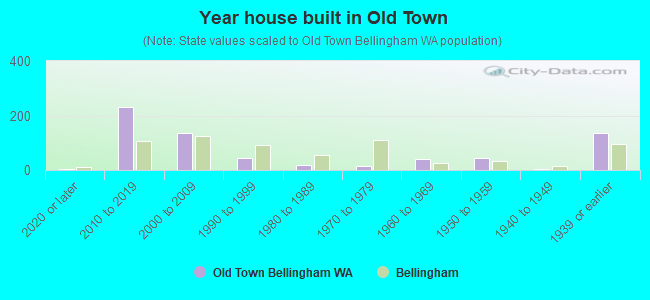
- Year house built in Old Town
- 52020 or later
- 2332010 to 2019
- 1342000 to 2009
- 431990 to 1999
- 191980 to 1989
- 141970 to 1979
- 401960 to 1969
- 431950 to 1959
- 41940 to 1949
- 1361939 or earlier
City-data.com crime index for city in 2020 (higher means more crime):
| City: | 298.0 |
| U.S. average: | 219.5 |
Travel time to work (commute)
![Travel time to work (commute)]()
- 8Less than 5 minutes
- 755 to 9 minutes
- 5110 to 14 minutes
- 6715 to 19 minutes
- 3120 to 24 minutes
- 525 to 29 minutes
- 1230 to 34 minutes
- 135 to 39 minutes
- 340 to 44 minutes
- 645 to 59 minutes
- 1360 to 89 minutes
- 1390 or more minutes

Means of transportation to work
![Means of transportation to work]()
- 50.9%226Drove a car alone
- 4.3%19Carpooled
- 9.5%42Bus
- 1.8%8Ferryboat
- 0.9%4Motorcycle
- 1.1%5Bicycle
- 21.8%97Walked
- 1.1%5Other means
- 9.5%42Worked at home

Time leaving home to go to work
![Time leaving home to go to work]()
- 312:00 a.m. to 4:59 a.m.
- 35:00 a.m. to 5:29 a.m.
- 35:30 a.m. to 5:59 a.m.
- 156:00 a.m. to 6:29 a.m.
- 116:30 a.m. to 6:59 a.m.
- 127:00 a.m. to 7:29 a.m.
- 357:30 a.m. to 7:59 a.m.
- 368:00 a.m. to 8:29 a.m.
- 368:30 a.m. to 8:59 a.m.
- 139:00 a.m. to 9:59 a.m.
- 2310:00 a.m. to 10:59 a.m.
- 311:00 a.m. to 11:59 a.m.
- 6112:00 p.m. to 3:59 p.m.
- 234:00 p.m. to 11:59 p.m.

Occupations of males:
- Percentage of males in management occupations (except farmers):
Here: 5.8% city: 13.7%
- Percentage of males in business and financial operations occupations:
Here: 5.3% city: 4.6%
- Percentage of males in computer and mathematical occupations:
Here: 12.9% city: 4.2%
- Percentage of males in architecture and engineering occupations:
Here: 2.2% city: 4.5%
- Percentage of males in life, physical, and social science occupations:
Here: 1.8% city: 1.6%
- Percentage of males in community and social services occupations:
Here: 2.6% city: 1.6%
- Percentage of males in education, training, and library occupations:
Here: 6.0% city: 4.5%
- Percentage of males in arts, design, entertainment, sports, and media occupations:
Here: 4.4% city: 2.3%
- Percentage of males in healthcare practitioners and technical occupations:
Here: 1.2% city: 4.0%
- Percentage of males in service occupations:
Here: 21.4% city: 17.8%
- Percentage of males in sales and office occupations:
Here: 18.9% city: 13.8%
- Percentage of males in production occupations:
Here: 7.2% city: 6.9%
- Percentage of males in material moving occupations:
Here: 8.1% city: 5.0%
Occupations of females:
- Percentage of females in management occupations (except farmers):
Here: 6.8% city: 8.2%
- Percentage of females in business and financial operations occupations:
Here: 3.8% city: 5.9%
- Percentage of females in life, physical, and social science occupations:
Here: 2.6% city: 1.0%
- Percentage of females in community and social services occupations:
Here: 2.1% city: 3.8%
- Percentage of females in education, training, and library occupations:
Here: 26.6% city: 11.2%
- Percentage of females in service occupations:
Here: 25.1% city: 26.0%
- Percentage of females in sales and office occupations:
Here: 23.7% city: 22.8%
- Percentage of females in production occupations:
Here: 6.8% city: 3.1%
- Percentage of females in material moving occupations:
Here: 2.3% city: 1.6%
Percentage of people 16-64 in Armed Forces:
| Old Town: | 1.2% |
| Bellingham: | 0.3% |
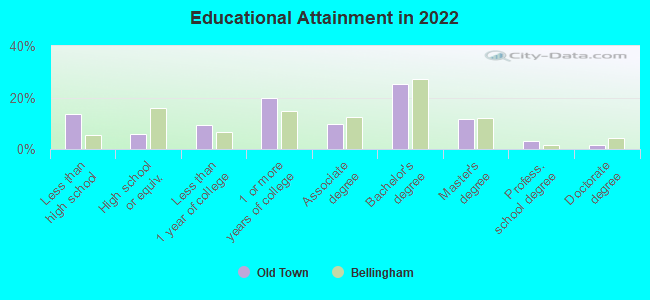
Education in this neighborhood (subdivision or community):
- Percentage of people 3 years and older in K-12 schools:
Old Town: 9.0% Bellingham: 12.3%
- Percentage of people 3 years and older in undergraduate colleges:
Old Town: 19.6% Bellingham: 15.0%
- Percentage of people 3 years and older in grad. or professional schools:
Old Town: 2.3% Bellingham: 1.7%
- Percentage of students K-12 enrolled in private schools:
Old Town: 0.0% Bellingham: 28.6%
Percentage of population below poverty level:
| Old Town: | 39.6% |
| Bellingham: | 14.3% |
Median year owner moved in (as recorded in 2022):
Median year renter moved in (as recorded in 2022):
| Old Town: | 2009 |
| Bellingham: | 2012 |
Median year renter moved in (as recorded in 2022):
| Old Town: | 2019 |
| Bellingham: | 2020 |
Percentage of married-couple families with both working:
| Old Town: | 61.2% |
| Bellingham: | 76.1% |
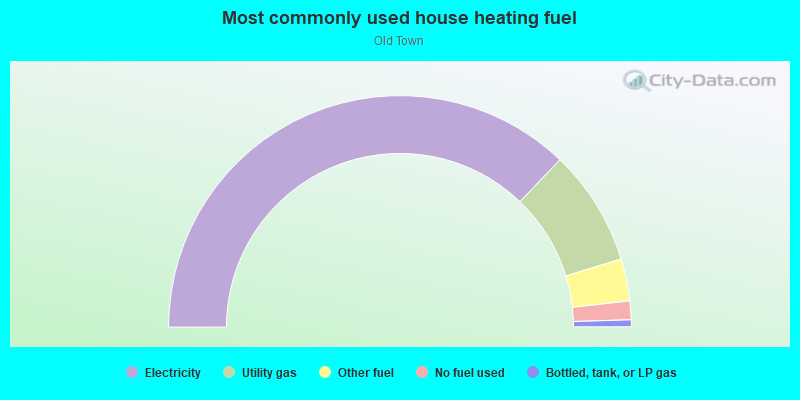
- 74.3%Electricity
- 16.2%Utility gas
- 5.9%Other fuel
- 2.6%No fuel used
- 1.0%Bottled, tank, or LP gas
Roads and streets:
W Holly St
Length: 0.94 miles
Direction: SE-NW
Address range: 100 to 1398
Direction: SE-NW
Address range: 100 to 1398
Cornwall Ave
Length: 0.54 miles
Direction: SW-NE
Address range: 700 to 1499
Direction: SW-NE
Address range: 700 to 1499
N State St
Length: 0.50 miles
Direction: SW-NE
Address range: 1100 to 1499
Direction: SW-NE
Address range: 1100 to 1499
Railroad Ave
Length: 0.50 miles
Direction: SW-NE
Address range: 1100 to 1499
Direction: SW-NE
Address range: 1100 to 1499
Roeder Ave
Length: 0.48 miles
Directions: E-W, SE-NW
Address range: 600 to 1191
Directions: E-W, SE-NW
Address range: 600 to 1191
Chestnut St (W Chestnut St)
Length: 0.31 miles
Directions: N-S, SE-NW
Address range: 100 to 499
Directions: N-S, SE-NW
Address range: 100 to 499
C St
Length: 0.25 miles
Direction: SW-NE
Address range: 1200 to 1699
Direction: SW-NE
Address range: 1200 to 1699
Commercial St
Length: 0.25 miles
Direction: SW-NE
Address range: 1200 to 1399
Direction: SW-NE
Address range: 1200 to 1399
D St
Length: 0.22 miles
Direction: SW-NE
Address range: 1200 to 1599
Direction: SW-NE
Address range: 1200 to 1599
Astor St
Length: 0.18 miles
Direction: SE-NW
Address range: 700 to 999
Direction: SE-NW
Address range: 700 to 999
E Champion St
Length: 0.17 miles
Direction: SE-NW
Address range: 100 to 299
Direction: SE-NW
Address range: 100 to 299
E Maple St
Length: 0.17 miles
Direction: SE-NW
Address range: 100 to 299
Direction: SE-NW
Address range: 100 to 299
E Magnolia St
Length: 0.17 miles
Direction: SE-NW
Address range: 100 to 299
Direction: SE-NW
Address range: 100 to 299
E Holly St
Length: 0.17 miles
Direction: SE-NW
Address range: 100 to 299
Direction: SE-NW
Address range: 100 to 299
E Chestnut St
Length: 0.17 miles
Direction: SE-NW
Address range: 100 to 299
Direction: SE-NW
Address range: 100 to 299
Bay St
Length: 0.14 miles
Direction: SW-NE
Address range: 1200 to 1299
Direction: SW-NE
Address range: 1200 to 1299
E St
Length: 0.14 miles
Direction: SW-NE
Address range: 1300 to 1399
Direction: SW-NE
Address range: 1300 to 1399
F St
Length: 0.14 miles
Direction: SW-NE
Address range: 1200 to 1399
Direction: SW-NE
Address range: 1200 to 1399
B St
Length: 0.13 miles
Direction: SW-NE
Direction: SW-NE
Central Ave
Length: 0.12 miles
Direction: SW-NE
Address range: 1200 to 1299
Direction: SW-NE
Address range: 1200 to 1299
Bancroft St
Length: 0.12 miles
Direction: SE-NW
Direction: SE-NW
Magnolia St (W Magnolia St)
Length: 0.08 miles
Direction: SE-NW
Address range: 100 to 199
Direction: SE-NW
Address range: 100 to 199
H St
Length: 0.07 miles
Direction: SW-NE
Direction: SW-NE
G St
Length: 0.07 miles
Direction: SW-NE
Direction: SW-NE
J St
Length: 0.06 miles
Direction: SW-NE
Address range: 1200 to 1298
Direction: SW-NE
Address range: 1200 to 1298
Clinton St
Length: 0.06 miles
Direction: SE-NW
Direction: SE-NW
Hilton Ave
Length: 0.04 miles
Directions: E-W, SW-NE
Directions: E-W, SW-NE
W Chestnut St
Length: 0.02 miles
Direction: SE-NW
Direction: SE-NW
Railroad features:
Burlington Northern Santa Fe Rlwy
Length: 1.03 miles
Directions: N-S, SE-NW
Directions: N-S, SE-NW
Other features:
Whatcom Crk
Length: 0.07 miles
Direction: SW-NE
Direction: SW-NE