Panoramic neighborhood in Mill Valley, California (CA), 94941 detailed profile
Settings
X


Business Search - 14 Million verified businesses
Area: 0.462 square miles
Population: 1,324
Population density:
| Panoramic: | 2,866 people per square mile |
| Mill Valley: | 3,010 people per square mile |

- 1,07579.5%White
- 1349.9%Asian
- 1138.4%Hispanic or Latino
- 161.2%Two or more races
- 110.8%Black
- 30.2%Some other race

Median household income in 2022:
| Panoramic: | $227,720 |
| Mill Valley: | $202,986 |
Distribution of median household income
![Distribution of median household income]()
- 15Less than $10,000
- 53$10,000 to $19,999
- 57$20,000 to $29,999
- 79$30,000 to $39,999
- 10$40,000 to $49,999
- 7$50,000 to $59,999
- 10$60,000 to $74,999
- 52$75,000 to $99,999
- 75$100,000 to $124,999
- 16$125,000 to $149,999
- 93$150,000 to $199,999
- 155$200,000 or more

Distribution of owner-occupied house/condo value
![Distribution of owner-occupied house/condo value]()
- 4Less than $50,000
- 51$100,000 to $149,999
- 53$150,000 to $199,999
- 5$200,000 to $249,999
- 3$250,000 to $299,999
- 4$300,000 to $399,999
- 20$400,000 to $499,999
- 15$500,000 to $749,999
- 72$750,000 to $999,999
- 332$1,000,000 or more

Distribution of rent paid by renters
![Distribution of rent paid by renters]()
- 8$100 to $199
- 4$200 to $299
- 11$300 to $399
- 6$900 to $999
- 3$1,000 to $1,249
- 11$1,250 to $1,499
- 26$1,500 to $1,999
- 76$2,000 or more

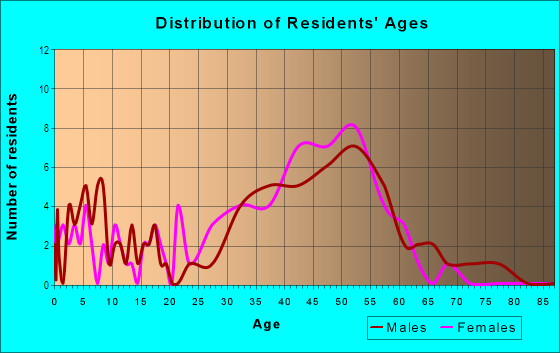
| Males: | 663 |
| Females: | 661 |
Males:
| This neighborhood: | 48.8 years |
| Whole city: | 46.4 years |
| This neighborhood: | 44.5 years |
| Whole city: | 47.3 years |
Average household size:
| Panoramic: | 2.7 people |
| Mill Valley: | 2.5 people |
Percentage of family households:
| Panoramic: | 29.8% |
| Mill Valley: | 47.2% |
| Here: | 56.4% |
| Mill Valley: | 56.3% |
Percentage of married-couple families with children (among all households):
| Panoramic: | 39.0% |
| Mill Valley: | 32.4% |
Percentage of single-mother households (among all households):
| Panoramic: | 2.2% |
| Mill Valley: | 5.6% |
Percentage of never married males 15 years old and over:
Percentage of never married females 15 years old and over:
| Panoramic: | 10.0% |
| Mill Valley: | 14.9% |
Percentage of never married females 15 years old and over:
| Panoramic: | 15.6% |
| city: | 13.2% |
Percentage of people that speak English not well or not at all:
| Panoramic: | 1.1% |
| Mill Valley: | 0.6% |
Percentage of people born in this state:
Percentage of people born in another U.S. state:
Percentage of native residents but born outside the U.S.:
Percentage of foreign born residents:
| Here: | 50.2% |
| Mill Valley: | 42.0% |
Percentage of people born in another U.S. state:
| Panoramic: | 35.2% |
| Mill Valley: | 37.9% |
Percentage of native residents but born outside the U.S.:
| Here: | 2.5% |
| city: | 3.5% |
Percentage of foreign born residents:
| Here: | 12.1% |
| Mill Valley: | 16.6% |

Owner-occupied
Renter-occupied


- Rooms in owner-occupied houses and condos in Panoramic
- 21 room
- 122 rooms
- 1013 rooms
- 424 rooms
- 745 rooms
- 1816 rooms
- 157 rooms
- 538 rooms
- 819+ rooms

- Rooms in renter-occupied apartments in Panoramic
- 131 room
- 242 rooms
- 553 rooms
- 514 rooms
- 215 rooms
- 136 rooms
- 147 rooms
- 08 rooms
- 29+ rooms
Owner-occupied
Renter-occupied

- Bedrooms in owner-occupied houses and condos in Panoramic
- 2no bedroom
- 561 bedroom
- 2242 bedrooms
- 1933 bedrooms
- 264 bedrooms
- 555+ bedrooms

- Bedrooms in renter-occupied apartments in Panoramic
- 16no bedroom
- 551 bedroom
- 172 bedrooms
- 273 bedrooms
- 94 bedrooms
- 45+ bedrooms
Average number of cars or other vehicles available in houses/condos:
Average number of cars or other vehicles available in apartments:
| This neighborhood: | 0.8 |
| Mill Valley: | 2.1 |
Average number of cars or other vehicles available in apartments:
| Here: | 2.6 |
| city: | 1.3 |
Percentage of units with a mortgage:
| Panoramic: | 62.9% |
| Mill Valley: | 69.0% |

- Year house built in Panoramic
- 52020 or later
- 102010 to 2019
- 182000 to 2009
- 731990 to 1999
- 381980 to 1989
- 771970 to 1979
- 1031960 to 1969
- 241950 to 1959
- 501940 to 1949
- 1831939 or earlier

City-data.com crime index for city in 2020 (higher means more crime):
| City: | 112.2 |
| U.S. average: | 219.5 |
Travel time to work (commute)
![Travel time to work (commute)]()
- 6Less than 5 minutes
- 425 to 9 minutes
- 4110 to 14 minutes
- 6315 to 19 minutes
- 4520 to 24 minutes
- 2625 to 29 minutes
- 5730 to 34 minutes
- 3735 to 39 minutes
- 1140 to 44 minutes
- 4145 to 59 minutes
- 3160 to 89 minutes
- 2690 or more minutes

Means of transportation to work
![Means of transportation to work]()
- 46.7%236Drove a car alone
- 13.7%69Carpooled
- 4.0%20Bus
- 2.6%13Ferryboat
- 3.6%18Bicycle
- 2.8%14Walked
- 1.6%8Other means
- 33.1%167Worked at home

Time leaving home to go to work
![Time leaving home to go to work]()
- 1412:00 a.m. to 4:59 a.m.
- 145:30 a.m. to 5:59 a.m.
- 226:00 a.m. to 6:29 a.m.
- 216:30 a.m. to 6:59 a.m.
- 487:00 a.m. to 7:29 a.m.
- 757:30 a.m. to 7:59 a.m.
- 948:00 a.m. to 8:29 a.m.
- 478:30 a.m. to 8:59 a.m.
- 479:00 a.m. to 9:59 a.m.
- 1710:00 a.m. to 10:59 a.m.
- 811:00 a.m. to 11:59 a.m.
- 1412:00 p.m. to 3:59 p.m.
- 144:00 p.m. to 11:59 p.m.

Occupations of males:
- Percentage of males in management occupations (except farmers):
Here: 7.5% city: 28.2%
- Percentage of males in business and financial operations occupations:
Here: 21.3% city: 8.7%
- Percentage of males in computer and mathematical occupations:
Here: 5.2% city: 6.1%
- Percentage of males in architecture and engineering occupations:
Here: 2.4% city: 5.1%
- Percentage of males in legal occupations:
Here: 4.5% city: 5.9%
- Percentage of males in education, training, and library occupations:
Here: 17.6% city: 1.6%
- Percentage of males in arts, design, entertainment, sports, and media occupations:
Here: 9.3% city: 6.4%
- Percentage of males in healthcare practitioners and technical occupations:
Here: 7.8% city: 6.5%
- Percentage of males in service occupations:
Here: 10.4% city: 4.6%
- Percentage of males in sales and office occupations:
Here: 12.2% city: 18.4%
- Percentage of males in production occupations:
Here: 1.0% city: 2.3%
Occupations of females:
- Percentage of females in management occupations (except farmers):
Here: 1.4% city: 22.1%
- Percentage of females in business and financial operations occupations:
Here: 15.6% city: 9.4%
- Percentage of females in life, physical, and social science occupations:
Here: 6.0% city: 3.3%
- Percentage of females in legal occupations:
Here: 8.9% city: 3.7%
- Percentage of females in education, training, and library occupations:
Here: 34.0% city: 12.8%
- Percentage of females in arts, design, entertainment, sports, and media occupations:
Here: 1.5% city: 8.3%
- Percentage of females in healthcare practitioners and technical occupations:
Here: 7.6% city: 12.4%
- Percentage of females in service occupations:
Here: 8.4% city: 7.5%
- Percentage of females in sales and office occupations:
Here: 16.1% city: 11.9%
Education in this neighborhood (subdivision or community):
- Percentage of people 3 years and older in K-12 schools:
Panoramic: 21.0% Mill Valley: 18.4%
- Percentage of people 3 years and older in undergraduate colleges:
Panoramic: 2.6% Mill Valley: 2.6%
- Percentage of people 3 years and older in grad. or professional schools:
Panoramic: 1.1% Mill Valley: 1.8%
- Percentage of students K-12 enrolled in private schools:
Panoramic: 46.9% Mill Valley: 32.0%
Percentage of population below poverty level:
| Panoramic: | 5.3% |
| Mill Valley: | 4.6% |
Median year owner moved in (as recorded in 2022):
| Panoramic: | 2000 |
| Mill Valley: | 2003 |
Percentage of married-couple families with both working:
| Panoramic: | 74.4% |
| Mill Valley: | 61.5% |

- 85.6%Utility gas
- 9.2%Electricity
- 2.9%Bottled, tank, or LP gas
- 1.5%Solar energy
- 0.8%Wood
Roads and streets:
Panoramic Hwy
Length: 2.00 miles
Directions: E-W, N-S, SE-NW, SW-NE
Address range: 214 to 799
Directions: E-W, N-S, SE-NW, SW-NE
Address range: 214 to 799
Ridge Ave
Length: 0.52 miles
Directions: E-W, N-S, SE-NW, SW-NE
Address range: 1 to 82
Directions: E-W, N-S, SE-NW, SW-NE
Address range: 1 to 82
Marin View Ave
Length: 0.35 miles
Directions: E-W, SE-NW
Address range: 1 to 199
Directions: E-W, SE-NW
Address range: 1 to 199
Monte Cimas Ave
Length: 0.22 miles
Directions: E-W, N-S, SE-NW, SW-NE
Address range: 1 to 99
Directions: E-W, N-S, SE-NW, SW-NE
Address range: 1 to 99
Adams Ave
Length: 0.20 miles
Directions: N-S, SE-NW
Address range: 1 to 199
Directions: N-S, SE-NW
Address range: 1 to 199
Muir Woods Trl
Length: 0.20 miles
Direction: SW-NE
Direction: SW-NE
Mountain View Ln
Length: 0.18 miles
Directions: E-W, N-S, SE-NW, SW-NE
Address range: 200 to 299
Directions: E-W, N-S, SE-NW, SW-NE
Address range: 200 to 299
Bay View Dr (Bayview Dr)
Length: 0.15 miles
Directions: N-S, SW-NE
Address range: 53 to 198
Directions: N-S, SW-NE
Address range: 53 to 198
Camp Eastwood Rd
Length: 0.13 miles
Direction: SE-NW
Direction: SE-NW
Ashbury Ave
Length: 0.12 miles
Directions: E-W, N-S, SE-NW, SW-NE
Address range: 44 to 52
Directions: E-W, N-S, SE-NW, SW-NE
Address range: 44 to 52
Park Ave
Length: 0.12 miles
Directions: N-S, SE-NW, SW-NE
Directions: N-S, SE-NW, SW-NE
Pine Trl
Length: 0.11 miles
Directions: E-W, N-S, SE-NW, SW-NE
Directions: E-W, N-S, SE-NW, SW-NE
Redwood Trl
Length: 0.11 miles
Directions: N-S, SW-NE
Directions: N-S, SW-NE
Edgewood Ave
Length: 0.11 miles
Directions: E-W, N-S, SW-NE
Address range: 1082 to 1099
Directions: E-W, N-S, SW-NE
Address range: 1082 to 1099
Palm Way
Length: 0.10 miles
Directions: E-W, N-S
Address range: 1 to 99
Directions: E-W, N-S
Address range: 1 to 99
Kent Way
Length: 0.10 miles
Direction: E-W
Address range: 1 to 99
Direction: E-W
Address range: 1 to 99
Ridge Ln
Length: 0.10 miles
Directions: E-W, SE-NW
Directions: E-W, SE-NW
Brighton Blvd
Length: 0.10 miles
Directions: E-W, N-S, SW-NE
Address range: 1 to 19
Directions: E-W, N-S, SW-NE
Address range: 1 to 19
Muir Ave
Length: 0.09 miles
Directions: E-W, N-S
Address range: 1 to 102
Directions: E-W, N-S
Address range: 1 to 102
Lone Tree Rd
Length: 0.09 miles
Direction: SW-NE
Address range: 1 to 199
Direction: SW-NE
Address range: 1 to 199
Redwood Ave
Length: 0.09 miles
Directions: E-W, N-S
Directions: E-W, N-S
Mid Rd
Length: 0.09 miles
Directions: E-W, SW-NE
Directions: E-W, SW-NE
St Jude Rd
Length: 0.09 miles
Directions: E-W, N-S, SE-NW, SW-NE
Directions: E-W, N-S, SE-NW, SW-NE
Gravity Car Rd
Length: 0.09 miles
Directions: E-W, N-S, SE-NW
Directions: E-W, N-S, SE-NW
Hazel Trl
Length: 0.08 miles
Directions: N-S, SW-NE
Directions: N-S, SW-NE
Hamilton Ln
Length: 0.08 miles
Directions: E-W, SW-NE
Address range: 1 to 99
Directions: E-W, SW-NE
Address range: 1 to 99
Spring Trl
Length: 0.08 miles
Directions: N-S, SE-NW
Directions: N-S, SE-NW
Saint Jude Rd
Length: 0.08 miles
Direction: SW-NE
Address range: 1 to 99
Direction: SW-NE
Address range: 1 to 99
Madrone Trl
Length: 0.07 miles
Directions: N-S, SE-NW
Directions: N-S, SE-NW
Washington Park Ave
Length: 0.06 miles
Directions: N-S, SE-NW
Directions: N-S, SE-NW
Sunrise Ln
Length: 0.05 miles
Directions: N-S, SW-NE
Address range: 1 to 99
Directions: N-S, SW-NE
Address range: 1 to 99
Huckleberry Trl
Length: 0.05 miles
Directions: N-S, SE-NW
Address range: 1 to 99
Directions: N-S, SE-NW
Address range: 1 to 99
Chanticleer Ave
Length: 0.05 miles
Directions: E-W, SE-NW
Address range: 1 to 99
Directions: E-W, SE-NW
Address range: 1 to 99
Muir Woods
Length: 0.05 miles
Direction: SW-NE
Direction: SW-NE
Annie Ln
Length: 0.05 miles
Direction: SW-NE
Address range: 1 to 11
Direction: SW-NE
Address range: 1 to 11
Lone Tree Ave
Length: 0.05 miles
Directions: E-W, N-S, SE-NW
Address range: 2 to 176
Directions: E-W, N-S, SE-NW
Address range: 2 to 176
Kings Way (Fern Ln)
Length: 0.04 miles
Directions: E-W, N-S, SW-NE
Address range: 1 to 99
Directions: E-W, N-S, SW-NE
Address range: 1 to 99
Kings Way
Length: 0.03 miles
Direction: E-W
Address range: 1 to 199
Direction: E-W
Address range: 1 to 199
Madera Way
Length: 0.03 miles
Directions: E-W, N-S
Address range: 1 to 11
Directions: E-W, N-S
Address range: 1 to 11
Forest Way
Length: 0.01 miles
Direction: N-S
Direction: N-S