Parkview neighborhood in Richmond, California (CA), 94804 detailed profile
Settings
X


Business Search - 14 Million verified businesses
Area: 0.179 square miles
Population: 2,598
Population density:
| Parkview: | 14,542 people per square mile |
| Richmond: | 3,812 people per square mile |

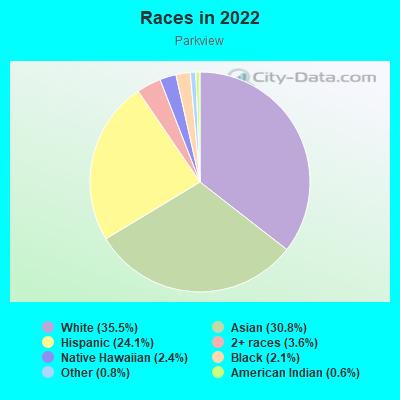
- 1,58760.9%Black
- 49719.1%Hispanic or Latino
- 2349.0%Asian
- 2308.8%White
- 170.7%Some other race
- 190.7%Two or more races
- 150.6%Native Hawaiian and Other
Pacific Islander - 80.3%American Indian
Distribution of median household income
![Distribution of median household income]()
- 101Less than $10,000
- 127$10,000 to $19,999
- 143$20,000 to $29,999
- 109$30,000 to $39,999
- 83$40,000 to $49,999
- 39$50,000 to $59,999
- 29$60,000 to $74,999
- 205$75,000 to $99,999
- 134$100,000 to $124,999
- 29$125,000 to $149,999
- 32$150,000 to $199,999
- 43$200,000 or more

Distribution of owner-occupied house/condo value
![Distribution of owner-occupied house/condo value]()
- 2Less than $50,000
- 4$50,000 to $99,999
- 32$200,000 to $249,999
- 16$250,000 to $299,999
- 37$300,000 to $399,999
- 25$400,000 to $499,999
- 145$500,000 to $749,999
- 32$750,000 to $999,999
- 31$1,000,000 or more

Distribution of rent paid by renters
![Distribution of rent paid by renters]()
- 13Less than $100
- 9$200 to $299
- 88$300 to $399
- 70$400 to $499
- 89$500 to $599
- 80$600 to $699
- 44$700 to $799
- 81$800 to $899
- 57$1,000 to $1,249
- 70$1,250 to $1,499
- 146$1,500 to $1,999
- 212$2,000 or more

Median rent in 2022:
| Parkview: | $909 |
| Richmond: | $1,601 |
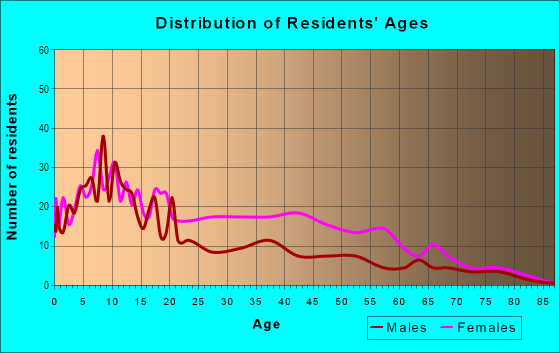
| Males: | 1,166 |
| Females: | 1,432 |
Males:
| This neighborhood: | 34.4 years |
| Whole city: | 35.3 years |
| This neighborhood: | 40.4 years |
| Whole city: | 43.0 years |
Average household size:
| Parkview: | 12.7 people |
| Richmond: | 2.8 people |
Percentage of family households:
| Parkview: | 51.0% |
| Richmond: | 42.7% |
| Here: | 20.1% |
| Richmond: | 40.5% |
Percentage of married-couple families with children (among all households):
| Parkview: | 16.3% |
| Richmond: | 21.6% |
Percentage of single-mother households (among all households):
| Parkview: | 22.6% |
| Richmond: | 9.9% |
Percentage of never married males 15 years old and over:
Percentage of never married females 15 years old and over:
| Parkview: | 25.6% |
| Richmond: | 25.4% |
Percentage of never married females 15 years old and over:
| Parkview: | 28.8% |
| city: | 19.6% |
Percentage of people that speak English not well or not at all:
| Parkview: | 6.1% |
| Richmond: | 12.7% |
Percentage of people born in this state:
Percentage of people born in another U.S. state:
Percentage of native residents but born outside the U.S.:
Percentage of foreign born residents:
| Here: | 53.9% |
| Richmond: | 47.4% |
Percentage of people born in another U.S. state:
| Parkview: | 13.7% |
| Richmond: | 14.0% |
Percentage of native residents but born outside the U.S.:
| Here: | 0.9% |
| city: | 2.3% |
Percentage of foreign born residents:
| Here: | 31.5% |
| Richmond: | 36.3% |

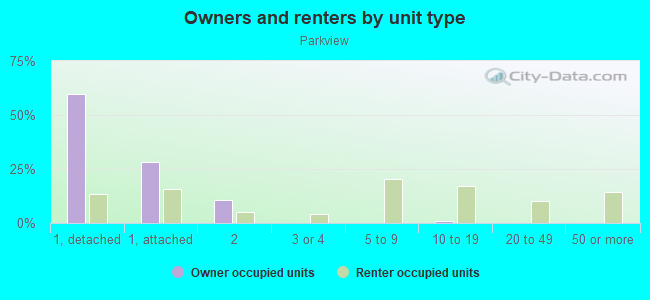
Owner-occupied
Renter-occupied

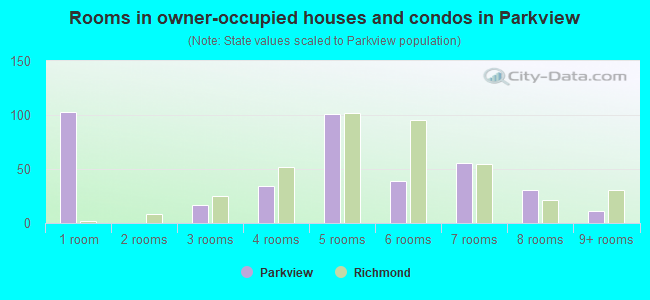
- Rooms in owner-occupied houses and condos in Parkview
- 1031 room
- 02 rooms
- 173 rooms
- 344 rooms
- 1015 rooms
- 396 rooms
- 567 rooms
- 318 rooms
- 119+ rooms
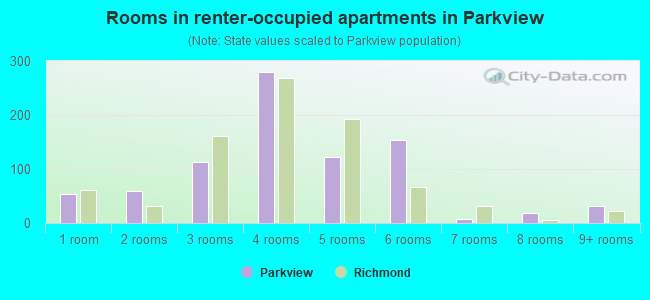
- Rooms in renter-occupied apartments in Parkview
- 531 room
- 602 rooms
- 1133 rooms
- 2804 rooms
- 1235 rooms
- 1546 rooms
- 77 rooms
- 198 rooms
- 319+ rooms
Owner-occupied
Renter-occupied

- Bedrooms in owner-occupied houses and condos in Parkview
- 103no bedroom
- 161 bedroom
- 372 bedrooms
- 1453 bedrooms
- 694 bedrooms
- 25+ bedrooms
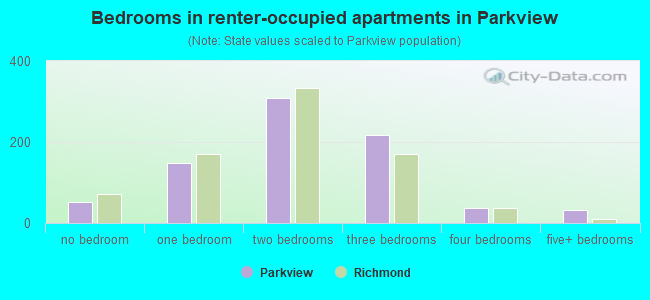
- Bedrooms in renter-occupied apartments in Parkview
- 53no bedroom
- 1471 bedroom
- 3092 bedrooms
- 2183 bedrooms
- 364 bedrooms
- 315+ bedrooms
Average number of cars or other vehicles available in houses/condos:
Average number of cars or other vehicles available in apartments:
| This neighborhood: | 1.9 |
| Richmond: | 2.2 |
Average number of cars or other vehicles available in apartments:
| Here: | 1.1 |
| city: | 1.7 |
Percentage of units with a mortgage:
| Parkview: | 84.5% |
| Richmond: | 67.4% |
Average estimated value of detached houses in 2022 (28.4% of all units):
| Parkview: | $619,922 |
| Richmond: | $610,033 |

- Year house built in Parkview
- 02020 or later
- 502010 to 2019
- 222000 to 2009
- 1351990 to 1999
- 291980 to 1989
- 1921970 to 1979
- 3621960 to 1969
- 931950 to 1959
- 731940 to 1949
- 791939 or earlier
City-data.com crime index for city in 2020 (higher means more crime):
| City: | 461.7 |
| U.S. average: | 219.5 |
Travel time to work (commute)
![Travel time to work (commute)]()
- 10Less than 5 minutes
- 665 to 9 minutes
- 7510 to 14 minutes
- 8015 to 19 minutes
- 14220 to 24 minutes
- 1125 to 29 minutes
- 8330 to 34 minutes
- 1435 to 39 minutes
- 6740 to 44 minutes
- 8545 to 59 minutes
- 12460 to 89 minutes
- 4290 or more minutes

Means of transportation to work
![Means of transportation to work]()
- 64.4%739Drove a car alone
- 7.2%83Carpooled
- 4.8%55Bus
- 9.8%113Subway or elevated rail
- 0.6%7Long-distance train or commuter rail
- 2.0%23Light rail, streetcar or trolley
- 0.3%3Bicycle
- 2.7%31Walked
- 9.0%103Other means
- 5.0%57Worked at home

Time leaving home to go to work
![Time leaving home to go to work]()
- 5512:00 a.m. to 4:59 a.m.
- 115:00 a.m. to 5:29 a.m.
- 535:30 a.m. to 5:59 a.m.
- 806:00 a.m. to 6:29 a.m.
- 746:30 a.m. to 6:59 a.m.
- 937:00 a.m. to 7:29 a.m.
- 1047:30 a.m. to 7:59 a.m.
- 838:00 a.m. to 8:29 a.m.
- 458:30 a.m. to 8:59 a.m.
- 219:00 a.m. to 9:59 a.m.
- 1210:00 a.m. to 10:59 a.m.
- 2311:00 a.m. to 11:59 a.m.
- 11212:00 p.m. to 3:59 p.m.
- 504:00 p.m. to 11:59 p.m.

Occupations of males:
- Percentage of males in management occupations (except farmers):
Here: 4.4% city: 9.4%
- Percentage of males in business and financial operations occupations:
Here: 9.5% city: 4.6%
- Percentage of males in computer and mathematical occupations:
Here: 7.6% city: 3.3%
- Percentage of males in architecture and engineering occupations:
Here: 4.3% city: 2.9%
- Percentage of males in arts, design, entertainment, sports, and media occupations:
Here: 3.7% city: 2.2%
- Percentage of males in service occupations:
Here: 19.4% city: 18.4%
- Percentage of males in sales and office occupations:
Here: 15.1% city: 13.4%
- Percentage of males in construction, extraction, and maintenance occupations:
Here: 14.1% city: 14.7%
- Percentage of males in production occupations:
Here: 19.2% city: 4.8%
Occupations of females:
- Percentage of females in management occupations (except farmers):
Here: 7.5% city: 10.0%
- Percentage of females in business and financial operations occupations:
Here: 3.1% city: 4.9%
- Percentage of females in community and social services occupations:
Here: 2.1% city: 3.3%
- Percentage of females in education, training, and library occupations:
Here: 1.5% city: 8.3%
- Percentage of females in healthcare practitioners and technical occupations:
Here: 2.9% city: 4.9%
- Percentage of females in service occupations:
Here: 33.4% city: 28.3%
- Percentage of females in sales and office occupations:
Here: 35.9% city: 25.4%
- Percentage of females in transportation occupations:
Here: 6.0% city: 1.9%
- Percentage of females in material moving occupations:
Here: 7.1% city: 3.0%
Education in this neighborhood (subdivision or community):
- Percentage of people 3 years and older in K-12 schools:
Parkview: 26.2% Richmond: 17.8%
- Percentage of people 3 years and older in undergraduate colleges:
Parkview: 4.5% Richmond: 4.5%
- Percentage of people 3 years and older in grad. or professional schools:
Parkview: 1.2% Richmond: 0.8%
- Percentage of students K-12 enrolled in private schools:
Parkview: 18.0% Richmond: 7.3%
Percentage of population below poverty level:
| Parkview: | 11.5% |
| Richmond: | 16.2% |
Median year owner moved in (as recorded in 2022):
Median year renter moved in (as recorded in 2022):
| Parkview: | 2002 |
| Richmond: | 2006 |
Median year renter moved in (as recorded in 2022):
| Parkview: | 2014 |
| Richmond: | 2016 |
Percentage of married-couple families with both working:
| Parkview: | 64.2% |
| Richmond: | 68.0% |
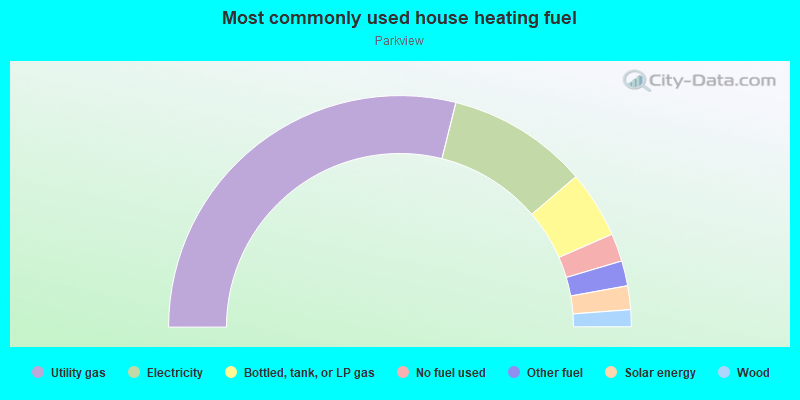
- 57.8%Utility gas
- 19.7%Electricity
- 9.4%Bottled, tank, or LP gas
- 3.9%No fuel used
- 3.5%Other fuel
- 3.3%Solar energy
- 2.4%Wood
Roads and streets:
Creely Ave
Length: 0.35 miles
Directions: E-W, N-S
Address range: 5000 to 5499
Directions: E-W, N-S
Address range: 5000 to 5499
Hartnett Ave
Length: 0.34 miles
Directions: E-W, SE-NW, SW-NE
Address range: 4700 to 5198
Directions: E-W, SE-NW, SW-NE
Address range: 4700 to 5198
Fleming Ave
Length: 0.33 miles
Direction: E-W
Address range: 3800 to 5399
Direction: E-W
Address range: 3800 to 5399
Gately Ave
Length: 0.32 miles
Direction: E-W
Address range: 5000 to 5499
Direction: E-W
Address range: 5000 to 5499
Cypress Ave
Length: 0.28 miles
Direction: E-W
Address range: 4700 to 5099
Direction: E-W
Address range: 4700 to 5099
Fallon Ave
Length: 0.22 miles
Directions: E-W, SW-NE
Address range: 5000 to 5399
Directions: E-W, SW-NE
Address range: 5000 to 5399
Ells Ln
Length: 0.19 miles
Direction: N-S
Direction: N-S
Potrero Ave
Length: 0.17 miles
Direction: E-W
Address range: 4801 to 5199
Direction: E-W
Address range: 4801 to 5199
Campbell St
Length: 0.16 miles
Direction: N-S
Address range: 1000 to 1199
Direction: N-S
Address range: 1000 to 1199
S 55th St
Length: 0.13 miles
Direction: N-S
Address range: 900 to 1099
Direction: N-S
Address range: 900 to 1099
Ells St
Length: 0.11 miles
Directions: N-S, SE-NW
Address range: 1100 to 1199
Directions: N-S, SE-NW
Address range: 1100 to 1199
S 47th St
Length: 0.11 miles
Directions: N-S, SW-NE
Address range: 800 to 899
Directions: N-S, SW-NE
Address range: 800 to 899
Arno Ct
Length: 0.09 miles
Directions: E-W, SE-NW
Address range: 4700 to 4799
Directions: E-W, SE-NW
Address range: 4700 to 4799
S 49th St
Length: 0.09 miles
Direction: N-S
Address range: 800 to 899
Direction: N-S
Address range: 800 to 899
Bayview Ave
Length: 0.06 miles
Direction: SW-NE
Address range: 4900 to 5002
Direction: SW-NE
Address range: 4900 to 5002
Other features:
Trl
Length: 0.23 miles
Directions: E-W, N-S, SE-NW, SW-NE
Directions: E-W, N-S, SE-NW, SW-NE