Parkview Terrace neighborhood in Ankeny, Iowa (IA), 50021 detailed profile
Settings
X


Business Search - 14 Million verified businesses
Area: 0.115 square miles
Population: 361
Population density:
| Parkview Terrace: | 3,133 people per square mile |
| Ankeny: | 4,305 people per square mile |

- 33787.5%White
- 215.5%Black
- 184.7%Hispanic or Latino
- 71.8%Asian
- 20.5%Two or more races

Median household income in 2022:
| Parkview Terrace: | $133,558 |
| Ankeny: | $103,578 |
Distribution of median household income
![Distribution of median household income]()
- 3Less than $10,000
- 8$10,000 to $19,999
- 10$20,000 to $29,999
- 21$30,000 to $39,999
- 4$40,000 to $49,999
- 13$50,000 to $59,999
- 13$60,000 to $74,999
- 10$75,000 to $99,999
- 12$100,000 to $124,999
- 33$125,000 to $149,999
- 25$150,000 to $199,999
- 17$200,000 or more

Distribution of owner-occupied house/condo value
![Distribution of owner-occupied house/condo value]()
- 8Less than $50,000
- 11$100,000 to $149,999
- 7$150,000 to $199,999
- 25$200,000 to $249,999
- 24$250,000 to $299,999
- 38$300,000 to $399,999
- 6$400,000 to $499,999
- 2$500,000 to $749,999
- 3$750,000 to $999,999

Distribution of rent paid by renters
![Distribution of rent paid by renters]()
- 2$400 to $499
- 1$500 to $599
- 1$600 to $699
- 4$700 to $799
- 14$800 to $899
- 3$900 to $999
- 8$1,000 to $1,249
- 4$1,250 to $1,499
- 4$1,500 to $1,999
- 13$2,000 or more

Median rent in 2022:
| Parkview Terrace: | $872 |
| Ankeny: | $1,134 |
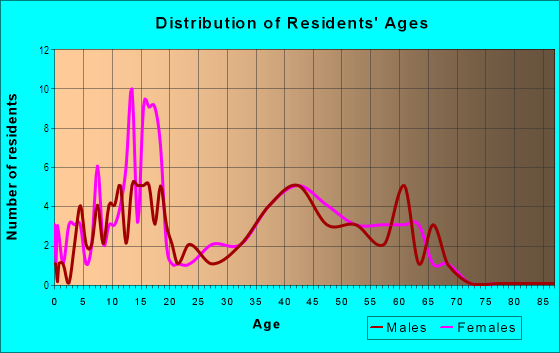
| Males: | 182 |
| Females: | 178 |
Males:
| This neighborhood: | 37.6 years |
| Whole city: | 33.7 years |
| This neighborhood: | 37.3 years |
| Whole city: | 34.6 years |
Average household size:
| Parkview Terrace: | 2.7 people |
| Ankeny: | 2.6 people |
Percentage of family households:
| Parkview Terrace: | 65.3% |
| Ankeny: | 57.8% |
| Here: | 81.5% |
| Ankeny: | 60.3% |
Percentage of married-couple families with children (among all households):
| Parkview Terrace: | 32.4% |
| Ankeny: | 32.4% |
Percentage of single-mother households (among all households):
| Parkview Terrace: | 4.5% |
| Ankeny: | 3.1% |
Percentage of never married males 15 years old and over:
Percentage of never married females 15 years old and over:
| Parkview Terrace: | 17.8% |
| Ankeny: | 16.6% |
Percentage of never married females 15 years old and over:
| Parkview Terrace: | 5.9% |
| city: | 12.2% |
Percentage of people that speak English not well or not at all:
| Parkview Terrace: | 0.3% |
| Ankeny: | 0.7% |
Percentage of people born in this state:
Percentage of people born in another U.S. state:
Percentage of native residents but born outside the U.S.:
Percentage of foreign born residents:
| Here: | 67.0% |
| Ankeny: | 71.3% |
Percentage of people born in another U.S. state:
| Parkview Terrace: | 25.9% |
| Ankeny: | 21.6% |
Percentage of native residents but born outside the U.S.:
| Here: | 1.4% |
| city: | 0.1% |
Percentage of foreign born residents:
| Here: | 5.6% |
| Ankeny: | 7.0% |

Owner-occupied
Renter-occupied


- Rooms in owner-occupied houses and condos in Parkview Terrace
- 01 room
- 02 rooms
- 03 rooms
- 34 rooms
- 255 rooms
- 186 rooms
- 127 rooms
- 418 rooms
- 369+ rooms

- Rooms in renter-occupied apartments in Parkview Terrace
- 41 room
- 32 rooms
- 63 rooms
- 94 rooms
- 55 rooms
- 46 rooms
- 17 rooms
- 48 rooms
- 29+ rooms
Owner-occupied
Renter-occupied

- Bedrooms in owner-occupied houses and condos in Parkview Terrace
- 0no bedroom
- 11 bedroom
- 162 bedrooms
- 523 bedrooms
- 504 bedrooms
- 55+ bedrooms

- Bedrooms in renter-occupied apartments in Parkview Terrace
- 4no bedroom
- 01 bedroom
- 192 bedrooms
- 23 bedrooms
- 54 bedrooms
- 05+ bedrooms
Average number of cars or other vehicles available in houses/condos:
Average number of cars or other vehicles available in apartments:
| This neighborhood: | 2.3 |
| Ankeny: | 2.1 |
Average number of cars or other vehicles available in apartments:
| Here: | 1.7 |
| city: | 1.5 |
Percentage of units with a mortgage:
| Parkview Terrace: | 74.4% |
| Ankeny: | 76.9% |
Average estimated value of detached houses in 2022 (84.0% of all units):
| Parkview Terrace: | $269,016 |
| Ankeny: | $342,034 |

- Year house built in Parkview Terrace
- 12020 or later
- 802010 to 2019
- 122000 to 2009
- 461990 to 1999
- 91980 to 1989
- 471970 to 1979
- 11960 to 1969
- 21950 to 1959
- 11940 to 1949
- 91939 or earlier

City-data.com crime index for city in 2020 (higher means more crime):
| City: | 106.4 |
| U.S. average: | 219.5 |
Travel time to work (commute)
![Travel time to work (commute)]()
- 12Less than 5 minutes
- 295 to 9 minutes
- 3810 to 14 minutes
- 3215 to 19 minutes
- 4720 to 24 minutes
- 1525 to 29 minutes
- 4430 to 34 minutes
- 335 to 39 minutes
- 1040 to 44 minutes
- 745 to 59 minutes
- 160 to 89 minutes
- 290 or more minutes

Means of transportation to work
![Means of transportation to work]()
- 68.1%144Drove a car alone
- 9.0%19Carpooled
- 2.4%5Walked
- 22.2%47Worked at home

Time leaving home to go to work
![Time leaving home to go to work]()
- 712:00 a.m. to 4:59 a.m.
- 55:00 a.m. to 5:29 a.m.
- 55:30 a.m. to 5:59 a.m.
- 216:00 a.m. to 6:29 a.m.
- 266:30 a.m. to 6:59 a.m.
- 417:00 a.m. to 7:29 a.m.
- 577:30 a.m. to 7:59 a.m.
- 308:00 a.m. to 8:29 a.m.
- 98:30 a.m. to 8:59 a.m.
- 89:00 a.m. to 9:59 a.m.
- 411:00 a.m. to 11:59 a.m.
- 1912:00 p.m. to 3:59 p.m.
- 114:00 p.m. to 11:59 p.m.

Occupations of males:
- Percentage of males in management occupations (except farmers):
Here: 16.0% city: 13.5%
- Percentage of males in business and financial operations occupations:
Here: 13.9% city: 10.5%
- Percentage of males in computer and mathematical occupations:
Here: 10.4% city: 9.4%
- Percentage of males in life, physical, and social science occupations:
Here: 1.9% city: 1.7%
- Percentage of males in legal occupations:
Here: 4.9% city: 1.6%
- Percentage of males in education, training, and library occupations:
Here: 2.6% city: 3.4%
- Percentage of males in arts, design, entertainment, sports, and media occupations:
Here: 1.5% city: 1.8%
- Percentage of males in healthcare practitioners and technical occupations:
Here: 2.3% city: 2.0%
- Percentage of males in service occupations:
Here: 10.7% city: 8.5%
- Percentage of males in sales and office occupations:
Here: 23.7% city: 18.1%
- Percentage of males in construction, extraction, and maintenance occupations:
Here: 8.0% city: 7.1%
- Percentage of males in production occupations:
Here: 10.9% city: 4.4%
- Percentage of males in transportation occupations:
Here: 5.6% city: 4.9%
Occupations of females:
- Percentage of females in management occupations (except farmers):
Here: 25.7% city: 9.2%
- Percentage of females in business and financial operations occupations:
Here: 15.1% city: 11.8%
- Percentage of females in computer and mathematical occupations:
Here: 5.5% city: 2.5%
- Percentage of females in life, physical, and social science occupations:
Here: 4.1% city: 1.0%
- Percentage of females in community and social services occupations:
Here: 7.7% city: 2.9%
- Percentage of females in legal occupations:
Here: 4.3% city: 1.2%
- Percentage of females in education, training, and library occupations:
Here: 13.7% city: 13.9%
- Percentage of females in arts, design, entertainment, sports, and media occupations:
Here: 3.8% city: 2.5%
- Percentage of females in healthcare practitioners and technical occupations:
Here: 18.0% city: 11.4%
- Percentage of females in service occupations:
Here: 16.7% city: 14.1%
- Percentage of females in sales and office occupations:
Here: 12.6% city: 24.0%
- Percentage of females in farming, fishing, and forestry occupations:
Here: 2.7% city: 0.4%
- Percentage of females in construction, extraction, and maintenance occupations:
Here: 1.1% city: 0.8%
Education in this neighborhood (subdivision or community):
- Percentage of people 3 years and older in K-12 schools:
Parkview Terrace: 18.6% Ankeny: 20.0%
- Percentage of people 3 years and older in undergraduate colleges:
Parkview Terrace: 8.5% Ankeny: 5.4%
- Percentage of people 3 years and older in grad. or professional schools:
Parkview Terrace: 2.8% Ankeny: 1.2%
- Percentage of students K-12 enrolled in private schools:
Parkview Terrace: 6.1% Ankeny: 7.3%
Percentage of population below poverty level:
| Parkview Terrace: | 7.1% |
| Ankeny: | 4.4% |
Median year owner moved in (as recorded in 2022):
Median year renter moved in (as recorded in 2022):
| Parkview Terrace: | 2005 |
| Ankeny: | 2016 |
Median year renter moved in (as recorded in 2022):
| Parkview Terrace: | 2019 |
| Ankeny: | 2022 |
Percentage of married-couple families with both working:
| Parkview Terrace: | 94.4% |
| Ankeny: | 86.2% |

- 73.1%Utility gas
- 15.9%Electricity
- 8.9%Bottled, tank, or LP gas
- 2.0%No fuel used
Roads and streets:
NW 9th St
Length: 0.51 miles
Direction: E-W
Address range: 201 to 699
Direction: E-W
Address range: 201 to 699
NW Kimberly Ln
Length: 0.41 miles
Directions: E-W, SW-NE
Address range: 300 to 599
Directions: E-W, SW-NE
Address range: 300 to 599
NW 5th St
Length: 0.38 miles
Directions: E-W, SE-NW
Address range: 200 to 599
Directions: E-W, SE-NW
Address range: 200 to 599
NW School St
Length: 0.25 miles
Directions: N-S, SE-NW
Address range: 454 to 899
Directions: N-S, SE-NW
Address range: 454 to 899
NW Cindy Ln
Length: 0.24 miles
Directions: E-W, SW-NE
Address range: 300 to 520
Directions: E-W, SW-NE
Address range: 300 to 520
NW Logan St
Length: 0.22 miles
Direction: N-S
Address range: 500 to 899
Direction: N-S
Address range: 500 to 899
NW Maple St
Length: 0.21 miles
Directions: N-S, SE-NW
Address range: 700 to 995
Directions: N-S, SE-NW
Address range: 700 to 995
NW Nickolas Dr
Length: 0.18 miles
Directions: E-W, SE-NW
Address range: 500 to 699
Directions: E-W, SE-NW
Address range: 500 to 699
NW Pleasant St
Length: 0.10 miles
Direction: N-S
Address range: 500 to 699
Direction: N-S
Address range: 500 to 699