Parkwood East Neighborhood Group neighborhood in Fort Collins, Colorado (CO), 80525 detailed profile
Settings
X


Business Search - 14 Million verified businesses
Area: 0.220 square miles
Population: 938
Population density:
| Parkwood East Neighborhood Group: | 4,254 people per square mile |
| Fort Collins: | 3,636 people per square mile |

- 67171.5%White
- 19020.2%Hispanic or Latino
- 424.5%Two or more races
- 151.6%American Indian
- 131.4%Asian
- 50.5%Black
- 30.3%Some other race

Median household income in 2022:
| Parkwood East Neighborhood Group: | $102,158 |
| Fort Collins: | $80,227 |
Distribution of median household income
![Distribution of median household income]()
- 9Less than $10,000
- 50$10,000 to $19,999
- 33$20,000 to $29,999
- 21$30,000 to $39,999
- 36$40,000 to $49,999
- 4$50,000 to $59,999
- 6$60,000 to $74,999
- 55$75,000 to $99,999
- 39$100,000 to $124,999
- 17$125,000 to $149,999
- 64$150,000 to $199,999
- 74$200,000 or more

Distribution of owner-occupied house/condo value
![Distribution of owner-occupied house/condo value]()
- 5Less than $50,000
- 9$100,000 to $149,999
- 4$150,000 to $199,999
- 16$200,000 to $249,999
- 8$250,000 to $299,999
- 6$300,000 to $399,999
- 59$400,000 to $499,999
- 119$500,000 to $749,999
- 19$750,000 to $999,999
- 26$1,000,000 or more

Distribution of rent paid by renters
![Distribution of rent paid by renters]()
- 5$900 to $999
- 46$1,000 to $1,249
- 43$1,250 to $1,499
- 110$1,500 to $1,999
- 46$2,000 or more

Median rent in 2022:
| Parkwood East Neighborhood Group: | $1,742 |
| Fort Collins: | $1,474 |
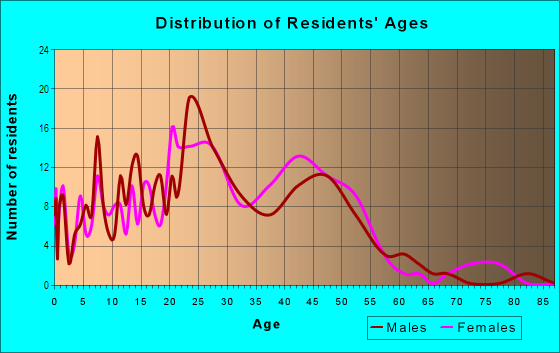
| Males: | 416 |
| Females: | 521 |
Males:
| This neighborhood: | 34.4 years |
| Whole city: | 30.2 years |
| This neighborhood: | 33.4 years |
| Whole city: | 30.8 years |
Average household size:
| Parkwood East Neighborhood Group: | 2.4 people |
| Fort Collins: | 2.2 people |
Percentage of family households:
| Parkwood East Neighborhood Group: | 53.5% |
| Fort Collins: | 37.9% |
| Here: | 49.1% |
| Fort Collins: | 40.8% |
Percentage of married-couple families with children (among all households):
| Parkwood East Neighborhood Group: | 37.4% |
| Fort Collins: | 31.7% |
Percentage of single-mother households (among all households):
| Parkwood East Neighborhood Group: | 7.3% |
| Fort Collins: | 8.9% |
Percentage of never married males 15 years old and over:
Percentage of never married females 15 years old and over:
| Parkwood East Neighborhood Group: | 17.0% |
| Fort Collins: | 24.1% |
Percentage of never married females 15 years old and over:
| Parkwood East Neighborhood Group: | 30.9% |
| city: | 21.4% |
Percentage of people that speak English not well or not at all:
| Parkwood East Neighborhood Group: | 0.2% |
| Fort Collins: | 0.8% |
Percentage of people born in this state:
Percentage of people born in another U.S. state:
Percentage of native residents but born outside the U.S.:
Percentage of foreign born residents:
| Here: | 38.4% |
| Fort Collins: | 36.7% |
Percentage of people born in another U.S. state:
| Parkwood East Neighborhood Group: | 57.5% |
| Fort Collins: | 56.5% |
Percentage of native residents but born outside the U.S.:
| Here: | 1.2% |
| city: | 1.1% |
Percentage of foreign born residents:
| Here: | 2.8% |
| Fort Collins: | 5.7% |

Owner-occupied
Renter-occupied


- Rooms in owner-occupied houses and condos in Parkwood East Neighborhood Group
- 41 room
- 02 rooms
- 83 rooms
- 94 rooms
- 55 rooms
- 206 rooms
- 357 rooms
- 388 rooms
- 839+ rooms

- Rooms in renter-occupied apartments in Parkwood East Neighborhood Group
- 51 room
- 62 rooms
- 313 rooms
- 404 rooms
- 405 rooms
- 646 rooms
- 177 rooms
- 28 rooms
- 89+ rooms
Owner-occupied
Renter-occupied

- Bedrooms in owner-occupied houses and condos in Parkwood East Neighborhood Group
- 4no bedroom
- 61 bedroom
- 412 bedrooms
- 853 bedrooms
- 594 bedrooms
- 375+ bedrooms

- Bedrooms in renter-occupied apartments in Parkwood East Neighborhood Group
- 5no bedroom
- 231 bedroom
- 1162 bedrooms
- 233 bedrooms
- 204 bedrooms
- 55+ bedrooms
Average number of cars or other vehicles available in houses/condos:
Average number of cars or other vehicles available in apartments:
| This neighborhood: | 2.3 |
| Fort Collins: | 2.1 |
Average number of cars or other vehicles available in apartments:
| Here: | 2.0 |
| city: | 1.7 |
Percentage of units with a mortgage:
| Parkwood East Neighborhood Group: | 73.5% |
| Fort Collins: | 66.9% |
Housing prices:
- Average estimated value of detached houses in 2022 (54.1% of all units):
Parkwood East Neighborhood Group: $673,344 Fort Collins: $637,436
- Average estimated value of townhouses or other attached units in 2022 (2.5% of all units):
This neighborhood: $379,969 city: $427,889
- Average estimated '22 value of housing units in 3-to-4-unit structures (5.0% of all units):
Parkwood East Neighborhood Group: $286,168 city: $332,381

- Year house built in Parkwood East Neighborhood Group
- 02020 or later
- 112010 to 2019
- 462000 to 2009
- 231990 to 1999
- 2441980 to 1989
- 501970 to 1979
- 71960 to 1969
- 51950 to 1959
- 41940 to 1949
- 181939 or earlier

City-data.com crime index for city in 2020 (higher means more crime):
| City: | 139.0 |
| U.S. average: | 219.5 |
Travel time to work (commute)
![Travel time to work (commute)]()
- 15Less than 5 minutes
- 875 to 9 minutes
- 20110 to 14 minutes
- 8415 to 19 minutes
- 6320 to 24 minutes
- 5225 to 29 minutes
- 2930 to 34 minutes
- 735 to 39 minutes
- 1140 to 44 minutes
- 1945 to 59 minutes
- 1060 to 89 minutes
- 790 or more minutes

Means of transportation to work
![Means of transportation to work]()
- 65.4%404Drove a car alone
- 7.4%46Carpooled
- 0.8%5Bus
- 1.3%8Bicycle
- 1.8%11Walked
- 0.5%3Other means
- 22.5%139Worked at home

Time leaving home to go to work
![Time leaving home to go to work]()
- 812:00 a.m. to 4:59 a.m.
- 35:00 a.m. to 5:29 a.m.
- 85:30 a.m. to 5:59 a.m.
- 376:00 a.m. to 6:29 a.m.
- 586:30 a.m. to 6:59 a.m.
- 767:00 a.m. to 7:29 a.m.
- 1137:30 a.m. to 7:59 a.m.
- 778:00 a.m. to 8:29 a.m.
- 338:30 a.m. to 8:59 a.m.
- 459:00 a.m. to 9:59 a.m.
- 5910:00 a.m. to 10:59 a.m.
- 1912:00 p.m. to 3:59 p.m.
- 414:00 p.m. to 11:59 p.m.

Occupations of males:
- Percentage of males in management occupations (except farmers):
Here: 12.4% city: 13.4%
- Percentage of males in business and financial operations occupations:
Here: 8.1% city: 4.9%
- Percentage of males in computer and mathematical occupations:
Here: 12.8% city: 7.7%
- Percentage of males in architecture and engineering occupations:
Here: 2.7% city: 6.2%
- Percentage of males in life, physical, and social science occupations:
Here: 7.4% city: 3.5%
- Percentage of males in community and social services occupations:
Here: 3.2% city: 1.4%
- Percentage of males in legal occupations:
Here: 1.5% city: 0.6%
- Percentage of males in healthcare practitioners and technical occupations:
Here: 7.7% city: 3.5%
- Percentage of males in service occupations:
Here: 11.8% city: 13.3%
- Percentage of males in sales and office occupations:
Here: 20.2% city: 15.5%
- Percentage of males in construction, extraction, and maintenance occupations:
Here: 2.2% city: 6.0%
- Percentage of males in transportation occupations:
Here: 4.6% city: 4.2%
- Percentage of males in material moving occupations:
Here: 1.5% city: 3.5%
Occupations of females:
- Percentage of females in management occupations (except farmers):
Here: 9.1% city: 9.7%
- Percentage of females in business and financial operations occupations:
Here: 8.8% city: 6.9%
- Percentage of females in computer and mathematical occupations:
Here: 1.1% city: 2.5%
- Percentage of females in architecture and engineering occupations:
Here: 3.4% city: 1.5%
- Percentage of females in community and social services occupations:
Here: 16.2% city: 3.9%
- Percentage of females in education, training, and library occupations:
Here: 4.7% city: 12.1%
- Percentage of females in arts, design, entertainment, sports, and media occupations:
Here: 1.7% city: 3.5%
- Percentage of females in healthcare practitioners and technical occupations:
Here: 4.8% city: 8.9%
- Percentage of females in service occupations:
Here: 40.0% city: 20.9%
- Percentage of females in sales and office occupations:
Here: 9.3% city: 23.2%
- Percentage of females in material moving occupations:
Here: 2.2% city: 0.9%
Education in this neighborhood (subdivision or community):
- Percentage of people 3 years and older in K-12 schools:
Parkwood East Neighborhood Group: 17.8% Fort Collins: 14.1%
- Percentage of people 3 years and older in undergraduate colleges:
Parkwood East Neighborhood Group: 10.1% Fort Collins: 16.7%
- Percentage of people 3 years and older in grad. or professional schools:
Parkwood East Neighborhood Group: 2.5% Fort Collins: 4.2%
- Percentage of students K-12 enrolled in private schools:
Parkwood East Neighborhood Group: 21.0% Fort Collins: 7.2%
Percentage of population below poverty level:
| Parkwood East Neighborhood Group: | 8.4% |
| Fort Collins: | 18.1% |
Median year owner moved in (as recorded in 2022):
Median year renter moved in (as recorded in 2022):
| Parkwood East Neighborhood Group: | 2010 |
| Fort Collins: | 2014 |
Median year renter moved in (as recorded in 2022):
| Parkwood East Neighborhood Group: | 2016 |
| Fort Collins: | 2021 |
Percentage of married-couple families with both working:
| Parkwood East Neighborhood Group: | 84.0% |
| Fort Collins: | 76.1% |

- 46.8%Utility gas
- 37.1%Electricity
- 7.2%Bottled, tank, or LP gas
- 7.0%No fuel used
- 1.8%Wood
Roads and streets:
Creekwood Dr
Length: 0.69 miles
Directions: E-W, N-S, SE-NW
Address range: 1700 to 2599
Directions: E-W, N-S, SE-NW
Address range: 1700 to 2599
Eastwood Dr
Length: 0.56 miles
Directions: E-W, N-S, SE-NW, SW-NE
Address range: 2000 to 2599
Directions: E-W, N-S, SE-NW, SW-NE
Address range: 2000 to 2599
Barnwood Dr
Length: 0.27 miles
Direction: E-W
Address range: 1600 to 1799
Direction: E-W
Address range: 1600 to 1799
Sagewood Dr
Length: 0.26 miles
Direction: E-W
Address range: 1600 to 1799
Direction: E-W
Address range: 1600 to 1799
Kirkwood Dr
Length: 0.26 miles
Directions: E-W, SE-NW, SW-NE
Address range: 1613 to 1998
Directions: E-W, SE-NW, SW-NE
Address range: 1613 to 1998
E Drake Rd
Length: 0.24 miles
Direction: E-W
Address range: 1600 to 1851
Direction: E-W
Address range: 1600 to 1851
Trailwood Dr
Length: 0.23 miles
Direction: E-W
Address range: 1600 to 1799
Direction: E-W
Address range: 1600 to 1799
Tanglewood Dr
Length: 0.20 miles
Direction: E-W
Address range: 1600 to 1799
Direction: E-W
Address range: 1600 to 1799
Dogwood Ct
Length: 0.13 miles
Direction: E-W
Address range: 1600 to 1699
Direction: E-W
Address range: 1600 to 1699
Eastwood Ct
Length: 0.11 miles
Direction: E-W
Address range: 1700 to 1799
Direction: E-W
Address range: 1700 to 1799
Creekwood Ct
Length: 0.07 miles
Directions: E-W, N-S, SE-NW, SW-NE
Address range: 2100 to 2199
Directions: E-W, N-S, SE-NW, SW-NE
Address range: 2100 to 2199
Rushwood Ct
Length: 0.04 miles
Directions: E-W, SE-NW
Address range: 1700 to 1799
Directions: E-W, SE-NW
Address range: 1700 to 1799
Parkwood East Driveway
Length: 0.04 miles
Direction: N-S
Direction: N-S
Barnwood Ct
Length: 0.04 miles
Direction: N-S
Address range: 2100 to 2199
Direction: N-S
Address range: 2100 to 2199
E Stuart St
Length: 0.03 miles
Direction: E-W
Address range: 1526 to 1699
Direction: E-W
Address range: 1526 to 1699
Keywood Ct
Length: 0.03 miles
Direction: N-S
Address range: 2100 to 2199
Direction: N-S
Address range: 2100 to 2199
Teakwood Ct
Length: 0.02 miles
Direction: SW-NE
Direction: SW-NE