Peter Cooper Village (Peter Cooper) neighborhood in New York, New York (NY), 10010 detailed profile
Settings
X


Business Search - 14 Million verified businesses
Area: 0.045 square miles
Population: 2,282
Population density:
| Peter Cooper Village (Peter Cooper): | 50,319 people per square mile |
| New York: | 27,483 people per square mile |

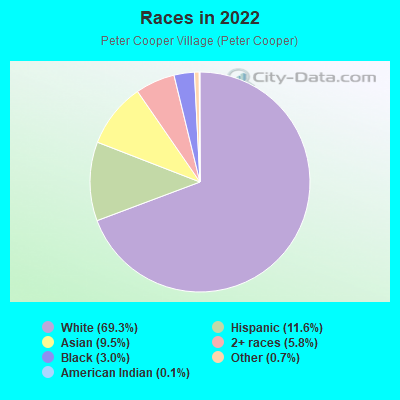
- 1,58269.3%White
- 26411.6%Hispanic or Latino
- 2179.5%Asian
- 1335.8%Two or more races
- 683.0%Black
- 160.7%Some other race
- 30.1%American Indian
Distribution of median household income
![Distribution of median household income]()
- 87Less than $10,000
- 159$10,000 to $19,999
- 32$20,000 to $29,999
- 62$30,000 to $39,999
- 17$40,000 to $49,999
- 32$50,000 to $59,999
- 27$60,000 to $74,999
- 57$75,000 to $99,999
- 85$100,000 to $124,999
- 41$125,000 to $149,999
- 130$150,000 to $199,999
- 482$200,000 or more

Distribution of owner-occupied house/condo value
![Distribution of owner-occupied house/condo value]()
- 4$50,000 to $99,999
- 97$100,000 to $149,999
- 9$300,000 to $399,999
- 97$400,000 to $499,999
- 169$500,000 to $749,999
- 204$750,000 to $999,999
- 367$1,000,000 or more

Distribution of rent paid by renters
![Distribution of rent paid by renters]()
- 27Less than $100
- 15$300 to $399
- 39$500 to $599
- 9$600 to $699
- 63$700 to $799
- 10$800 to $899
- 28$900 to $999
- 6$1,000 to $1,249
- 3$1,250 to $1,499
- 182$1,500 to $1,999
- 672$2,000 or more

Median rent in 2022:
| Peter Cooper Village (Peter Cooper): | $2,659 |
| New York: | $1,573 |
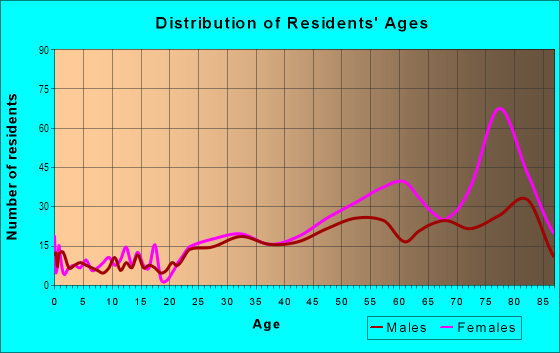
| Males: | 1,152 |
| Females: | 1,129 |
Males:
| This neighborhood: | 34.3 years |
| Whole city: | 37.0 years |
| This neighborhood: | 30.6 years |
| Whole city: | 39.8 years |
Average household size:
| Peter Cooper Village (Peter Cooper): | 1.9 people |
| New York: | 2.4 people |
Percentage of family households:
| Peter Cooper Village (Peter Cooper): | 41.8% |
| New York: | 38.3% |
| Here: | 55.8% |
| New York: | 34.8% |
Percentage of married-couple families with children (among all households):
| Peter Cooper Village (Peter Cooper): | 37.1% |
| New York: | 25.9% |
Percentage of single-mother households (among all households):
| Peter Cooper Village (Peter Cooper): | 2.7% |
| New York: | 11.8% |
Percentage of never married males 15 years old and over:
Percentage of never married females 15 years old and over:
| Peter Cooper Village (Peter Cooper): | 9.3% |
| New York: | 21.7% |
Percentage of never married females 15 years old and over:
| Peter Cooper Village (Peter Cooper): | 19.3% |
| city: | 22.4% |
Percentage of people that speak English not well or not at all:
| Peter Cooper Village (Peter Cooper): | 1.3% |
| New York: | 12.2% |
Percentage of people born in this state:
Percentage of people born in another U.S. state:
Percentage of native residents but born outside the U.S.:
Percentage of foreign born residents:
| Here: | 45.7% |
| New York: | 48.0% |
Percentage of people born in another U.S. state:
| Peter Cooper Village (Peter Cooper): | 30.2% |
| New York: | 11.7% |
Percentage of native residents but born outside the U.S.:
| Here: | 1.1% |
| city: | 3.6% |
Percentage of foreign born residents:
| Here: | 23.0% |
| New York: | 36.8% |
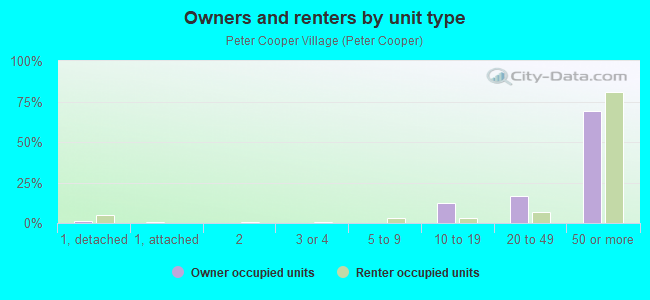
Owner-occupied
Renter-occupied

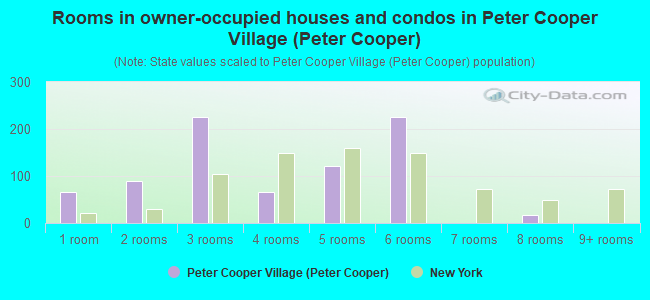
- Rooms in owner-occupied houses and condos in Peter Cooper Village <
> - 651 room
- 902 rooms
- 2253 rooms
- 654 rooms
- 1215 rooms
- 2256 rooms
- 07 rooms
- 178 rooms
- 09+ rooms
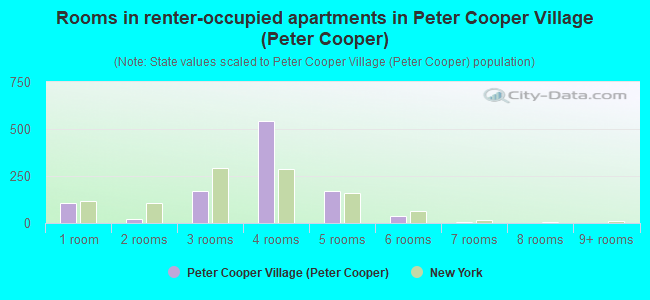
- Rooms in renter-occupied apartments in Peter Cooper Village <
> - 1091 room
- 222 rooms
- 1683 rooms
- 5424 rooms
- 1715 rooms
- 396 rooms
- 77 rooms
- 08 rooms
- 09+ rooms
Owner-occupied
Renter-occupied
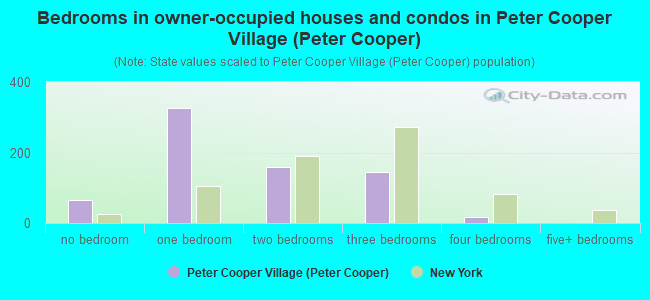
- Bedrooms in owner-occupied houses and condos in Peter Cooper Village <
> - 65no bedroom
- 3251 bedroom
- 1592 bedrooms
- 1453 bedrooms
- 174 bedrooms
- 05+ bedrooms
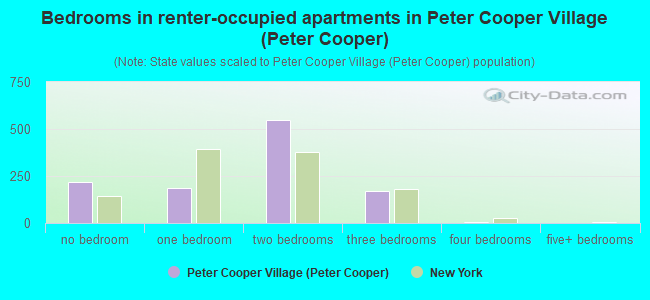
- Bedrooms in renter-occupied apartments in Peter Cooper Village <
> - 217no bedroom
- 1851 bedroom
- 5462 bedrooms
- 1723 bedrooms
- 74 bedrooms
- 05+ bedrooms
Average number of cars or other vehicles available in houses/condos:
Average number of cars or other vehicles available in apartments:
| This neighborhood: | |
| New York: |
Average number of cars or other vehicles available in apartments:
| Here: | 0.4 |
| city: | 0.4 |
Percentage of units with a mortgage:
| Peter Cooper Village (Peter Cooper): | 64.5% |
| New York: | 56.2% |
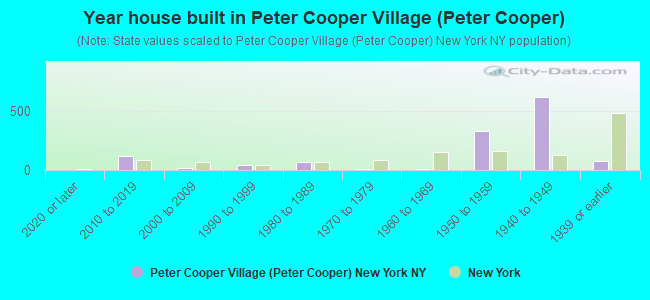
- Year house built in Peter Cooper Village <
> - 02020 or later
- 1142010 to 2019
- 152000 to 2009
- 381990 to 1999
- 671980 to 1989
- 91970 to 1979
- 71960 to 1969
- 3281950 to 1959
- 6121940 to 1949
- 761939 or earlier
City-data.com crime index for city in 2020 (higher means more crime):
| City: | 229.7 |
| U.S. average: | 219.5 |
Travel time to work (commute)
![Travel time to work (commute)]()
- 8Less than 5 minutes
- 215 to 9 minutes
- 5410 to 14 minutes
- 3915 to 19 minutes
- 11420 to 24 minutes
- 7425 to 29 minutes
- 16630 to 34 minutes
- 2935 to 39 minutes
- 5140 to 44 minutes
- 7845 to 59 minutes
- 3060 to 89 minutes
- 1190 or more minutes

Means of transportation to work
![Means of transportation to work]()
- 14.1%172Drove a car alone
- 0.5%6Carpooled
- 20.5%250Bus
- 26.7%326Subway or elevated rail
- 0.3%4Long-distance train or commuter rail
- 0.4%5Ferryboat
- 0.7%8Taxi
- 2.1%26Bicycle
- 6.6%81Walked
- 3.0%37Other means
- 28.4%347Worked at home

Time leaving home to go to work
![Time leaving home to go to work]()
- 312:00 a.m. to 4:59 a.m.
- 185:00 a.m. to 5:29 a.m.
- 25:30 a.m. to 5:59 a.m.
- 86:00 a.m. to 6:29 a.m.
- 426:30 a.m. to 6:59 a.m.
- 267:00 a.m. to 7:29 a.m.
- 767:30 a.m. to 7:59 a.m.
- 2428:00 a.m. to 8:29 a.m.
- 238:30 a.m. to 8:59 a.m.
- 1929:00 a.m. to 9:59 a.m.
- 2610:00 a.m. to 10:59 a.m.
- 1411:00 a.m. to 11:59 a.m.
- 2012:00 p.m. to 3:59 p.m.
- 14:00 p.m. to 11:59 p.m.

Occupations of males:
- Percentage of males in business and financial operations occupations:
Here: 9.9% city: 6.4%
- Percentage of males in computer and mathematical occupations:
Here: 14.1% city: 5.3%
- Percentage of males in architecture and engineering occupations:
Here: 4.1% city: 1.7%
- Percentage of males in life, physical, and social science occupations:
Here: 1.4% city: 1.0%
- Percentage of males in legal occupations:
Here: 3.8% city: 2.1%
- Percentage of males in healthcare practitioners and technical occupations:
Here: 12.7% city: 3.4%
- Percentage of males in service occupations:
Here: 8.8% city: 18.7%
- Percentage of males in sales and office occupations:
Here: 30.8% city: 15.0%
- Percentage of males in construction, extraction, and maintenance occupations:
Here: 13.6% city: 7.8%
Occupations of females:
- Percentage of females in management occupations (except farmers):
Here: 24.8% city: 10.4%
- Percentage of females in legal occupations:
Here: 2.9% city: 2.2%
- Percentage of females in education, training, and library occupations:
Here: 2.5% city: 9.5%
- Percentage of females in arts, design, entertainment, sports, and media occupations:
Here: 2.7% city: 4.9%
- Percentage of females in healthcare practitioners and technical occupations:
Here: 19.3% city: 7.8%
- Percentage of females in service occupations:
Here: 2.8% city: 25.1%
- Percentage of females in sales and office occupations:
Here: 44.9% city: 22.5%
Percentage of people 16-64 in Armed Forces:
| Peter Cooper Village (Peter Cooper): | 0.2% |
| New York: | 0.1% |
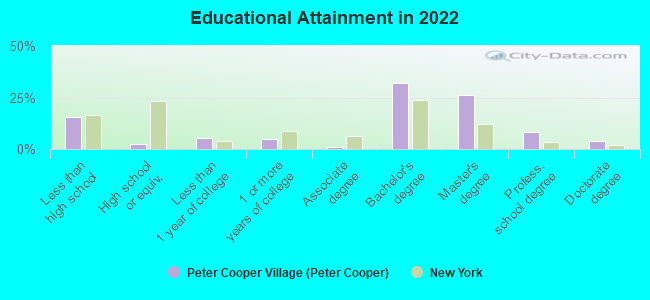
Education in this neighborhood (subdivision or community):
- Percentage of people 3 years and older in K-12 schools:
Peter Cooper Village (Peter Cooper): 25.6% New York: 15.2%
- Percentage of people 3 years and older in undergraduate colleges:
Peter Cooper Village (Peter Cooper): 18.2% New York: 5.1%
- Percentage of people 3 years and older in grad. or professional schools:
Peter Cooper Village (Peter Cooper): 2.3% New York: 2.1%
- Percentage of students K-12 enrolled in private schools:
Peter Cooper Village (Peter Cooper): 63.2% New York: 19.6%
Percentage of population below poverty level:
| Peter Cooper Village (Peter Cooper): | 3.0% |
| New York: | 18.3% |
Median year renter moved in (as recorded in 2022):
| Peter Cooper Village (Peter Cooper): | 2018 |
| New York: | 2016 |
Percentage of married-couple families with both working:
| Peter Cooper Village (Peter Cooper): | 77.3% |
| New York: | 65.6% |
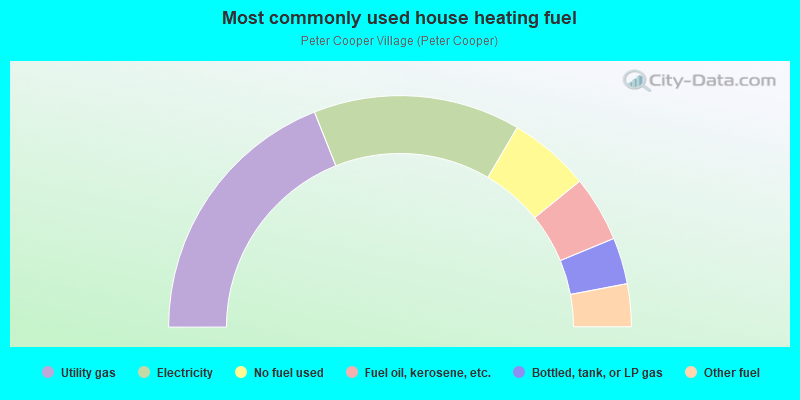
- 38.0%Utility gas
- 29.0%Electricity
- 11.4%No fuel used
- 9.2%Fuel oil, kerosene, etc.
- 6.5%Bottled, tank, or LP gas
- 6.0%Other fuel
Roads and streets:
Peter Cooper Rd
Length: 0.26 miles
Directions: E-W, SE-NW, SW-NE
Address range: 332 to 495
Directions: E-W, SE-NW, SW-NE
Address range: 332 to 495
F D R Dr
Length: 0.19 miles
Direction: N-S
Direction: N-S
E 20th St
Length: 0.12 miles
Directions: E-W, SE-NW
Address range: 541 to 698
Directions: E-W, SE-NW
Address range: 541 to 698
F D R Dr (Ave C)
Length: 0.04 miles
Direction: N-S
Address range: 361 to 377
Direction: N-S
Address range: 361 to 377