Pilgrim-Triton neighborhood in San Mateo, California (CA), 94404 detailed profile
Settings
X


Business Search - 14 Million verified businesses
Area: 0.077 square miles
Population: 421
Population density:
| Pilgrim-Triton: | 5,445 people per square mile |
| San Mateo: | 8,266 people per square mile |

- 22753.5%Asian
- 8419.8%White
- 4410.4%Black
- 317.3%Hispanic or Latino
- 286.6%Two or more races
- 40.9%Native Hawaiian and Other
Pacific Islander - 40.9%Some other race
- 20.5%American Indian

Median household income in 2022:
| Pilgrim-Triton: | $215,976 |
| San Mateo: | $159,275 |
Distribution of median household income
![Distribution of median household income]()
- 2Less than $10,000
- 2$10,000 to $19,999
- 16$20,000 to $29,999
- 5$30,000 to $39,999
- 4$40,000 to $49,999
- 11$50,000 to $59,999
- 8$60,000 to $74,999
- 8$75,000 to $99,999
- 6$100,000 to $124,999
- 6$125,000 to $149,999
- 25$150,000 to $199,999
- 94$200,000 or more

Distribution of owner-occupied house/condo value
![Distribution of owner-occupied house/condo value]()
- 2Less than $50,000
- 2$150,000 to $199,999
- 2$200,000 to $249,999
- 2$250,000 to $299,999
- 3$500,000 to $749,999
- 9$750,000 to $999,999
- 69$1,000,000 or more

Distribution of rent paid by renters
![Distribution of rent paid by renters]()
- 4$1,000 to $1,249
- 2$1,250 to $1,499
- 5$1,500 to $1,999
- 76$2,000 or more

Median rent in 2022:
| Pilgrim-Triton: | $2,922 |
| San Mateo: | $2,001 |
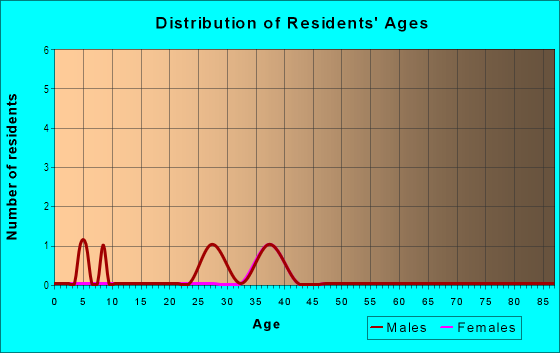
| Males: | 206 |
| Females: | 215 |
Males:
| This neighborhood: | 35.6 years |
| Whole city: | 37.8 years |
| This neighborhood: | 36.7 years |
| Whole city: | 40.5 years |
Average household size:
| Pilgrim-Triton: | 2.6 people |
| San Mateo: | 2.6 people |
Percentage of family households:
| Pilgrim-Triton: | 61.1% |
| San Mateo: | 41.3% |
| Here: | 61.1% |
| San Mateo: | 48.9% |
Percentage of married-couple families with children (among all households):
| Pilgrim-Triton: | 31.1% |
| San Mateo: | 29.2% |
Percentage of single-mother households (among all households):
| Pilgrim-Triton: | 6.8% |
| San Mateo: | 5.8% |
Percentage of never married males 15 years old and over:
Percentage of never married females 15 years old and over:
| Pilgrim-Triton: | 12.1% |
| San Mateo: | 18.2% |
Percentage of never married females 15 years old and over:
| Pilgrim-Triton: | 10.8% |
| city: | 17.0% |
Percentage of people that speak English not well or not at all:
| Pilgrim-Triton: | 0.0% |
| San Mateo: | 6.3% |
Percentage of people born in this state:
Percentage of people born in another U.S. state:
Percentage of native residents but born outside the U.S.:
Percentage of foreign born residents:
| Here: | 42.5% |
| San Mateo: | 48.0% |
Percentage of people born in another U.S. state:
| Pilgrim-Triton: | 13.8% |
| San Mateo: | 14.4% |
Percentage of native residents but born outside the U.S.:
| Here: | 1.3% |
| city: | 1.1% |
Percentage of foreign born residents:
| Here: | 42.4% |
| San Mateo: | 36.5% |

Owner-occupied
Renter-occupied


- Rooms in owner-occupied houses and condos in Pilgrim-Triton
- 11 room
- 02 rooms
- 43 rooms
- 114 rooms
- 185 rooms
- 206 rooms
- 127 rooms
- 68 rooms
- 39+ rooms

- Rooms in renter-occupied apartments in Pilgrim-Triton
- 121 room
- 92 rooms
- 223 rooms
- 244 rooms
- 75 rooms
- 56 rooms
- 27 rooms
- 08 rooms
- 19+ rooms
Owner-occupied
Renter-occupied

- Bedrooms in owner-occupied houses and condos in Pilgrim-Triton
- 1no bedroom
- 11 bedroom
- 122 bedrooms
- 453 bedrooms
- 174 bedrooms
- 45+ bedrooms

- Bedrooms in renter-occupied apartments in Pilgrim-Triton
- 12no bedroom
- 261 bedroom
- 332 bedrooms
- 83 bedrooms
- 34 bedrooms
- 15+ bedrooms
Average number of cars or other vehicles available in houses/condos:
Average number of cars or other vehicles available in apartments:
| This neighborhood: | 2.1 |
| San Mateo: | 2.0 |
Average number of cars or other vehicles available in apartments:
| Here: | 1.6 |
| city: | 1.4 |
Percentage of units with a mortgage:
| Pilgrim-Triton: | 82.3% |
| San Mateo: | 70.1% |

- Year house built in Pilgrim-Triton
- 22020 or later
- 22010 to 2019
- 202000 to 2009
- 211990 to 1999
- 111980 to 1989
- 631970 to 1979
- 601960 to 1969
- 61950 to 1959
- 11940 to 1949
- 51939 or earlier

City-data.com crime index for city in 2020 (higher means more crime):
| City: | 202.6 |
| U.S. average: | 219.5 |
Travel time to work (commute)
![Travel time to work (commute)]()
- 5Less than 5 minutes
- 285 to 9 minutes
- 1510 to 14 minutes
- 1515 to 19 minutes
- 2520 to 24 minutes
- 2925 to 29 minutes
- 4430 to 34 minutes
- 935 to 39 minutes
- 1540 to 44 minutes
- 2145 to 59 minutes
- 2160 to 89 minutes
- 790 or more minutes

Means of transportation to work
![Means of transportation to work]()
- 59.6%141Drove a car alone
- 13.5%32Carpooled
- 0.4%1Bus
- 0.4%1Subway or elevated rail
- 1.7%4Long-distance train or commuter rail
- 0.4%1Motorcycle
- 0.4%1Bicycle
- 0.8%2Other means
- 22.0%52Worked at home

Time leaving home to go to work
![Time leaving home to go to work]()
- 112:00 a.m. to 4:59 a.m.
- 15:00 a.m. to 5:29 a.m.
- 45:30 a.m. to 5:59 a.m.
- 186:00 a.m. to 6:29 a.m.
- 106:30 a.m. to 6:59 a.m.
- 187:00 a.m. to 7:29 a.m.
- 407:30 a.m. to 7:59 a.m.
- 308:00 a.m. to 8:29 a.m.
- 388:30 a.m. to 8:59 a.m.
- 539:00 a.m. to 9:59 a.m.
- 1210:00 a.m. to 10:59 a.m.
- 411:00 a.m. to 11:59 a.m.
- 912:00 p.m. to 3:59 p.m.
- 44:00 p.m. to 11:59 p.m.

Occupations of males:
- Percentage of males in management occupations (except farmers):
Here: 8.9% city: 17.3%
- Percentage of males in business and financial operations occupations:
Here: 12.1% city: 5.6%
- Percentage of males in computer and mathematical occupations:
Here: 36.0% city: 15.5%
- Percentage of males in architecture and engineering occupations:
Here: 12.4% city: 4.6%
- Percentage of males in life, physical, and social science occupations:
Here: 3.2% city: 2.6%
- Percentage of males in community and social services occupations:
Here: 3.5% city: 1.2%
- Percentage of males in legal occupations:
Here: 1.3% city: 1.3%
- Percentage of males in arts, design, entertainment, sports, and media occupations:
Here: 6.6% city: 2.2%
- Percentage of males in healthcare practitioners and technical occupations:
Here: 1.1% city: 3.6%
- Percentage of males in service occupations:
Here: 1.4% city: 11.1%
- Percentage of males in sales and office occupations:
Here: 10.9% city: 12.6%
- Percentage of males in transportation occupations:
Here: 1.6% city: 3.4%
Occupations of females:
- Percentage of females in management occupations (except farmers):
Here: 6.4% city: 15.9%
- Percentage of females in business and financial operations occupations:
Here: 5.9% city: 11.0%
- Percentage of females in computer and mathematical occupations:
Here: 31.6% city: 6.6%
- Percentage of females in architecture and engineering occupations:
Here: 5.7% city: 1.6%
- Percentage of females in life, physical, and social science occupations:
Here: 3.8% city: 3.9%
- Percentage of females in legal occupations:
Here: 3.0% city: 1.7%
- Percentage of females in education, training, and library occupations:
Here: 4.7% city: 6.9%
- Percentage of females in healthcare practitioners and technical occupations:
Here: 15.4% city: 8.3%
- Percentage of females in service occupations:
Here: 6.4% city: 16.0%
- Percentage of females in sales and office occupations:
Here: 16.6% city: 19.6%
- Percentage of females in construction, extraction, and maintenance occupations:
Here: 1.1% city: 0.0%
- Percentage of females in transportation occupations:
Here: 2.1% city: 0.8%
Percentage of people 16-64 in Armed Forces:
| Pilgrim-Triton: | 0.7% |
| San Mateo: | 0.0% |
Education in this neighborhood (subdivision or community):
- Percentage of people 3 years and older in K-12 schools:
Pilgrim-Triton: 16.1% San Mateo: 15.7%
- Percentage of people 3 years and older in undergraduate colleges:
Pilgrim-Triton: 2.9% San Mateo: 4.9%
- Percentage of people 3 years and older in grad. or professional schools:
Pilgrim-Triton: 0.5% San Mateo: 1.2%
- Percentage of students K-12 enrolled in private schools:
Pilgrim-Triton: 31.8% San Mateo: 18.6%
Percentage of population below poverty level:
| Pilgrim-Triton: | 1.4% |
| San Mateo: | 8.3% |
Median year owner moved in (as recorded in 2022):
Median year renter moved in (as recorded in 2022):
| Pilgrim-Triton: | 2007 |
| San Mateo: | 2009 |
Median year renter moved in (as recorded in 2022):
| Pilgrim-Triton: | 2017 |
| San Mateo: | 2021 |
Percentage of married-couple families with both working:
| Pilgrim-Triton: | 73.7% |
| San Mateo: | 66.4% |

- 52.3%Utility gas
- 43.6%Electricity
- 2.2%No fuel used
- 1.1%Other fuel
- 0.8%Bottled, tank, or LP gas
Limited-access highways (interstate or state) in this neighborhood:
J Arthur Younger Fwy (State Hwy 92)
Length: 0.60 miles
Directions: SE-NW, SW-NE
Directions: SE-NW, SW-NE
Roads and streets:
Foster City Blvd
Length: 0.34 miles
Direction: SE-NW
Address range: 500 to 599
Direction: SE-NW
Address range: 500 to 599
E Hillsdale Blvd
Length: 0.31 miles
Directions: N-S, SW-NE
Address range: 1100 to 1199
Directions: N-S, SW-NE
Address range: 1100 to 1199
Triton Dr
Length: 0.22 miles
Direction: SW-NE
Address range: 1100 to 1198
Direction: SW-NE
Address range: 1100 to 1198
Pilgrim Dr
Length: 0.18 miles
Directions: E-W, SE-NW
Address range: 500 to 599
Directions: E-W, SE-NW
Address range: 500 to 599
Metro Center Blvd
Length: 0.00 miles
Direction: SW-NE
Direction: SW-NE