Pine Forest (Park Forest) neighborhood in Menlo Park, California (CA), 94025, 94027 detailed profile
Settings
X


Business Search - 14 Million verified businesses
Area: 0.068 square miles
Population: 278
Population density:
| Pine Forest (Park Forest): | 4,079 people per square mile |
| Menlo Park: | 3,291 people per square mile |

- 15353.1%White
- 4114.2%Black
- 3311.5%Asian
- 269.0%Two or more races
- 238.0%Hispanic or Latino
- 113.8%Some other race
- 10.3%Native Hawaiian and Other
Pacific Islander

Median household income in 2022:
| Pine Forest (Park Forest): | $174,801 |
| Menlo Park: | $198,273 |
Distribution of median household income
![Distribution of median household income]()
- 3Less than $10,000
- 9$10,000 to $19,999
- 1$20,000 to $29,999
- 14$30,000 to $39,999
- 21$40,000 to $49,999
- 4$50,000 to $59,999
- 2$60,000 to $74,999
- 5$75,000 to $99,999
- 13$100,000 to $124,999
- 19$125,000 to $149,999
- 19$150,000 to $199,999
- 38$200,000 or more

Distribution of owner-occupied house/condo value
![Distribution of owner-occupied house/condo value]()
- 1Less than $50,000
- 2$200,000 to $249,999
- 1$400,000 to $499,999
- 2$500,000 to $749,999
- 2$750,000 to $999,999
- 20$1,000,000 or more

Distribution of rent paid by renters
![Distribution of rent paid by renters]()
- 1Less than $100
- 1$600 to $699
- 12$1,250 to $1,499
- 7$1,500 to $1,999
- 110$2,000 or more

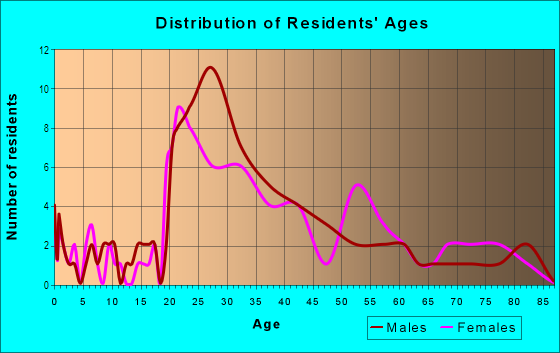
| Males: | 123 |
| Females: | 155 |
Males:
| This neighborhood: | 26.9 years |
| Whole city: | 38.8 years |
| This neighborhood: | 28.5 years |
| Whole city: | 38.4 years |
Average household size:
| Pine Forest (Park Forest): | 20.3 people |
| Menlo Park: | 2.8 people |
Percentage of family households:
| Pine Forest (Park Forest): | 39.7% |
| Menlo Park: | 51.2% |
| Here: | 21.0% |
| Menlo Park: | 55.9% |
Percentage of married-couple families with children (among all households):
| Pine Forest (Park Forest): | 20.7% |
| Menlo Park: | 30.8% |
Percentage of single-mother households (among all households):
| Pine Forest (Park Forest): | 27.8% |
| Menlo Park: | 3.7% |
Percentage of never married males 15 years old and over:
Percentage of never married females 15 years old and over:
| Pine Forest (Park Forest): | 31.5% |
| Menlo Park: | 16.1% |
Percentage of never married females 15 years old and over:
| Pine Forest (Park Forest): | 26.1% |
| city: | 17.3% |
Percentage of people that speak English not well or not at all:
| Pine Forest (Park Forest): | 0.4% |
| Menlo Park: | 3.1% |
Percentage of people born in this state:
Percentage of people born in another U.S. state:
Percentage of native residents but born outside the U.S.:
Percentage of foreign born residents:
| Here: | 39.3% |
| Menlo Park: | 43.6% |
Percentage of people born in another U.S. state:
| Pine Forest (Park Forest): | 25.7% |
| Menlo Park: | 24.7% |
Percentage of native residents but born outside the U.S.:
| Here: | 0.7% |
| city: | 2.0% |
Percentage of foreign born residents:
| Here: | 34.3% |
| Menlo Park: | 29.6% |

Owner-occupied
Renter-occupied


- Rooms in owner-occupied houses and condos in Pine Forest <
> - 01 room
- 02 rooms
- 33 rooms
- 24 rooms
- 75 rooms
- 16 rooms
- 37 rooms
- 08 rooms
- 39+ rooms

- Rooms in renter-occupied apartments in Pine Forest <
> - 51 room
- 172 rooms
- 203 rooms
- 444 rooms
- 335 rooms
- 36 rooms
- 37 rooms
- 28 rooms
- 29+ rooms
Owner-occupied
Renter-occupied

- Bedrooms in owner-occupied houses and condos in Pine Forest <
> - 0no bedroom
- 11 bedroom
- 32 bedrooms
- 93 bedrooms
- 64 bedrooms
- 65+ bedrooms

- Bedrooms in renter-occupied apartments in Pine Forest <
> - 9no bedroom
- 441 bedroom
- 542 bedrooms
- 193 bedrooms
- 24 bedrooms
- 05+ bedrooms
Average number of cars or other vehicles available in houses/condos:
Average number of cars or other vehicles available in apartments:
| This neighborhood: | 0.9 |
| Menlo Park: | 2.1 |
Average number of cars or other vehicles available in apartments:
| Here: | 1.1 |
| city: | 1.3 |
Percentage of units with a mortgage:
| Pine Forest (Park Forest): | 64.1% |
| Menlo Park: | 65.7% |
Average estimated value of detached houses in 2022 (9.2% of all units):
| Pine Forest (Park Forest): | $6,711,229 |
| California: | $988,808 |

- Year house built in Pine Forest <
> - 02020 or later
- 22010 to 2019
- 62000 to 2009
- 51990 to 1999
- 291980 to 1989
- 81970 to 1979
- 521960 to 1969
- 341950 to 1959
- 221940 to 1949
- 31939 or earlier

City-data.com crime index for city in 2020 (higher means more crime):
| City: | 154.0 |
| U.S. average: | 219.5 |
Travel time to work (commute)
![Travel time to work (commute)]()
- 65 to 9 minutes
- 1810 to 14 minutes
- 2515 to 19 minutes
- 2620 to 24 minutes
- 1025 to 29 minutes
- 1430 to 34 minutes
- 135 to 39 minutes
- 540 to 44 minutes
- 645 to 59 minutes
- 460 to 89 minutes
- 190 or more minutes

Means of transportation to work
![Means of transportation to work]()
- 36.9%58Drove a car alone
- 17.2%27Carpooled
- 0.6%1Bus
- 12.1%19Long-distance train or commuter rail
- 14.6%23Bicycle
- 3.2%5Walked
- 1.3%2Other means
- 16.5%26Worked at home

Time leaving home to go to work
![Time leaving home to go to work]()
- 26:00 a.m. to 6:29 a.m.
- 46:30 a.m. to 6:59 a.m.
- 57:00 a.m. to 7:29 a.m.
- 137:30 a.m. to 7:59 a.m.
- 248:00 a.m. to 8:29 a.m.
- 258:30 a.m. to 8:59 a.m.
- 199:00 a.m. to 9:59 a.m.
- 1310:00 a.m. to 10:59 a.m.
- 711:00 a.m. to 11:59 a.m.
- 312:00 p.m. to 3:59 p.m.
- 54:00 p.m. to 11:59 p.m.

Occupations of males:
- Percentage of males in management occupations (except farmers):
Here: 13.7% city: 22.6%
- Percentage of males in business and financial operations occupations:
Here: 8.5% city: 6.6%
- Percentage of males in computer and mathematical occupations:
Here: 33.1% city: 15.2%
- Percentage of males in architecture and engineering occupations:
Here: 3.5% city: 4.4%
- Percentage of males in community and social services occupations:
Here: 3.6% city: 0.7%
- Percentage of males in legal occupations:
Here: 3.6% city: 3.6%
- Percentage of males in education, training, and library occupations:
Here: 5.1% city: 5.5%
- Percentage of males in service occupations:
Here: 3.3% city: 9.1%
- Percentage of males in sales and office occupations:
Here: 12.8% city: 12.2%
- Percentage of males in construction, extraction, and maintenance occupations:
Here: 1.3% city: 3.8%
- Percentage of males in production occupations:
Here: 1.9% city: 1.1%
- Percentage of males in transportation occupations:
Here: 1.5% city: 2.2%
Occupations of females:
- Percentage of females in management occupations (except farmers):
Here: 16.3% city: 19.5%
- Percentage of females in computer and mathematical occupations:
Here: 8.9% city: 5.8%
- Percentage of females in life, physical, and social science occupations:
Here: 23.9% city: 9.4%
- Percentage of females in community and social services occupations:
Here: 4.1% city: 2.2%
- Percentage of females in legal occupations:
Here: 4.8% city: 2.7%
- Percentage of females in education, training, and library occupations:
Here: 19.8% city: 14.1%
- Percentage of females in healthcare practitioners and technical occupations:
Here: 12.0% city: 8.2%
- Percentage of females in service occupations:
Here: 11.9% city: 8.0%
- Percentage of females in sales and office occupations:
Here: 2.1% city: 13.8%
- Percentage of females in transportation occupations:
Here: 1.2% city: 0.1%
Education in this neighborhood (subdivision or community):
- Percentage of people 3 years and older in K-12 schools:
Pine Forest (Park Forest): 14.9% Menlo Park: 16.8%
- Percentage of people 3 years and older in undergraduate colleges:
Pine Forest (Park Forest): 4.8% Menlo Park: 4.3%
- Percentage of people 3 years and older in grad. or professional schools:
Pine Forest (Park Forest): 3.3% Menlo Park: 4.2%
- Percentage of students K-12 enrolled in private schools:
Pine Forest (Park Forest): 17.5% Menlo Park: 17.2%
Percentage of population below poverty level:
| Pine Forest (Park Forest): | 4.6% |
| Menlo Park: | 5.5% |
Median year owner moved in (as recorded in 2022):
| Pine Forest (Park Forest): | 2013 |
| Menlo Park: | 2005 |
Percentage of married-couple families with both working:
| Pine Forest (Park Forest): | 75.9% |
| Menlo Park: | 69.7% |

- 54.4%Utility gas
- 33.8%Electricity
- 6.1%Bottled, tank, or LP gas
- 3.3%Solar energy
- 2.4%No fuel used
Highways in this neighborhood:
State Hwy 82 (el Camino Real)
Length: 0.15 miles
Direction: SE-NW
Address range: 1600 to 1699
Direction: SE-NW
Address range: 1600 to 1699
Roads and streets:
Stone Pine Ln
Length: 0.22 miles
Directions: N-S, SE-NW, SW-NE
Address range: 100 to 1509
Directions: N-S, SE-NW, SW-NE
Address range: 100 to 1509
Encinal Ave
Length: 0.16 miles
Direction: SW-NE
Address range: 420 to 599
Direction: SW-NE
Address range: 420 to 599
Garwood Way
Length: 0.15 miles
Direction: SE-NW
Address range: 400 to 1431
Direction: SE-NW
Address range: 400 to 1431
Forest Ln
Length: 0.07 miles
Directions: SE-NW, SW-NE
Address range: 100 to 199
Directions: SE-NW, SW-NE
Address range: 100 to 199
Railroad features:
Union Pacific RR
Length: 0.14 miles
Direction: SE-NW
Direction: SE-NW