Pinehurst neighborhood in Des Moines, Iowa (IA), 50315 detailed profile
Settings
X


Business Search - 14 Million verified businesses
Area: 0.094 square miles
Population: 269
Population density:
| Pinehurst: | 2,867 people per square mile |
| Des Moines: | 2,783 people per square mile |

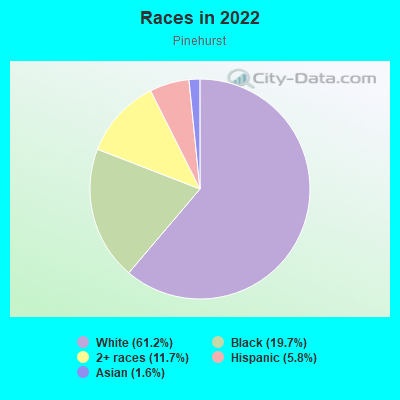
- 18961.2%White
- 6119.7%Black
- 3611.7%Two or more races
- 185.8%Hispanic or Latino
- 51.6%Asian
Median household income in 2022:
| Pinehurst: | $40,759 |
| Des Moines: | $58,018 |
Distribution of median household income
![Distribution of median household income]()
- 36Less than $10,000
- 37$10,000 to $19,999
- 20$20,000 to $29,999
- 28$30,000 to $39,999
- 56$40,000 to $49,999
- 18$50,000 to $59,999
- 8$60,000 to $74,999
- 16$75,000 to $99,999
- 43$100,000 to $124,999
- 6$125,000 to $149,999
- 25$150,000 to $199,999
- 15$200,000 or more

Distribution of owner-occupied house/condo value
![Distribution of owner-occupied house/condo value]()
- 7Less than $50,000
- 43$50,000 to $99,999
- 18$100,000 to $149,999
- 72$150,000 to $199,999
- 34$200,000 to $249,999
- 26$250,000 to $299,999
- 11$300,000 to $399,999
- 11$400,000 to $499,999
- 4$750,000 to $999,999

Distribution of rent paid by renters
![Distribution of rent paid by renters]()
- 25$200 to $299
- 21$300 to $399
- 6$400 to $499
- 8$500 to $599
- 19$600 to $699
- 31$700 to $799
- 52$800 to $899
- 37$900 to $999
- 18$1,000 to $1,249
- 30$1,250 to $1,499
- 5$1,500 to $1,999

Median rent in 2022:
| Pinehurst: | $814 |
| Des Moines: | $873 |
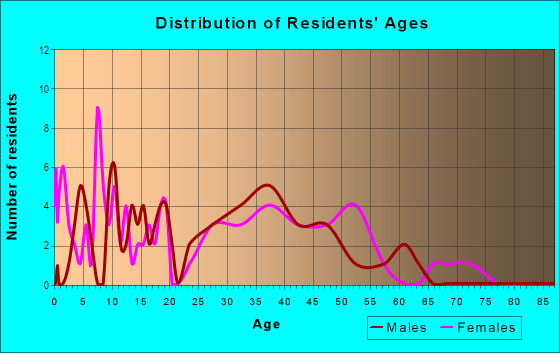
| Males: | 122 |
| Females: | 147 |
Males:
| This neighborhood: | 34.6 years |
| Whole city: | 34.7 years |
| This neighborhood: | 44.5 years |
| Whole city: | 35.5 years |
Average household size:
| Pinehurst: | 1.4 people |
| Des Moines: | 2.2 people |
Percentage of family households:
| Pinehurst: | 15.7% |
| Des Moines: | 40.8% |
| Here: | 18.7% |
| Des Moines: | 32.7% |
Percentage of married-couple families with children (among all households):
| Pinehurst: | 57.7% |
| Des Moines: | 26.2% |
Percentage of single-mother households (among all households):
| Pinehurst: | 199.6% |
| Des Moines: | 14.0% |
Percentage of never married males 15 years old and over:
Percentage of never married females 15 years old and over:
| Pinehurst: | 26.5% |
| Des Moines: | 21.4% |
Percentage of never married females 15 years old and over:
| Pinehurst: | 14.3% |
| city: | 19.3% |
Percentage of people born in this state:
Percentage of people born in another U.S. state:
Percentage of native residents but born outside the U.S.:
Percentage of foreign born residents:
| Here: | 75.3% |
| Des Moines: | 64.1% |
Percentage of people born in another U.S. state:
| Pinehurst: | 15.3% |
| Des Moines: | 19.2% |
Percentage of native residents but born outside the U.S.:
| Here: | 0.5% |
| city: | 0.5% |
Percentage of foreign born residents:
| Here: | 8.8% |
| Des Moines: | 16.2% |
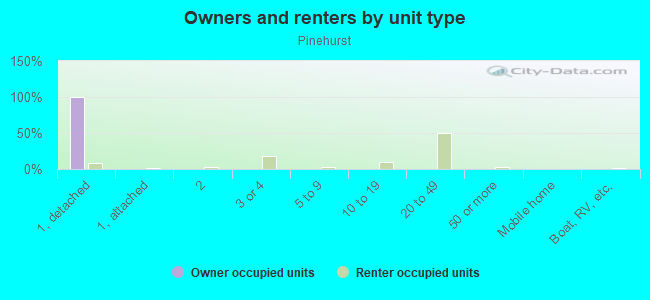
Owner-occupied
Renter-occupied

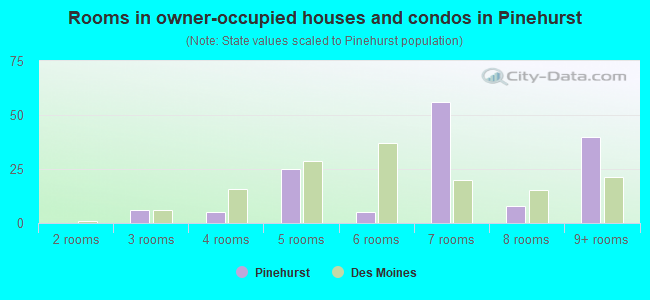
- Rooms in owner-occupied houses and condos in Pinehurst
- 01 room
- 02 rooms
- 63 rooms
- 54 rooms
- 255 rooms
- 56 rooms
- 567 rooms
- 88 rooms
- 409+ rooms
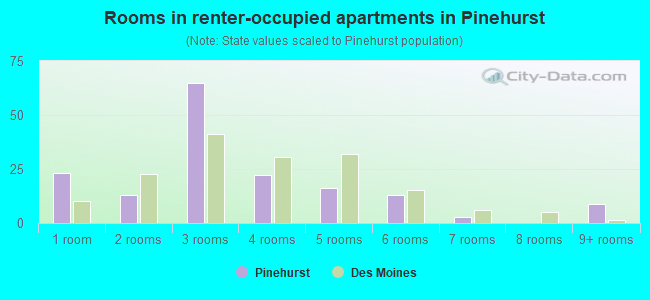
- Rooms in renter-occupied apartments in Pinehurst
- 231 room
- 132 rooms
- 653 rooms
- 224 rooms
- 165 rooms
- 136 rooms
- 37 rooms
- 08 rooms
- 99+ rooms
Owner-occupied
Renter-occupied
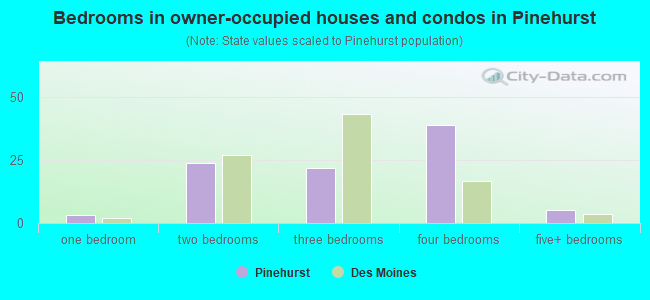
- Bedrooms in owner-occupied houses and condos in Pinehurst
- 0no bedroom
- 31 bedroom
- 242 bedrooms
- 223 bedrooms
- 394 bedrooms
- 55+ bedrooms
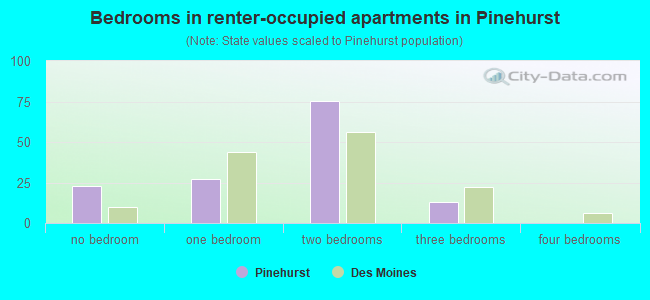
- Bedrooms in renter-occupied apartments in Pinehurst
- 23no bedroom
- 271 bedroom
- 752 bedrooms
- 133 bedrooms
- 04 bedrooms
- 05+ bedrooms
Average number of cars or other vehicles available in houses/condos:
Average number of cars or other vehicles available in apartments:
| This neighborhood: | 1.6 |
| Des Moines: | 1.9 |
Average number of cars or other vehicles available in apartments:
| Here: | 0.6 |
| city: | 1.2 |
Percentage of units with a mortgage:
| Pinehurst: | 62.5% |
| Des Moines: | 69.7% |
Average estimated value of detached houses in 2022 (35.6% of all units):
| Pinehurst: | $120,105 |
| Des Moines: | $201,532 |
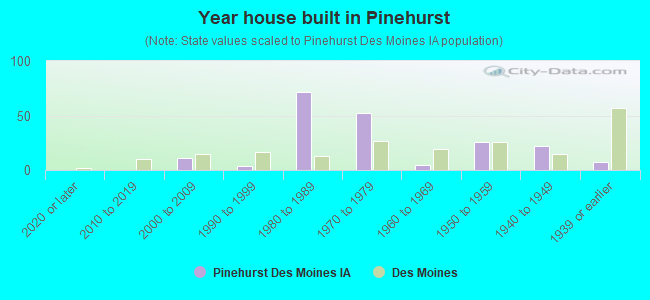
- Year house built in Pinehurst
- 02020 or later
- 02010 to 2019
- 112000 to 2009
- 41990 to 1999
- 721980 to 1989
- 521970 to 1979
- 51960 to 1969
- 261950 to 1959
- 221940 to 1949
- 71939 or earlier
City-data.com crime index for city in 2020 (higher means more crime):
| City: | 422.4 |
| U.S. average: | 219.5 |
Travel time to work (commute)
![Travel time to work (commute)]()
- 24Less than 5 minutes
- 745 to 9 minutes
- 11510 to 14 minutes
- 9415 to 19 minutes
- 13420 to 24 minutes
- 1325 to 29 minutes
- 2630 to 34 minutes
- 3435 to 39 minutes
- 840 to 44 minutes
- 1645 to 59 minutes
- 460 to 89 minutes
- 1290 or more minutes

Means of transportation to work
![Means of transportation to work]()
- 70.5%99Drove a car alone
- 9.3%13Carpooled
- 7.1%10Bus
- 3.6%5Ferryboat
- 8.5%12Bicycle
- 2.8%4Walked
- 29.2%41Worked at home

Time leaving home to go to work
![Time leaving home to go to work]()
- 1712:00 a.m. to 4:59 a.m.
- 335:00 a.m. to 5:29 a.m.
- 365:30 a.m. to 5:59 a.m.
- 276:00 a.m. to 6:29 a.m.
- 366:30 a.m. to 6:59 a.m.
- 1227:00 a.m. to 7:29 a.m.
- 767:30 a.m. to 7:59 a.m.
- 518:00 a.m. to 8:29 a.m.
- 148:30 a.m. to 8:59 a.m.
- 299:00 a.m. to 9:59 a.m.
- 1310:00 a.m. to 10:59 a.m.
- 3312:00 p.m. to 3:59 p.m.
- 514:00 p.m. to 11:59 p.m.

Occupations of males:
- Percentage of males in management occupations (except farmers):
Here: 91.1% city: 9.3%
- Percentage of males in business and financial operations occupations:
Here: 14.6% city: 5.5%
- Percentage of males in computer and mathematical occupations:
Here: 24.3% city: 6.0%
- Percentage of males in architecture and engineering occupations:
Here: 17.0% city: 2.3%
- Percentage of males in life, physical, and social science occupations:
Here: 41.3% city: 1.1%
- Percentage of males in legal occupations:
Here: 18.2% city: 1.4%
- Percentage of males in education, training, and library occupations:
Here: 25.5% city: 2.1%
- Percentage of males in healthcare practitioners and technical occupations:
Here: 14.6% city: 2.2%
- Percentage of males in service occupations:
Here: 27.1% city: 13.1%
- Percentage of males in sales and office occupations:
Here: 5.7% city: 15.2%
- Percentage of males in construction, extraction, and maintenance occupations:
Here: 20.4% city: 10.0%
- Percentage of males in production occupations:
Here: 52.2% city: 9.9%
- Percentage of males in transportation occupations:
Here: 85.0% city: 6.3%
- Percentage of males in material moving occupations:
Here: 40.0% city: 7.2%
Occupations of females:
- Percentage of females in management occupations (except farmers):
Here: 8.6% city: 8.5%
- Percentage of females in computer and mathematical occupations:
Here: 56.3% city: 2.5%
- Percentage of females in community and social services occupations:
Here: 17.1% city: 2.1%
- Percentage of females in legal occupations:
Here: 78.3% city: 1.3%
- Percentage of females in education, training, and library occupations:
Here: 124.8% city: 7.0%
- Percentage of females in healthcare practitioners and technical occupations:
Here: 9.4% city: 7.6%
- Percentage of females in service occupations:
Here: 14.4% city: 23.4%
- Percentage of females in sales and office occupations:
Here: 67.6% city: 27.7%
- Percentage of females in construction, extraction, and maintenance occupations:
Here: 26.9% city: 0.5%
- Percentage of females in production occupations:
Here: 31.8% city: 5.0%
- Percentage of females in material moving occupations:
Here: 217.7% city: 2.1%
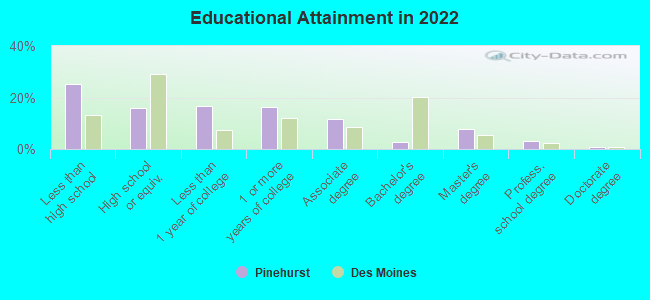
Education in this neighborhood (subdivision or community):
- Percentage of people 3 years and older in K-12 schools:
Pinehurst: 66.5% Des Moines: 17.5%
- Percentage of people 3 years and older in undergraduate colleges:
Pinehurst: 20.8% Des Moines: 3.7%
- Percentage of people 3 years and older in grad. or professional schools:
Pinehurst: 0.0% Des Moines: 1.6%
- Percentage of students K-12 enrolled in private schools:
Pinehurst: 2.2% Des Moines: 6.9%
Percentage of population below poverty level:
| Pinehurst: | 13.7% |
| Des Moines: | 14.7% |
Median year owner moved in (as recorded in 2022):
Median year renter moved in (as recorded in 2022):
| Pinehurst: | 1995 |
| Des Moines: | 2011 |
Median year renter moved in (as recorded in 2022):
| Pinehurst: | 2019 |
| Des Moines: | 2020 |
Percentage of married-couple families with both working:
| Pinehurst: | 504.3% |
| Des Moines: | 73.4% |
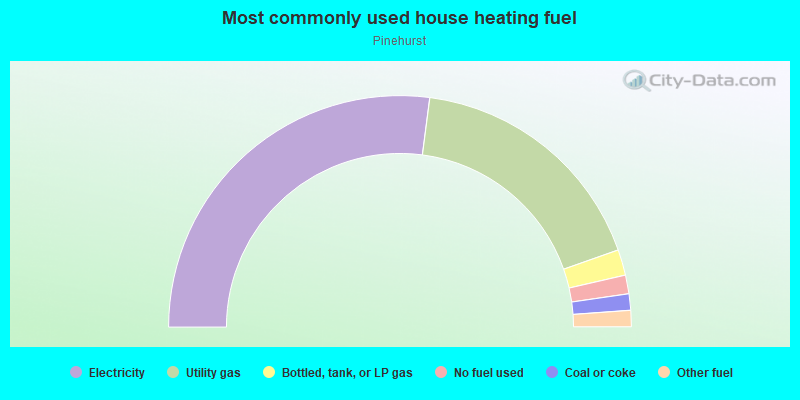
- 54.2%Electricity
- 35.1%Utility gas
- 3.6%Bottled, tank, or LP gas
- 2.6%No fuel used
- 2.3%Coal or coke
- 2.3%Other fuel
Roads and streets:
Titus Ave (SW Titus Ave)
Length: 0.33 miles
Direction: E-W
Address range: 900 to 1199
Direction: E-W
Address range: 900 to 1199
Hackley Ave (SW Hackley Ave)
Length: 0.33 miles
Direction: E-W
Address range: 900 to 1199
Direction: E-W
Address range: 900 to 1199
Evans St
Length: 0.17 miles
Direction: E-W
Address range: 1000 to 1199
Direction: E-W
Address range: 1000 to 1199
SW 12th St
Length: 0.13 miles
Direction: N-S
Address range: 4900 to 5099
Direction: N-S
Address range: 4900 to 5099
SW 10th St
Length: 0.13 miles
Direction: N-S
Address range: 4800 to 5099
Direction: N-S
Address range: 4800 to 5099
SW 9th St
Length: 0.11 miles
Direction: N-S
Address range: 4901 to 5099
Direction: N-S
Address range: 4901 to 5099