Pleasant Valley neighborhood in Mobile, Alabama (AL), 36606 detailed profile
Settings
X


Business Search - 14 Million verified businesses
Area: 0.536 square miles
Population: 1,375
Population density:
| Pleasant Valley: | 2,567 people per square mile |
| Mobile: | 1,555 people per square mile |

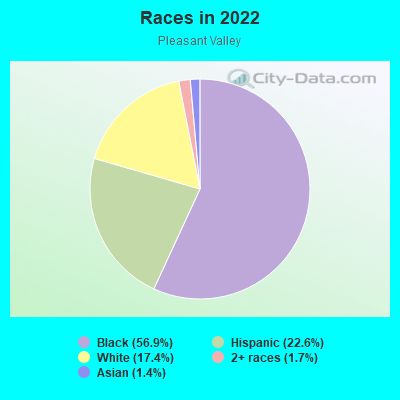
- 97256.9%Black
- 38722.6%Hispanic or Latino
- 29717.4%White
- 291.7%Two or more races
- 241.4%Asian
Median household income in 2022:
| Pleasant Valley: | $40,282 |
| Mobile: | $50,051 |
Distribution of median household income
![Distribution of median household income]()
- 15Less than $10,000
- 81$10,000 to $19,999
- 88$20,000 to $29,999
- 136$30,000 to $39,999
- 74$40,000 to $49,999
- 56$50,000 to $59,999
- 14$60,000 to $74,999
- 75$75,000 to $99,999
- 12$100,000 to $124,999
- 19$125,000 to $149,999
- 25$150,000 to $199,999
- 9$200,000 or more

Distribution of owner-occupied house/condo value
![Distribution of owner-occupied house/condo value]()
- 38Less than $50,000
- 73$50,000 to $99,999
- 66$100,000 to $149,999
- 29$150,000 to $199,999
- 12$200,000 to $249,999
- 4$250,000 to $299,999
- 4$300,000 to $399,999

Distribution of rent paid by renters
![Distribution of rent paid by renters]()
- 11$100 to $199
- 19$200 to $299
- 47$300 to $399
- 59$400 to $499
- 77$500 to $599
- 122$600 to $699
- 76$700 to $799
- 39$800 to $899
- 50$900 to $999
- 23$1,000 to $1,249
- 16$1,250 to $1,499
- 24$1,500 to $1,999

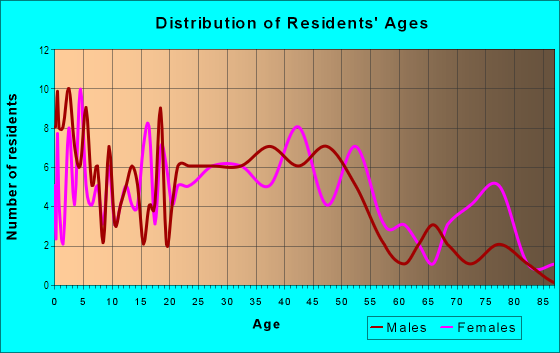
| Males: | 558 |
| Females: | 817 |
Males:
| This neighborhood: | 29.1 years |
| Whole city: | 36.3 years |
| This neighborhood: | 37.0 years |
| Whole city: | 38.3 years |
Average household size:
| Pleasant Valley: | 3.0 people |
| Mobile: | 2.3 people |
Percentage of family households:
| Pleasant Valley: | 59.0% |
| Mobile: | 38.6% |
| Here: | 30.6% |
| Mobile: | 33.1% |
Percentage of married-couple families with children (among all households):
| Pleasant Valley: | 15.6% |
| Mobile: | 19.2% |
Percentage of single-mother households (among all households):
| Pleasant Valley: | 14.7% |
| Mobile: | 20.9% |
Percentage of never married males 15 years old and over:
Percentage of never married females 15 years old and over:
| Pleasant Valley: | 18.0% |
| Mobile: | 20.9% |
Percentage of never married females 15 years old and over:
| Pleasant Valley: | 29.1% |
| city: | 21.5% |
Percentage of people that speak English not well or not at all:
| Pleasant Valley: | 1.6% |
| Mobile: | 0.7% |
Percentage of people born in this state:
Percentage of people born in another U.S. state:
Percentage of native residents but born outside the U.S.:
Percentage of foreign born residents:
| Here: | 66.2% |
| Mobile: | 75.1% |
Percentage of people born in another U.S. state:
| Pleasant Valley: | 16.7% |
| Mobile: | 20.1% |
Percentage of native residents but born outside the U.S.:
| Here: | 0.3% |
| city: | 0.7% |
Percentage of foreign born residents:
| Here: | 16.8% |
| Mobile: | 4.1% |
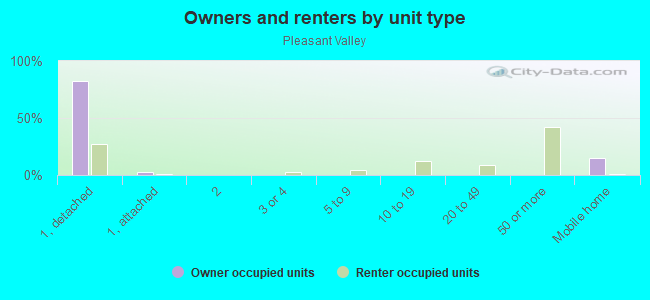
Owner-occupied
Renter-occupied

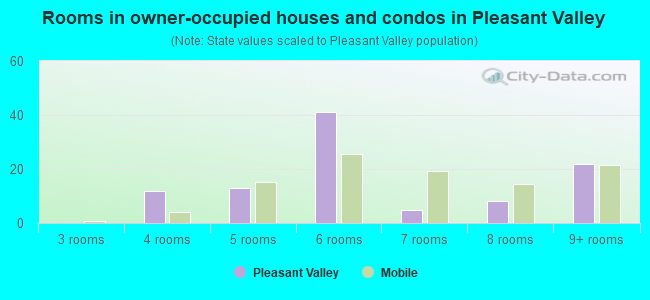
- Rooms in owner-occupied houses and condos in Pleasant Valley
- 01 room
- 02 rooms
- 03 rooms
- 124 rooms
- 135 rooms
- 416 rooms
- 57 rooms
- 88 rooms
- 229+ rooms
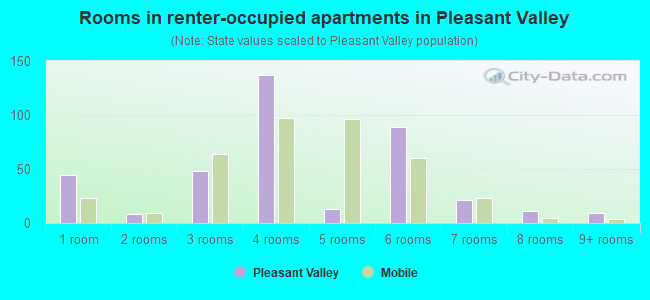
- Rooms in renter-occupied apartments in Pleasant Valley
- 441 room
- 82 rooms
- 483 rooms
- 1374 rooms
- 135 rooms
- 896 rooms
- 217 rooms
- 118 rooms
- 99+ rooms
Owner-occupied
Renter-occupied
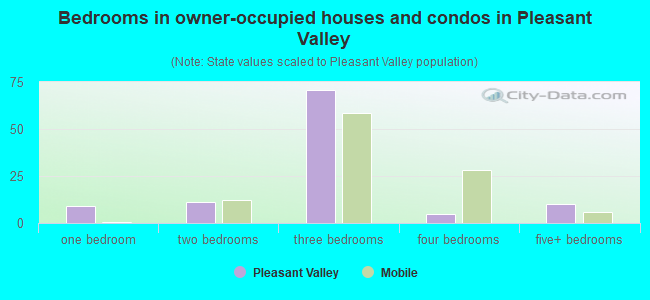
- Bedrooms in owner-occupied houses and condos in Pleasant Valley
- 0no bedroom
- 91 bedroom
- 112 bedrooms
- 713 bedrooms
- 54 bedrooms
- 105+ bedrooms
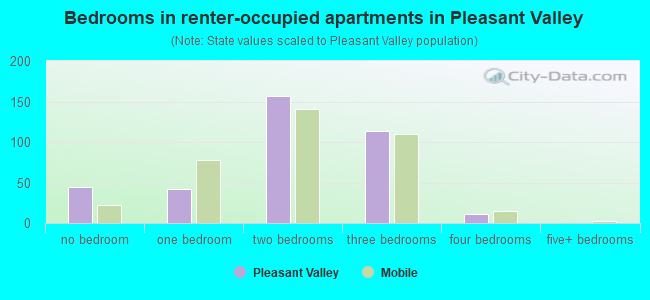
- Bedrooms in renter-occupied apartments in Pleasant Valley
- 44no bedroom
- 421 bedroom
- 1572 bedrooms
- 1143 bedrooms
- 114 bedrooms
- 05+ bedrooms
Average number of cars or other vehicles available in houses/condos:
Average number of cars or other vehicles available in apartments:
| This neighborhood: | 1.8 |
| Mobile: | 2.0 |
Average number of cars or other vehicles available in apartments:
| Here: | 1.6 |
| city: | 1.2 |
Percentage of units with a mortgage:
| Pleasant Valley: | 50.1% |
| Mobile: | 60.2% |
Average estimated value of detached houses in 2022 (60.0% of all units):
| Pleasant Valley: | $112,998 |
| Alabama: | $273,076 |
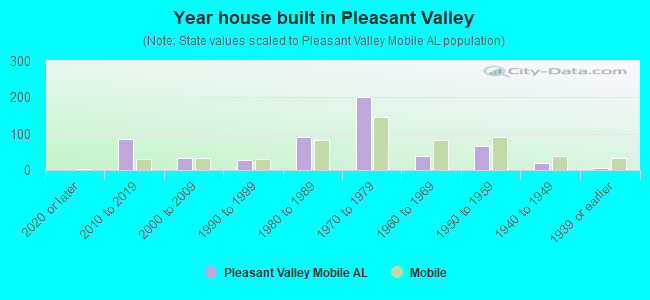
- Year house built in Pleasant Valley
- 02020 or later
- 852010 to 2019
- 322000 to 2009
- 281990 to 1999
- 911980 to 1989
- 2001970 to 1979
- 381960 to 1969
- 671950 to 1959
- 191940 to 1949
- 61939 or earlier
City-data.com crime index for city in 2020 (higher means more crime):
| City: | 93.1 |
| U.S. average: | 219.5 |
Travel time to work (commute)
![Travel time to work (commute)]()
- 16Less than 5 minutes
- 725 to 9 minutes
- 6510 to 14 minutes
- 23115 to 19 minutes
- 19220 to 24 minutes
- 1325 to 29 minutes
- 5030 to 34 minutes
- 1935 to 39 minutes
- 340 to 44 minutes
- 9445 to 59 minutes
- 560 to 89 minutes
- 990 or more minutes

Means of transportation to work
![Means of transportation to work]()
- 88.1%463Drove a car alone
- 9.5%50Carpooled
- 0.6%3Taxi
- 1.3%7Motorcycle
- 1.1%6Walked
- 2.5%13Other means
- 3.4%18Worked at home

Time leaving home to go to work
![Time leaving home to go to work]()
- 3712:00 a.m. to 4:59 a.m.
- 635:00 a.m. to 5:29 a.m.
- 615:30 a.m. to 5:59 a.m.
- 356:00 a.m. to 6:29 a.m.
- 586:30 a.m. to 6:59 a.m.
- 1437:00 a.m. to 7:29 a.m.
- 1307:30 a.m. to 7:59 a.m.
- 498:00 a.m. to 8:29 a.m.
- 88:30 a.m. to 8:59 a.m.
- 1249:00 a.m. to 9:59 a.m.
- 210:00 a.m. to 10:59 a.m.
- 511:00 a.m. to 11:59 a.m.
- 3812:00 p.m. to 3:59 p.m.
- 674:00 p.m. to 11:59 p.m.

Occupations of males:
- Percentage of males in management occupations (except farmers):
Here: 7.8% city: 10.5%
- Percentage of males in business and financial operations occupations:
Here: 3.0% city: 4.4%
- Percentage of males in computer and mathematical occupations:
Here: 3.0% city: 2.1%
- Percentage of males in community and social services occupations:
Here: 2.8% city: 1.4%
- Percentage of males in legal occupations:
Here: 3.5% city: 1.4%
- Percentage of males in healthcare practitioners and technical occupations:
Here: 2.0% city: 4.1%
- Percentage of males in service occupations:
Here: 10.6% city: 15.4%
- Percentage of males in sales and office occupations:
Here: 4.3% city: 15.0%
- Percentage of males in construction, extraction, and maintenance occupations:
Here: 25.0% city: 8.1%
- Percentage of males in production occupations:
Here: 18.5% city: 8.4%
- Percentage of males in transportation occupations:
Here: 5.1% city: 8.0%
- Percentage of males in material moving occupations:
Here: 20.8% city: 7.4%
Occupations of females:
- Percentage of females in management occupations (except farmers):
Here: 6.6% city: 7.9%
- Percentage of females in business and financial operations occupations:
Here: 3.6% city: 5.3%
- Percentage of females in computer and mathematical occupations:
Here: 2.2% city: 1.7%
- Percentage of females in architecture and engineering occupations:
Here: 1.3% city: 0.6%
- Percentage of females in life, physical, and social science occupations:
Here: 2.5% city: 0.6%
- Percentage of females in community and social services occupations:
Here: 5.3% city: 2.5%
- Percentage of females in legal occupations:
Here: 1.7% city: 1.2%
- Percentage of females in education, training, and library occupations:
Here: 9.2% city: 10.5%
- Percentage of females in arts, design, entertainment, sports, and media occupations:
Here: 2.5% city: 1.5%
- Percentage of females in healthcare practitioners and technical occupations:
Here: 5.4% city: 10.9%
- Percentage of females in service occupations:
Here: 50.5% city: 23.0%
- Percentage of females in sales and office occupations:
Here: 9.7% city: 27.3%
- Percentage of females in production occupations:
Here: 8.1% city: 2.7%
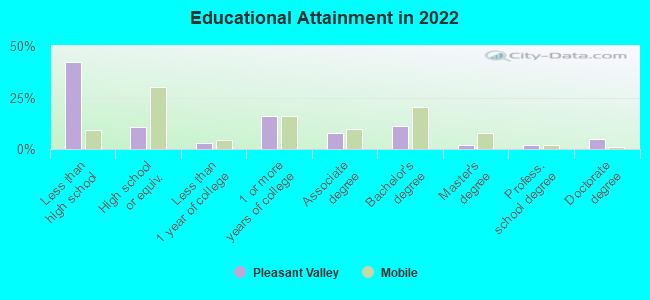
Education in this neighborhood (subdivision or community):
- Percentage of people 3 years and older in K-12 schools:
Pleasant Valley: 25.6% Mobile: 15.7%
- Percentage of people 3 years and older in undergraduate colleges:
Pleasant Valley: 2.2% Mobile: 5.9%
- Percentage of people 3 years and older in grad. or professional schools:
Pleasant Valley: 6.2% Mobile: 1.6%
- Percentage of students K-12 enrolled in private schools:
Pleasant Valley: 11.6% Mobile: 21.3%
Percentage of population below poverty level:
| Pleasant Valley: | 31.6% |
| Mobile: | 22.9% |
Median year owner moved in (as recorded in 2022):
Median year renter moved in (as recorded in 2022):
| Pleasant Valley: | 1999 |
| Mobile: | 2006 |
Median year renter moved in (as recorded in 2022):
| Pleasant Valley: | 2018 |
| Mobile: | 2019 |
Percentage of married-couple families with both working:
| Pleasant Valley: | 199.2% |
| Mobile: | 82.2% |
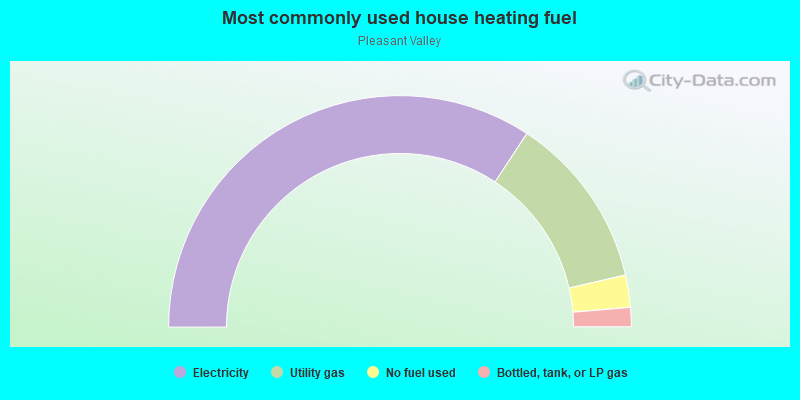
- 68.5%Electricity
- 24.3%Utility gas
- 4.5%No fuel used
- 2.7%Bottled, tank, or LP gas
Highways in this neighborhood:
Government Blvd (US Hwy 90, State Rte 16)
Length: 1.20 miles
Direction: SW-NE
Direction: SW-NE
Roads and streets:
Pleasant Valley Rd
Length: 1.16 miles
Directions: E-W, SE-NW, SW-NE
Address range: 2800 to 3293
Directions: E-W, SE-NW, SW-NE
Address range: 2800 to 3293
S Beltline Hwy
Length: 0.76 miles
Directions: E-W, N-S, SE-NW, SW-NE
Address range: 1401 to 1799
Directions: E-W, N-S, SE-NW, SW-NE
Address range: 1401 to 1799
Delmar Dr
Length: 0.35 miles
Directions: N-S, SE-NW
Address range: 900 to 1099
Directions: N-S, SE-NW
Address range: 900 to 1099
Shady Brook Dr
Length: 0.30 miles
Direction: N-S
Address range: 900 to 1099
Direction: N-S
Address range: 900 to 1099
Farnell Ln
Length: 0.29 miles
Direction: N-S
Address range: 900 to 1099
Direction: N-S
Address range: 900 to 1099
S Angus Dr
Length: 0.28 miles
Directions: E-W, SE-NW
Address range: 3000 to 3199
Directions: E-W, SE-NW
Address range: 3000 to 3199
Kendale Dr
Length: 0.27 miles
Directions: E-W, SE-NW
Address range: 3000 to 3199
Directions: E-W, SE-NW
Address range: 3000 to 3199
Kenny St
Length: 0.27 miles
Directions: N-S, SW-NE
Address range: 900 to 999
Directions: N-S, SW-NE
Address range: 900 to 999
Emelda Dr
Length: 0.25 miles
Directions: N-S, SW-NE
Address range: 900 to 999
Directions: N-S, SW-NE
Address range: 900 to 999
Brossett St
Length: 0.24 miles
Direction: E-W
Address range: 2850 to 2999
Direction: E-W
Address range: 2850 to 2999
Executive Park Dr
Length: 0.20 miles
Directions: N-S, SE-NW, SW-NE
Address range: 734 to 899
Directions: N-S, SE-NW, SW-NE
Address range: 734 to 899
Executive Park Cir
Length: 0.17 miles
Directions: E-W, N-S, SW-NE
Address range: 3200 to 3299
Directions: E-W, N-S, SW-NE
Address range: 3200 to 3299
Magnolia Rd
Length: 0.16 miles
Direction: N-S
Address range: 874 to 2799
Direction: N-S
Address range: 874 to 2799
Pleasant Valley Cir
Length: 0.15 miles
Directions: E-W, SW-NE
Directions: E-W, SW-NE
Myra Dr
Length: 0.13 miles
Directions: N-S, SW-NE
Address range: 750 to 899
Directions: N-S, SW-NE
Address range: 750 to 899
Platt Ave
Length: 0.10 miles
Direction: N-S
Address range: 804 to 899
Direction: N-S
Address range: 804 to 899
Olene St
Length: 0.10 miles
Directions: E-W, SE-NW
Address range: 3000 to 3110
Directions: E-W, SE-NW
Address range: 3000 to 3110
N Angus Dr
Length: 0.07 miles
Direction: SE-NW
Address range: 3088 to 3135
Direction: SE-NW
Address range: 3088 to 3135
Lundys Ln
Length: 0.07 miles
Direction: N-S
Address range: 700 to 1145
Direction: N-S
Address range: 700 to 1145
Sullivan Ave
Length: 0.05 miles
Direction: N-S
Address range: 864 to 899
Direction: N-S
Address range: 864 to 899
San Ed Dr
Length: 0.04 miles
Direction: N-S
Address range: 900 to 999
Direction: N-S
Address range: 900 to 999
Yeager Ct
Length: 0.04 miles
Directions: N-S, SW-NE
Address range: 900 to 999
Directions: N-S, SW-NE
Address range: 900 to 999
Joann Ct
Length: 0.02 miles
Direction: E-W
Address range: 3100 to 3199
Direction: E-W
Address range: 3100 to 3199
Genevieve Ct
Length: 0.02 miles
Direction: E-W
Address range: 3100 to 3199
Direction: E-W
Address range: 3100 to 3199
Other features:
Bolton Crk
Length: 0.79 miles
Directions: E-W, SE-NW
Directions: E-W, SE-NW