Potrero Valley neighborhood in Newbury Park, California (CA), 91320 detailed profile
Settings
X


Area: 0.152 square miles
Population: 622
Population density: 4,081 people per square mile

- 51081.9%White
- 497.9%Hispanic or Latino
- 436.9%Asian
- 172.7%Two or more races
- 40.6%Black

Median household income in 2022:
| Potrero Valley: | $167,986 |
| California: | $91,551 |
Distribution of median household income
![Distribution of median household income]()
- 8$10,000 to $19,999
- 12$20,000 to $29,999
- 8$40,000 to $49,999
- 16$50,000 to $59,999
- 13$60,000 to $74,999
- 26$75,000 to $99,999
- 15$100,000 to $124,999
- 35$125,000 to $149,999
- 55$150,000 to $199,999
- 89$200,000 or more

Distribution of owner-occupied house/condo value
![Distribution of owner-occupied house/condo value]()
- 3$100,000 to $149,999
- 3$300,000 to $399,999
- 5$400,000 to $499,999
- 49$500,000 to $749,999
- 87$750,000 to $999,999
- 95$1,000,000 or more

Distribution of rent paid by renters
![Distribution of rent paid by renters]()
- 39$2,000 or more

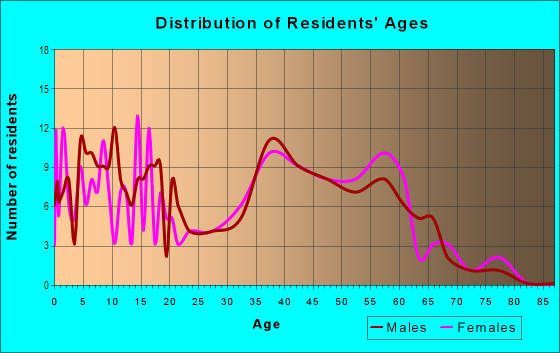
| Males: | 286 |
| Females: | 336 |
| Males: | 49.1 years |
| Females: | 54.1 years |
Average household size:
| Potrero Valley: | 3.0 people |
| California: | 2.8 people |
Percentage of family households:
| Potrero Valley: | 26.4% |
| California: | 46.8% |
| Here: | 72.8% |
| California: | 48.1% |
Percentage of married-couple families with children (among all households):
| Potrero Valley: | 36.6% |
| California: | 48.8% |
Percentage of single-mother households (among all households):
| Potrero Valley: | 6.6% |
| California: | 7.1% |
Percentage of never married males 15 years old and over:
Percentage of never married females 15 years old and over:
| Potrero Valley: | 9.0% |
| California: | 20.6% |
Percentage of never married females 15 years old and over:
| Potrero Valley: | 10.7% |
| California: | 17.7% |
Percentage of people that speak English not well or not at all:
| Potrero Valley: | 2.9% |
| California: | 9.1% |
Percentage of people born in this state:
Percentage of people born in another U.S. state:
Percentage of native residents but born outside the U.S.:
Percentage of foreign born residents:
| Here: | 60.4% |
| California: | 56.8% |
Percentage of people born in another U.S. state:
| Potrero Valley: | 23.8% |
| California: | 14.9% |
Percentage of native residents but born outside the U.S.:
| Here: | 0.0% |
| California: | 1.5% |
Percentage of foreign born residents:
| Here: | 15.8% |
| California: | 26.7% |

Owner-occupied
Renter-occupied


- Rooms in owner-occupied houses and condos in Potrero Valley
- 01 room
- 02 rooms
- 03 rooms
- 34 rooms
- 275 rooms
- 456 rooms
- 577 rooms
- 178 rooms
- 799+ rooms

- Rooms in renter-occupied apartments in Potrero Valley
- 01 room
- 02 rooms
- 03 rooms
- 34 rooms
- 55 rooms
- 46 rooms
- 127 rooms
- 08 rooms
- 09+ rooms
Owner-occupied
Renter-occupied

- Bedrooms in owner-occupied houses and condos in Potrero Valley
- 0no bedroom
- 01 bedroom
- 42 bedrooms
- 753 bedrooms
- 1324 bedrooms
- 205+ bedrooms

- Bedrooms in renter-occupied apartments in Potrero Valley
- 0no bedroom
- 01 bedroom
- 82 bedrooms
- 53 bedrooms
- 124 bedrooms
- 05+ bedrooms
Average number of cars or other vehicles available in houses/condos:
Average number of cars or other vehicles available in apartments:
| This neighborhood: | 1.8 |
| California: | 2.3 |
Average number of cars or other vehicles available in apartments:
| Here: | 2.1 |
| California: | 1.6 |
Percentage of units with a mortgage:
| Potrero Valley: | 83.2% |
| California: | 67.1% |
Average estimated value of detached houses in 2022 (100.0% of all units):
| Potrero Valley: | $935,832 |
| California: | $988,808 |

- Year house built in Potrero Valley
- 02020 or later
- 02010 to 2019
- 52000 to 2009
- 61990 to 1999
- 531980 to 1989
- 401970 to 1979
- 1291960 to 1969
- 201950 to 1959
- 01940 to 1949
- 41939 or earlier

Travel time to work (commute)
![Travel time to work (commute)]()
- 12Less than 5 minutes
- 185 to 9 minutes
- 4110 to 14 minutes
- 6315 to 19 minutes
- 5820 to 24 minutes
- 1725 to 29 minutes
- 1130 to 34 minutes
- 135 to 39 minutes
- 1640 to 44 minutes
- 1145 to 59 minutes
- 560 to 89 minutes
- 690 or more minutes

Means of transportation to work
![Means of transportation to work]()
- 78.2%291Drove a car alone
- 7.8%29Carpooled
- 1.6%6Walked
- 12.9%48Worked at home

Time leaving home to go to work
![Time leaving home to go to work]()
- 112:00 a.m. to 4:59 a.m.
- 35:00 a.m. to 5:29 a.m.
- 85:30 a.m. to 5:59 a.m.
- 86:00 a.m. to 6:29 a.m.
- 226:30 a.m. to 6:59 a.m.
- 277:00 a.m. to 7:29 a.m.
- 277:30 a.m. to 7:59 a.m.
- 618:00 a.m. to 8:29 a.m.
- 288:30 a.m. to 8:59 a.m.
- 69:00 a.m. to 9:59 a.m.
- 1010:00 a.m. to 10:59 a.m.
- 1211:00 a.m. to 11:59 a.m.
- 4112:00 p.m. to 3:59 p.m.
- 94:00 p.m. to 11:59 p.m.

Occupations of males:
- Percentage of males in management occupations (except farmers):
Here: 12.7% California: 12.0%
- Percentage of males in business and financial operations occupations:
Here: 45.2% California: 4.9%
- Percentage of males in computer and mathematical occupations:
Here: 6.5% California: 5.7%
- Percentage of males in architecture and engineering occupations:
Here: 5.2% California: 3.8%
- Percentage of males in service occupations:
Here: 10.2% California: 14.8%
- Percentage of males in sales and office occupations:
Here: 9.0% California: 14.7%
- Percentage of males in construction, extraction, and maintenance occupations:
Here: 1.9% California: 8.7%
- Percentage of males in production occupations:
Here: 4.2% California: 5.9%
- Percentage of males in transportation occupations:
Here: 2.5% California: 5.7%
Occupations of females:
- Percentage of females in management occupations (except farmers):
Here: 12.8% California: 10.2%
- Percentage of females in business and financial operations occupations:
Here: 1.6% California: 6.9%
- Percentage of females in computer and mathematical occupations:
Here: 2.6% California: 2.2%
- Percentage of females in architecture and engineering occupations:
Here: 1.1% California: 1.0%
- Percentage of females in life, physical, and social science occupations:
Here: 6.3% California: 1.5%
- Percentage of females in legal occupations:
Here: 2.9% California: 1.5%
- Percentage of females in education, training, and library occupations:
Here: 16.3% California: 8.4%
- Percentage of females in service occupations:
Here: 6.8% California: 20.9%
- Percentage of females in sales and office occupations:
Here: 49.7% California: 26.2%
Education in this neighborhood (subdivision or community):
- Percentage of people 3 years and older in K-12 schools:
Potrero Valley: 16.6% California: 16.9%
- Percentage of people 3 years and older in undergraduate colleges:
Potrero Valley: 5.5% California: 6.3%
- Percentage of people 3 years and older in grad. or professional schools:
Potrero Valley: 0.5% California: 1.5%
- Percentage of students K-12 enrolled in private schools:
Potrero Valley: 13.6% California: 10.1%
Percentage of population below poverty level:
| Potrero Valley: | 2.6% |
| California: | 12.2% |
Median year owner moved in (as recorded in 2022):
| Potrero Valley: | 2007 |
| California: | 2010 |
Percentage of married-couple families with both working:
| Potrero Valley: | 82.0% |
| California: | 66.2% |

- 77.1%Utility gas
- 11.5%Electricity
- 9.1%No fuel used
- 2.3%Bottled, tank, or LP gas
Roads and streets:
Knollwood Dr
Length: 0.56 miles
Directions: E-W, N-S, SE-NW
Address range: 936 to 1399
Directions: E-W, N-S, SE-NW
Address range: 936 to 1399
la Grange Ave
Length: 0.56 miles
Directions: E-W, N-S, SW-NE
Address range: 500 to 1199
Directions: E-W, N-S, SW-NE
Address range: 500 to 1199
Rotella St
Length: 0.53 miles
Directions: E-W, N-S, SE-NW
Address range: 1000 to 1399
Directions: E-W, N-S, SE-NW
Address range: 1000 to 1399
Boxthorn Ave
Length: 0.20 miles
Directions: N-S, SE-NW
Address range: 600 to 899
Directions: N-S, SE-NW
Address range: 600 to 899
S Longford Ave
Length: 0.19 miles
Directions: N-S, SE-NW
Address range: 600 to 899
Directions: N-S, SE-NW
Address range: 600 to 899
Lynn Rd
Length: 0.16 miles
Direction: E-W
Address range: 3546 to 3603
Direction: E-W
Address range: 3546 to 3603
Holloway St
Length: 0.13 miles
Direction: E-W
Address range: 3600 to 3699
Direction: E-W
Address range: 3600 to 3699
S Wendy Dr
Length: 0.12 miles
Direction: N-S
Address range: 1282 to 1327
Direction: N-S
Address range: 1282 to 1327
Hartung Ct
Length: 0.11 miles
Direction: E-W
Address range: 3800 to 3899
Direction: E-W
Address range: 3800 to 3899
Abbey Ct
Length: 0.11 miles
Direction: E-W
Address range: 3800 to 3899
Direction: E-W
Address range: 3800 to 3899
S Tapies Ct
Length: 0.08 miles
Directions: N-S, SE-NW
Address range: 900 to 1099
Directions: N-S, SE-NW
Address range: 900 to 1099
S Pons Ct
Length: 0.07 miles
Direction: N-S
Address range: 900 to 999
Direction: N-S
Address range: 900 to 999
S Riopelle Ct
Length: 0.07 miles
Directions: N-S, SE-NW
Address range: 900 to 1099
Directions: N-S, SE-NW
Address range: 900 to 1099
Erinlea Ave
Length: 0.06 miles
Direction: SW-NE
Address range: 3646 to 3675
Direction: SW-NE
Address range: 3646 to 3675