Ptarmigan Farms neighborhood in Durango, Colorado (CO), 81301 detailed profile
Settings
X


Business Search - 14 Million verified businesses
Area: 0.392 square miles
Population: 157
Population density:
| Ptarmigan Farms: | 401 people per square mile |
| Durango: | 2,823 people per square mile |

- 10238.6%White
- 7929.9%American Indian
- 4717.8%Hispanic or Latino
- 124.5%Black
- 124.5%Asian
- 62.3%Some other race
- 62.3%Two or more races

Distribution of median household income
![Distribution of median household income]()
- 4Less than $10,000
- 63$10,000 to $19,999
- 10$20,000 to $29,999
- 10$30,000 to $39,999
- 10$40,000 to $49,999
- 7$50,000 to $59,999
- 34$60,000 to $74,999
- 33$75,000 to $99,999
- 7$100,000 to $124,999
- 2$125,000 to $149,999
- 34$150,000 to $199,999
- 5$200,000 or more

Distribution of owner-occupied house/condo value
![Distribution of owner-occupied house/condo value]()
- 20Less than $50,000
- 38$50,000 to $99,999
- 4$100,000 to $149,999
- 14$150,000 to $199,999
- 4$200,000 to $249,999
- 1$250,000 to $299,999
- 15$300,000 to $399,999
- 11$400,000 to $499,999
- 6$500,000 to $749,999
- 5$750,000 to $999,999
- 13$1,000,000 or more

Distribution of rent paid by renters
![Distribution of rent paid by renters]()
- 11$100 to $199
- 14$200 to $299
- 9$300 to $399
- 11$400 to $499
- 2$500 to $599
- 3$700 to $799
- 8$800 to $899
- 20$900 to $999
- 14$1,000 to $1,249
- 3$1,250 to $1,499
- 13$1,500 to $1,999
- 3$2,000 or more

Median rent in 2022:
| Ptarmigan Farms: | $1,036 |
| Durango: | $1,315 |
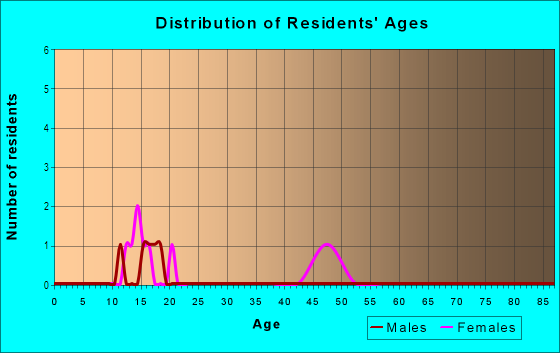
| Males: | 83 |
| Females: | 74 |
Males:
| This neighborhood: | 41.9 years |
| Whole city: | 36.5 years |
| This neighborhood: | 49.6 years |
| Whole city: | 36.7 years |
Average household size:
| Ptarmigan Farms: | 1.8 people |
| Durango: | 2.1 people |
Percentage of family households:
| Ptarmigan Farms: | 30.4% |
| Durango: | 37.4% |
| Here: | 10.0% |
| Durango: | 39.3% |
Percentage of married-couple families with children (among all households):
| Ptarmigan Farms: | 168.7% |
| Durango: | 26.8% |
Percentage of single-mother households (among all households):
| Ptarmigan Farms: | 59.2% |
| Durango: | 9.2% |
Percentage of never married males 15 years old and over:
Percentage of never married females 15 years old and over:
| Ptarmigan Farms: | 21.3% |
| Durango: | 21.9% |
Percentage of never married females 15 years old and over:
| Ptarmigan Farms: | 15.9% |
| city: | 18.8% |
Percentage of people that speak English not well or not at all:
| Ptarmigan Farms: | 0.0% |
| Durango: | 0.3% |
Percentage of people born in this state:
Percentage of people born in another U.S. state:
Percentage of native residents but born outside the U.S.:
Percentage of foreign born residents:
| Here: | 30.5% |
| Durango: | 31.4% |
Percentage of people born in another U.S. state:
| Ptarmigan Farms: | 66.2% |
| Durango: | 64.1% |
Percentage of native residents but born outside the U.S.:
| Here: | 2.4% |
| city: | 2.6% |
Percentage of foreign born residents:
| Here: | 0.9% |
| Durango: | 1.9% |

Owner-occupied
Renter-occupied


- Rooms in owner-occupied houses and condos in Ptarmigan Farms
- 11 room
- 42 rooms
- 123 rooms
- 24 rooms
- 325 rooms
- 106 rooms
- 57 rooms
- 88 rooms
- 229+ rooms

- Rooms in renter-occupied apartments in Ptarmigan Farms
- 281 room
- 112 rooms
- 163 rooms
- 234 rooms
- 15 rooms
- 106 rooms
- 207 rooms
- 08 rooms
- 49+ rooms
Owner-occupied
Renter-occupied

- Bedrooms in owner-occupied houses and condos in Ptarmigan Farms
- 1no bedroom
- 81 bedroom
- 102 bedrooms
- 203 bedrooms
- 264 bedrooms
- 25+ bedrooms

- Bedrooms in renter-occupied apartments in Ptarmigan Farms
- 28no bedroom
- 91 bedroom
- 352 bedrooms
- 73 bedrooms
- 64 bedrooms
- 45+ bedrooms
Average number of cars or other vehicles available in houses/condos:
Average number of cars or other vehicles available in apartments:
| This neighborhood: | 1.3 |
| Durango: | 2.0 |
Average number of cars or other vehicles available in apartments:
| Here: | 1.4 |
| city: | 1.4 |
Percentage of units with a mortgage:
| Ptarmigan Farms: | 29.2% |
| Durango: | 63.7% |
Average estimated value of detached houses in 2022 (27.1% of all units):
| Ptarmigan Farms: | $619,573 |
| Colorado: | $676,667 |

- Year house built in Ptarmigan Farms
- 32020 or later
- 322010 to 2019
- 312000 to 2009
- 191990 to 1999
- 171980 to 1989
- 251970 to 1979
- 31960 to 1969
- 51950 to 1959
- 91940 to 1949
- 41939 or earlier

City-data.com crime index for city in 2020 (higher means more crime):
| City: | 347.8 |
| U.S. average: | 219.5 |
Travel time to work (commute)
![Travel time to work (commute)]()
- 8Less than 5 minutes
- 385 to 9 minutes
- 5210 to 14 minutes
- 2415 to 19 minutes
- 1420 to 24 minutes
- 225 to 29 minutes
- 230 to 34 minutes
- 240 to 44 minutes
- 545 to 59 minutes
- 160 to 89 minutes
- 290 or more minutes

Means of transportation to work
![Means of transportation to work]()
- 97.4%60Drove a car alone
- 52.0%32Carpooled
- 16.2%10Bus
- 48.7%30Bicycle
- 24.4%15Walked
- 26.0%16Other means
- 115.3%71Worked at home

Time leaving home to go to work
![Time leaving home to go to work]()
- 312:00 a.m. to 4:59 a.m.
- 15:00 a.m. to 5:29 a.m.
- 35:30 a.m. to 5:59 a.m.
- 16:00 a.m. to 6:29 a.m.
- 76:30 a.m. to 6:59 a.m.
- 247:00 a.m. to 7:29 a.m.
- 147:30 a.m. to 7:59 a.m.
- 258:00 a.m. to 8:29 a.m.
- 208:30 a.m. to 8:59 a.m.
- 129:00 a.m. to 9:59 a.m.
- 1310:00 a.m. to 10:59 a.m.
- 211:00 a.m. to 11:59 a.m.
- 1612:00 p.m. to 3:59 p.m.
- 54:00 p.m. to 11:59 p.m.

Occupations of males:
- Percentage of males in management occupations (except farmers):
Here: 44.8% city: 11.7%
- Percentage of males in architecture and engineering occupations:
Here: 9.5% city: 3.6%
- Percentage of males in life, physical, and social science occupations:
Here: 11.7% city: 1.8%
- Percentage of males in community and social services occupations:
Here: 7.4% city: 1.5%
- Percentage of males in education, training, and library occupations:
Here: 11.5% city: 9.2%
- Percentage of males in sales and office occupations:
Here: 2.3% city: 20.0%
- Percentage of males in transportation occupations:
Here: 19.0% city: 3.1%
- Percentage of males in material moving occupations:
Here: 9.1% city: 3.9%
Occupations of females:
- Percentage of females in community and social services occupations:
Here: 5.4% city: 3.9%
- Percentage of females in education, training, and library occupations:
Here: 8.6% city: 11.0%
- Percentage of females in healthcare practitioners and technical occupations:
Here: 44.8% city: 11.8%
- Percentage of females in service occupations:
Here: 12.4% city: 16.6%
- Percentage of females in sales and office occupations:
Here: 18.7% city: 29.9%
- Percentage of females in construction, extraction, and maintenance occupations:
Here: 4.9% city: 0.9%
- Percentage of females in production occupations:
Here: 8.9% city: 1.9%
Education in this neighborhood (subdivision or community):
- Percentage of people 3 years and older in K-12 schools:
Ptarmigan Farms: 45.2% Durango: 10.3%
- Percentage of people 3 years and older in undergraduate colleges:
Ptarmigan Farms: 24.2% Durango: 14.1%
- Percentage of people 3 years and older in grad. or professional schools:
Ptarmigan Farms: 1.3% Durango: 1.5%
- Percentage of students K-12 enrolled in private schools:
Ptarmigan Farms: 12.7% Durango: 8.2%
Percentage of population below poverty level:
| Ptarmigan Farms: | 16.6% |
| Durango: | 14.2% |
Median year owner moved in (as recorded in 2022):
Median year renter moved in (as recorded in 2022):
| Ptarmigan Farms: | 2010 |
| Durango: | 2011 |
Median year renter moved in (as recorded in 2022):
| Ptarmigan Farms: | 2017 |
| Durango: | 2018 |
Percentage of married-couple families with both working:
| Ptarmigan Farms: | 112.7% |
| Durango: | 86.5% |

- 61.6%Utility gas
- 27.6%Electricity
- 3.7%Wood
- 3.3%Bottled, tank, or LP gas
- 3.1%No fuel used
- 0.7%Solar energy
Roads and streets:
Ptarmigan Ln
Length: 0.12 miles
Directions: E-W, N-S, SE-NW, SW-NE
Address range: 49 to 69
Directions: E-W, N-S, SE-NW, SW-NE
Address range: 49 to 69