Pullman neighborhood in Richmond, California (CA), 94804, 94805 detailed profile
Settings
X


Business Search - 14 Million verified businesses
Area: 0.208 square miles
Population: 2,202
Population density:
| Pullman: | 10,573 people per square mile |
| Richmond: | 3,812 people per square mile |

- 1,05145.6%Hispanic or Latino
- 60326.1%Black
- 24710.7%Asian
- 1647.1%White
- 1014.4%Two or more races
- 863.7%American Indian
- 361.6%Native Hawaiian and Other
Pacific Islander - 180.8%Some other race

Median household income in 2022:
| Pullman: | $71,054 |
| Richmond: | $88,594 |
Distribution of median household income
![Distribution of median household income]()
- 63Less than $10,000
- 332$10,000 to $19,999
- 40$20,000 to $29,999
- 243$30,000 to $39,999
- 35$40,000 to $49,999
- 29$50,000 to $59,999
- 64$60,000 to $74,999
- 88$75,000 to $99,999
- 125$100,000 to $124,999
- 136$125,000 to $149,999
- 68$150,000 to $199,999
- 35$200,000 or more

Distribution of owner-occupied house/condo value
![Distribution of owner-occupied house/condo value]()
- 33Less than $50,000
- 29$50,000 to $99,999
- 47$100,000 to $149,999
- 38$150,000 to $199,999
- 21$200,000 to $249,999
- 74$250,000 to $299,999
- 23$300,000 to $399,999
- 41$400,000 to $499,999
- 149$500,000 to $749,999
- 35$750,000 to $999,999
- 31$1,000,000 or more

Distribution of rent paid by renters
![Distribution of rent paid by renters]()
- 6Less than $100
- 90$100 to $199
- 55$200 to $299
- 105$300 to $399
- 193$400 to $499
- 18$500 to $599
- 36$600 to $699
- 44$700 to $799
- 49$800 to $899
- 49$900 to $999
- 137$1,000 to $1,249
- 94$1,250 to $1,499
- 75$1,500 to $1,999
- 213$2,000 or more

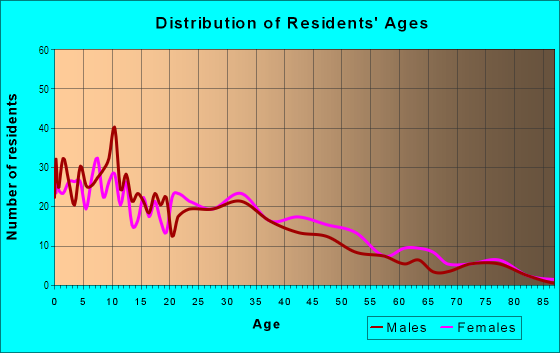
| Males: | 1,023 |
| Females: | 1,179 |
Males:
| This neighborhood: | 35.7 years |
| Whole city: | 35.3 years |
| This neighborhood: | 39.6 years |
| Whole city: | 43.0 years |
Average household size:
| Pullman: | 11.9 people |
| Richmond: | 2.8 people |
Percentage of family households:
| Pullman: | 62.5% |
| Richmond: | 42.7% |
| Here: | 40.8% |
| Richmond: | 40.5% |
Percentage of married-couple families with children (among all households):
| Pullman: | 17.6% |
| Richmond: | 21.6% |
Percentage of single-mother households (among all households):
| Pullman: | 41.8% |
| Richmond: | 9.9% |
Percentage of never married males 15 years old and over:
Percentage of never married females 15 years old and over:
| Pullman: | 19.7% |
| Richmond: | 25.4% |
Percentage of never married females 15 years old and over:
| Pullman: | 26.9% |
| city: | 19.6% |
Percentage of people that speak English not well or not at all:
| Pullman: | 10.0% |
| Richmond: | 12.7% |
Percentage of people born in this state:
Percentage of people born in another U.S. state:
Percentage of native residents but born outside the U.S.:
Percentage of foreign born residents:
| Here: | 59.2% |
| Richmond: | 47.4% |
Percentage of people born in another U.S. state:
| Pullman: | 11.6% |
| Richmond: | 14.0% |
Percentage of native residents but born outside the U.S.:
| Here: | 0.3% |
| city: | 2.3% |
Percentage of foreign born residents:
| Here: | 28.9% |
| Richmond: | 36.3% |

Owner-occupied
Renter-occupied


- Rooms in owner-occupied houses and condos in Pullman
- 391 room
- 302 rooms
- 193 rooms
- 784 rooms
- 615 rooms
- 836 rooms
- 257 rooms
- 358 rooms
- 629+ rooms

- Rooms in renter-occupied apartments in Pullman
- 191 room
- 92 rooms
- 1043 rooms
- 2164 rooms
- 975 rooms
- 256 rooms
- 127 rooms
- 438 rooms
- 139+ rooms
Owner-occupied
Renter-occupied

- Bedrooms in owner-occupied houses and condos in Pullman
- 52no bedroom
- 301 bedroom
- 1352 bedrooms
- 923 bedrooms
- 304 bedrooms
- 375+ bedrooms

- Bedrooms in renter-occupied apartments in Pullman
- 19no bedroom
- 1041 bedroom
- 2382 bedrooms
- 1173 bedrooms
- 514 bedrooms
- 135+ bedrooms
Average number of cars or other vehicles available in houses/condos:
Average number of cars or other vehicles available in apartments:
| This neighborhood: | 2.0 |
| Richmond: | 2.2 |
Average number of cars or other vehicles available in apartments:
| Here: | 1.5 |
| city: | 1.7 |
Percentage of units with a mortgage:
| Pullman: | 59.5% |
| Richmond: | 67.4% |
Average estimated value of detached houses in 2022 (41.6% of all units):
| Pullman: | $370,893 |
| Richmond: | $610,033 |

- Year house built in Pullman
- 02020 or later
- 652010 to 2019
- 352000 to 2009
- 501990 to 1999
- 411980 to 1989
- 1601970 to 1979
- 1061960 to 1969
- 811950 to 1959
- 2691940 to 1949
- 1301939 or earlier

City-data.com crime index for city in 2020 (higher means more crime):
| City: | 461.7 |
| U.S. average: | 219.5 |
Travel time to work (commute)
![Travel time to work (commute)]()
- 13Less than 5 minutes
- 105 to 9 minutes
- 8310 to 14 minutes
- 9815 to 19 minutes
- 8920 to 24 minutes
- 4625 to 29 minutes
- 12430 to 34 minutes
- 335 to 39 minutes
- 5240 to 44 minutes
- 27845 to 59 minutes
- 17760 to 89 minutes
- 5790 or more minutes

Means of transportation to work
![Means of transportation to work]()
- 67.2%611Drove a car alone
- 12.3%112Carpooled
- 8.8%80Bus
- 3.5%32Subway or elevated rail
- 3.9%35Long-distance train or commuter rail
- 4.4%40Light rail, streetcar or trolley
- 0.6%5Ferryboat
- 3.2%29Bicycle
- 2.9%26Walked
- 2.9%26Other means
- 3.0%27Worked at home

Time leaving home to go to work
![Time leaving home to go to work]()
- 7912:00 a.m. to 4:59 a.m.
- 585:00 a.m. to 5:29 a.m.
- 395:30 a.m. to 5:59 a.m.
- 896:00 a.m. to 6:29 a.m.
- 1116:30 a.m. to 6:59 a.m.
- 437:00 a.m. to 7:29 a.m.
- 917:30 a.m. to 7:59 a.m.
- 628:00 a.m. to 8:29 a.m.
- 178:30 a.m. to 8:59 a.m.
- 819:00 a.m. to 9:59 a.m.
- 1610:00 a.m. to 10:59 a.m.
- 3511:00 a.m. to 11:59 a.m.
- 12912:00 p.m. to 3:59 p.m.
- 354:00 p.m. to 11:59 p.m.

Occupations of males:
- Percentage of males in management occupations (except farmers):
Here: 3.8% city: 9.4%
- Percentage of males in architecture and engineering occupations:
Here: 10.1% city: 2.9%
- Percentage of males in education, training, and library occupations:
Here: 1.7% city: 3.6%
- Percentage of males in service occupations:
Here: 12.5% city: 18.4%
- Percentage of males in sales and office occupations:
Here: 23.9% city: 13.4%
- Percentage of males in construction, extraction, and maintenance occupations:
Here: 34.2% city: 14.7%
- Percentage of males in transportation occupations:
Here: 8.0% city: 8.9%
Occupations of females:
- Percentage of females in management occupations (except farmers):
Here: 2.1% city: 10.0%
- Percentage of females in business and financial operations occupations:
Here: 2.9% city: 4.9%
- Percentage of females in life, physical, and social science occupations:
Here: 1.2% city: 1.7%
- Percentage of females in education, training, and library occupations:
Here: 17.2% city: 8.3%
- Percentage of females in arts, design, entertainment, sports, and media occupations:
Here: 1.1% city: 1.9%
- Percentage of females in service occupations:
Here: 39.7% city: 28.3%
- Percentage of females in sales and office occupations:
Here: 17.8% city: 25.4%
- Percentage of females in farming, fishing, and forestry occupations:
Here: 3.0% city: 0.5%
- Percentage of females in production occupations:
Here: 12.5% city: 2.6%
- Percentage of females in material moving occupations:
Here: 4.6% city: 3.0%
Education in this neighborhood (subdivision or community):
- Percentage of people 3 years and older in K-12 schools:
Pullman: 49.5% Richmond: 17.8%
- Percentage of people 3 years and older in undergraduate colleges:
Pullman: 7.4% Richmond: 4.5%
- Percentage of people 3 years and older in grad. or professional schools:
Pullman: 2.8% Richmond: 0.8%
- Percentage of students K-12 enrolled in private schools:
Pullman: 18.4% Richmond: 7.3%
Percentage of population below poverty level:
| Pullman: | 21.0% |
| Richmond: | 16.2% |
Median year owner moved in (as recorded in 2022):
Median year renter moved in (as recorded in 2022):
| Pullman: | 2000 |
| Richmond: | 2006 |
Median year renter moved in (as recorded in 2022):
| Pullman: | 2015 |
| Richmond: | 2016 |
Percentage of married-couple families with both working:
| Pullman: | 67.7% |
| Richmond: | 68.0% |

- 70.3%Utility gas
- 16.5%Electricity
- 3.5%No fuel used
- 3.2%Wood
- 2.2%Bottled, tank, or LP gas
- 1.8%Other fuel
- 1.7%Fuel oil, kerosene, etc.
- 0.8%Solar energy
Roads and streets:
Center Ave
Length: 0.69 miles
Directions: E-W, SW-NE
Address range: 2600 to 3699
Directions: E-W, SW-NE
Address range: 2600 to 3699
Florida Ave
Length: 0.62 miles
Directions: E-W, SW-NE
Address range: 2700 to 3699
Directions: E-W, SW-NE
Address range: 2700 to 3699
Ohio Ave
Length: 0.48 miles
Direction: E-W
Address range: 2900 to 3699
Direction: E-W
Address range: 2900 to 3699
S 35th St
Length: 0.41 miles
Direction: N-S
Address range: 100 to 499
Direction: N-S
Address range: 100 to 499
Pullman Ave
Length: 0.29 miles
Directions: E-W, SE-NW, SW-NE
Address range: 2299 to 3299
Directions: E-W, SE-NW, SW-NE
Address range: 2299 to 3299
Waller Ave
Length: 0.25 miles
Direction: E-W
Address range: 3300 to 3699
Direction: E-W
Address range: 3300 to 3699
Wall Ave
Length: 0.20 miles
Directions: E-W, SW-NE
Address range: 3300 to 3599
Directions: E-W, SW-NE
Address range: 3300 to 3599
Carlson Blvd
Length: 0.20 miles
Directions: E-W, SE-NW
Address range: 142 to 298
Directions: E-W, SE-NW
Address range: 142 to 298
Beck St
Length: 0.20 miles
Directions: E-W, N-S, SE-NW
Address range: 260 to 399
Directions: E-W, N-S, SE-NW
Address range: 260 to 399
S 37th St
Length: 0.19 miles
Directions: N-S, SW-NE
Address range: 1 to 238
Directions: N-S, SW-NE
Address range: 1 to 238
S 36th St
Length: 0.19 miles
Direction: N-S
Address range: 300 to 499
Direction: N-S
Address range: 300 to 499
S 33rd St
Length: 0.18 miles
Direction: N-S
Address range: 100 to 299
Direction: N-S
Address range: 100 to 299
South St
Length: 0.16 miles
Directions: N-S, SW-NE
Address range: 300 to 441
Directions: N-S, SW-NE
Address range: 300 to 441
S 34th St
Length: 0.13 miles
Directions: N-S, SE-NW, SW-NE
Address range: 300 to 499
Directions: N-S, SE-NW, SW-NE
Address range: 300 to 499
Bissell Ave
Length: 0.13 miles
Direction: E-W
Address range: 3500 to 3699
Direction: E-W
Address range: 3500 to 3699
Chanslor Ave
Length: 0.13 miles
Directions: E-W, SE-NW
Address range: 3500 to 3699
Directions: E-W, SE-NW
Address range: 3500 to 3699
Cutting Blvd
Length: 0.12 miles
Direction: E-W
Address range: 3400 to 3599
Direction: E-W
Address range: 3400 to 3599
Stege Ave
Length: 0.12 miles
Direction: SE-NW
Address range: 435 to 499
Direction: SE-NW
Address range: 435 to 499
37th St
Length: 0.12 miles
Direction: N-S
Address range: 1 to 199
Direction: N-S
Address range: 1 to 199
35th St
Length: 0.10 miles
Direction: N-S
Address range: 100 to 299
Direction: N-S
Address range: 100 to 299
S 29th St
Length: 0.10 miles
Direction: N-S
Address range: 100 to 199
Direction: N-S
Address range: 100 to 199
S 31st St
Length: 0.10 miles
Direction: N-S
Address range: 100 to 199
Direction: N-S
Address range: 100 to 199
W Macdonald Ave (Macdonald Ave)
Length: 0.06 miles
Direction: E-W
Address range: 3400 to 3499
Direction: E-W
Address range: 3400 to 3499
S 27th St
Length: 0.05 miles
Direction: N-S
Direction: N-S
Railroad features:
Bay Area Rapid Transit RR
Length: 0.14 miles
Direction: E-W
Direction: E-W