Quakertown neighborhood in Farmington, Michigan (MI), 48331 detailed profile
Settings
X


Business Search - 14 Million verified businesses
Area: 0.384 square miles
Population: 212
Population density:
| Quakertown: | 552 people per square mile |
| Farmington: | 4,303 people per square mile |

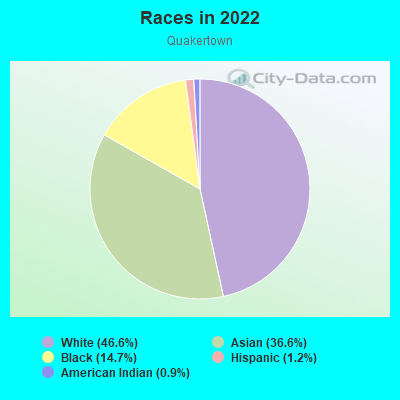
- 15846.6%White
- 12436.6%Asian
- 5014.7%Black
- 41.2%Hispanic or Latino
- 30.9%American Indian
Median household income in 2022:
| Quakertown: | $172,576 |
| Farmington: | $92,128 |
Distribution of median household income
![Distribution of median household income]()
- 14Less than $10,000
- 4$10,000 to $19,999
- 4$20,000 to $29,999
- 9$30,000 to $39,999
- 8$40,000 to $49,999
- 4$50,000 to $59,999
- 22$60,000 to $74,999
- 14$75,000 to $99,999
- 23$100,000 to $124,999
- 12$125,000 to $149,999
- 24$150,000 to $199,999
- 26$200,000 or more

Distribution of owner-occupied house/condo value
![Distribution of owner-occupied house/condo value]()
- 14Less than $50,000
- 6$50,000 to $99,999
- 18$100,000 to $149,999
- 9$150,000 to $199,999
- 15$200,000 to $249,999
- 19$250,000 to $299,999
- 25$300,000 to $399,999
- 5$400,000 to $499,999
- 37$500,000 to $749,999
- 3$750,000 to $999,999
- 3$1,000,000 or more

Distribution of rent paid by renters
![Distribution of rent paid by renters]()
- 2$100 to $199
- 2$600 to $699
- 8$900 to $999
- 9$1,000 to $1,249
- 9$1,250 to $1,499
- 3$1,500 to $1,999
- 2$2,000 or more

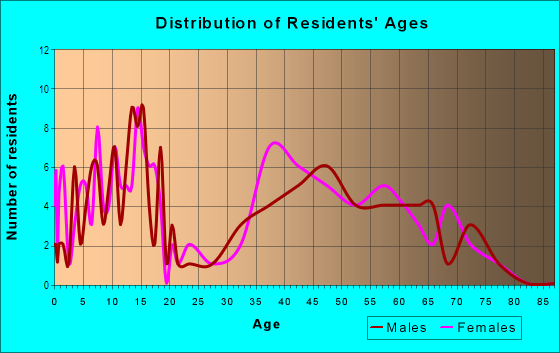
| Males: | 109 |
| Females: | 103 |
Males:
| This neighborhood: | 59.2 years |
| Whole city: | 35.3 years |
| This neighborhood: | 59.5 years |
| Whole city: | 42.4 years |
Average household size:
| Quakertown: | 2.5 people |
| Farmington: | 2.2 people |
Percentage of family households:
| Quakertown: | 35.6% |
| Farmington: | 41.0% |
| Here: | 77.6% |
| Farmington: | 45.5% |
Percentage of married-couple families with children (among all households):
| Quakertown: | 40.2% |
| Farmington: | 40.7% |
Percentage of single-mother households (among all households):
| Quakertown: | 3.8% |
| Farmington: | 4.2% |
Percentage of never married males 15 years old and over:
Percentage of never married females 15 years old and over:
| Quakertown: | 2.6% |
| Farmington: | 16.1% |
Percentage of never married females 15 years old and over:
| Quakertown: | 2.5% |
| city: | 15.2% |
Percentage of people that speak English not well or not at all:
| Quakertown: | 0.0% |
| Farmington: | 0.7% |
Percentage of people born in this state:
Percentage of people born in another U.S. state:
Percentage of native residents but born outside the U.S.:
Percentage of foreign born residents:
| Here: | 61.7% |
| Farmington: | 63.1% |
Percentage of people born in another U.S. state:
| Quakertown: | 18.5% |
| Farmington: | 16.3% |
Percentage of native residents but born outside the U.S.:
| Here: | 0.0% |
| city: | 0.8% |
Percentage of foreign born residents:
| Here: | 19.8% |
| Farmington: | 19.8% |
Owner-occupied
Renter-occupied

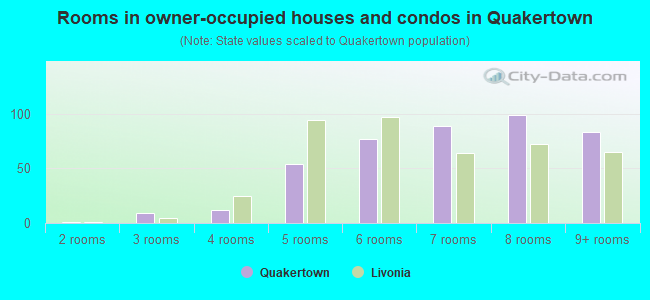
- Rooms in owner-occupied houses and condos in Quakertown
- 01 room
- 02 rooms
- 03 rooms
- 34 rooms
- 285 rooms
- 116 rooms
- 117 rooms
- 178 rooms
- 409+ rooms
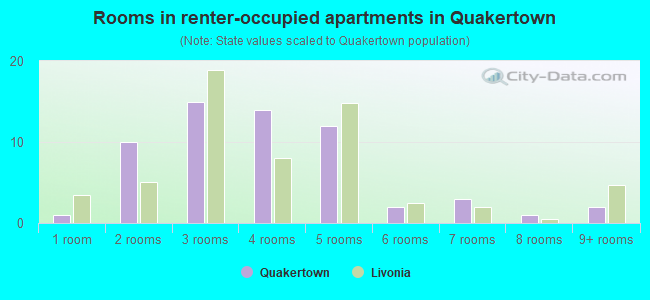
- Rooms in renter-occupied apartments in Quakertown
- 01 room
- 02 rooms
- 163 rooms
- 34 rooms
- 45 rooms
- 46 rooms
- 27 rooms
- 08 rooms
- 19+ rooms
Owner-occupied
Renter-occupied
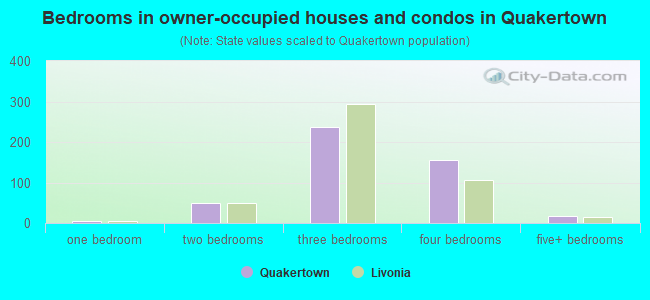
- Bedrooms in owner-occupied houses and condos in Quakertown
- 0no bedroom
- 01 bedroom
- 42 bedrooms
- 163 bedrooms
- 554 bedrooms
- 95+ bedrooms
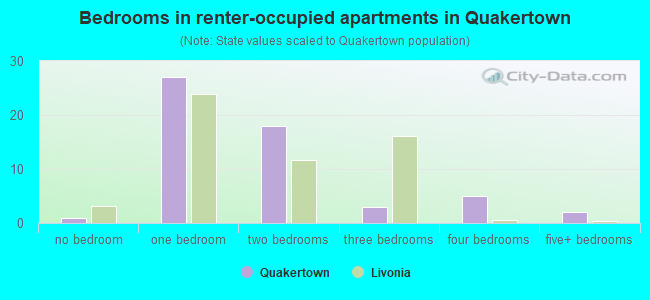
- Bedrooms in renter-occupied apartments in Quakertown
- 0no bedroom
- 171 bedroom
- 152 bedrooms
- 03 bedrooms
- 14 bedrooms
- 05+ bedrooms
Average number of cars or other vehicles available in houses/condos:
Average number of cars or other vehicles available in apartments:
| This neighborhood: | 2.0 |
| Farmington: | 1.9 |
Average number of cars or other vehicles available in apartments:
| Here: | |
| city: |
Percentage of units with a mortgage:
| Quakertown: | 49.2% |
| Farmington: | 63.7% |
Average estimated value of detached houses in 2022 (100.0% of all units):
| Quakertown: | $450,065 |
| Farmington: | $284,023 |
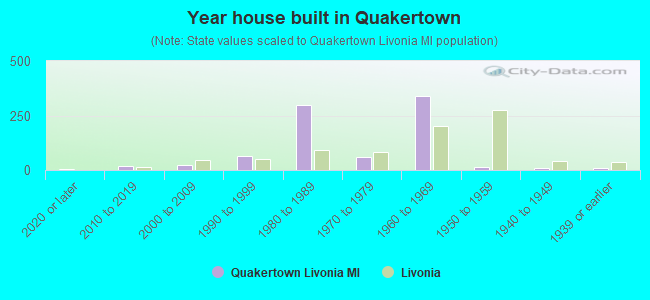
- Year house built in Quakertown
- 02020 or later
- 02010 to 2019
- 82000 to 2009
- 351990 to 1999
- 71980 to 1989
- 81970 to 1979
- 171960 to 1969
- 71950 to 1959
- 51940 to 1949
- 41939 or earlier
City-data.com crime index for city in 2020 (higher means more crime):
| City: | 33.2 |
| U.S. average: | 219.5 |
Travel time to work (commute)
![Travel time to work (commute)]()
- 1Less than 5 minutes
- 135 to 9 minutes
- 3510 to 14 minutes
- 2515 to 19 minutes
- 3520 to 24 minutes
- 2825 to 29 minutes
- 3630 to 34 minutes
- 335 to 39 minutes
- 640 to 44 minutes
- 345 to 59 minutes
- 190 or more minutes

Means of transportation to work
![Means of transportation to work]()
- 90.8%78Drove a car alone
- 10.5%9Carpooled
- 2.3%2Other means
- 8.1%7Worked at home

Time leaving home to go to work
![Time leaving home to go to work]()
- 212:00 a.m. to 4:59 a.m.
- 105:30 a.m. to 5:59 a.m.
- 146:00 a.m. to 6:29 a.m.
- 126:30 a.m. to 6:59 a.m.
- 127:00 a.m. to 7:29 a.m.
- 437:30 a.m. to 7:59 a.m.
- 228:00 a.m. to 8:29 a.m.
- 138:30 a.m. to 8:59 a.m.
- 399:00 a.m. to 9:59 a.m.
- 110:00 a.m. to 10:59 a.m.
- 1311:00 a.m. to 11:59 a.m.
- 1912:00 p.m. to 3:59 p.m.
- 124:00 p.m. to 11:59 p.m.

Occupations of males:
- Percentage of males in management occupations (except farmers):
Here: 29.9% city: 10.6%
- Percentage of males in computer and mathematical occupations:
Here: 7.1% city: 21.4%
- Percentage of males in architecture and engineering occupations:
Here: 5.8% city: 13.8%
- Percentage of males in life, physical, and social science occupations:
Here: 3.9% city: 0.8%
- Percentage of males in education, training, and library occupations:
Here: 7.2% city: 1.9%
- Percentage of males in arts, design, entertainment, sports, and media occupations:
Here: 1.4% city: 0.8%
- Percentage of males in healthcare practitioners and technical occupations:
Here: 12.9% city: 2.6%
- Percentage of males in service occupations:
Here: 8.5% city: 5.6%
- Percentage of males in sales and office occupations:
Here: 34.4% city: 14.6%
- Percentage of males in construction, extraction, and maintenance occupations:
Here: 21.2% city: 4.2%
- Percentage of males in production occupations:
Here: 9.9% city: 4.4%
- Percentage of males in transportation occupations:
Here: 2.5% city: 3.1%
Occupations of females:
- Percentage of females in management occupations (except farmers):
Here: 26.6% city: 9.9%
- Percentage of females in business and financial operations occupations:
Here: 6.0% city: 8.6%
- Percentage of females in computer and mathematical occupations:
Here: 3.9% city: 4.4%
- Percentage of females in architecture and engineering occupations:
Here: 3.9% city: 3.2%
- Percentage of females in community and social services occupations:
Here: 47.5% city: 1.8%
- Percentage of females in legal occupations:
Here: 13.8% city: 1.2%
- Percentage of females in education, training, and library occupations:
Here: 15.6% city: 7.1%
- Percentage of females in arts, design, entertainment, sports, and media occupations:
Here: 9.0% city: 2.1%
- Percentage of females in healthcare practitioners and technical occupations:
Here: 83.2% city: 11.4%
- Percentage of females in service occupations:
Here: 7.2% city: 16.3%
- Percentage of females in transportation occupations:
Here: 6.0% city: 1.6%
- Percentage of females in material moving occupations:
Here: 5.5% city: 1.5%
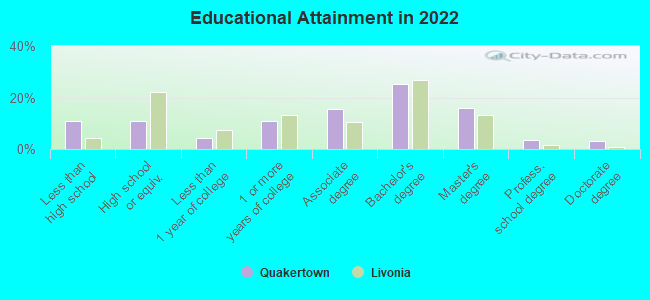
Education in this neighborhood (subdivision or community):
- Percentage of people 3 years and older in K-12 schools:
Quakertown: 35.8% Farmington: 12.2%
- Percentage of people 3 years and older in undergraduate colleges:
Quakertown: 14.2% Farmington: 4.3%
- Percentage of people 3 years and older in grad. or professional schools:
Quakertown: 3.3% Farmington: 1.0%
- Percentage of students K-12 enrolled in private schools:
Quakertown: 68.4% Farmington: 17.8%
Percentage of population below poverty level:
| Quakertown: | 6.8% |
| Farmington: | 4.9% |
Median year owner moved in (as recorded in 2022):
| Quakertown: | 2010 |
| Farmington: | 2010 |
Percentage of married-couple families with both working:
| Quakertown: | 153.9% |
| Farmington: | 61.1% |
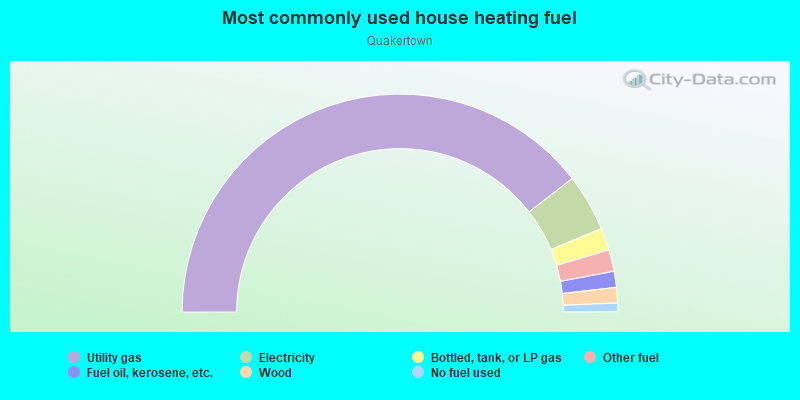
- 82.8%Utility gas
- 11.4%Electricity
- 5.8%Wood
Roads and streets:
11 Mile Rd
Length: 0.91 miles
Direction: E-W
Address range: 35700 to 36805
Direction: E-W
Address range: 35700 to 36805
Quakertown Ln
Length: 0.83 miles
Directions: E-W, N-S, SE-NW, SW-NE
Address range: 35900 to 36799
Directions: E-W, N-S, SE-NW, SW-NE
Address range: 35900 to 36799
W Lyman Rd
Length: 0.75 miles
Directions: E-W, SE-NW, SW-NE
Address range: 35700 to 36699
Directions: E-W, SE-NW, SW-NE
Address range: 35700 to 36699
Drake Rd
Length: 0.70 miles
Directions: E-W, N-S, SW-NE
Address range: 26000 to 27189
Directions: E-W, N-S, SW-NE
Address range: 26000 to 27189
Paddleford Rd
Length: 0.48 miles
Directions: E-W, N-S, SE-NW, SW-NE
Address range: 26500 to 36499
Directions: E-W, N-S, SE-NW, SW-NE
Address range: 26500 to 36499
Steele Rd
Length: 0.45 miles
Directions: E-W, N-S, SE-NW, SW-NE
Address range: 26030 to 26299
Directions: E-W, N-S, SE-NW, SW-NE
Address range: 26030 to 26299
Pleasant Valley Rd
Length: 0.38 miles
Direction: N-S
Direction: N-S
Old Homestead Dr
Length: 0.37 miles
Directions: N-S, SE-NW, SW-NE
Address range: 26000 to 26599
Directions: N-S, SE-NW, SW-NE
Address range: 26000 to 26599
Meadowview Dr
Length: 0.36 miles
Directions: E-W, N-S, SE-NW, SW-NE
Address range: 26000 to 26499
Directions: E-W, N-S, SE-NW, SW-NE
Address range: 26000 to 26499
Hardenburg Rd
Length: 0.33 miles
Directions: E-W, SW-NE
Address range: 35900 to 36299
Directions: E-W, SW-NE
Address range: 35900 to 36299
E Lyman St
Length: 0.23 miles
Directions: E-W, SW-NE
Address range: 35400 to 35699
Directions: E-W, SW-NE
Address range: 35400 to 35699
Howard Rd
Length: 0.14 miles
Directions: E-W, N-S, SE-NW
Address range: 35900 to 36099
Directions: E-W, N-S, SE-NW
Address range: 35900 to 36099
Knight Dr
Length: 0.11 miles
Directions: E-W, N-S
Address range: 26695 to 35536
Directions: E-W, N-S
Address range: 26695 to 35536
Old Homestead Ct
Length: 0.08 miles
Directions: N-S, SE-NW
Address range: 26500 to 26563
Directions: N-S, SE-NW
Address range: 26500 to 26563
W Lyman Ct
Length: 0.06 miles
Directions: N-S, SW-NE
Address range: 36700 to 36799
Directions: N-S, SW-NE
Address range: 36700 to 36799