Railroad Property (Railroad Corridor) neighborhood in Fillmore, California (CA), 93015 detailed profile
Settings
X


Business Search - 14 Million verified businesses
Area: 0.260 square miles
Population: 1,769
Population density:
| Railroad Property (Railroad Corridor): | 6,803 people per square mile |
| Fillmore: | 5,923 people per square mile |

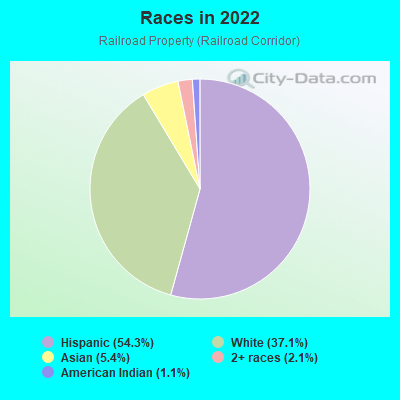
- 96954.3%Hispanic or Latino
- 66337.1%White
- 975.4%Asian
- 382.1%Two or more races
- 191.1%American Indian
Median household income in 2022:
| Railroad Property (Railroad Corridor): | $88,125 |
| Fillmore: | $85,255 |
Distribution of median household income
![Distribution of median household income]()
- 21Less than $10,000
- 69$10,000 to $19,999
- 45$20,000 to $29,999
- 23$30,000 to $39,999
- 25$40,000 to $49,999
- 103$50,000 to $59,999
- 14$60,000 to $74,999
- 56$75,000 to $99,999
- 79$100,000 to $124,999
- 44$125,000 to $149,999
- 123$150,000 to $199,999
- 114$200,000 or more

Distribution of owner-occupied house/condo value
![Distribution of owner-occupied house/condo value]()
- 7Less than $50,000
- 61$50,000 to $99,999
- 23$100,000 to $149,999
- 5$150,000 to $199,999
- 28$200,000 to $249,999
- 64$300,000 to $399,999
- 33$400,000 to $499,999
- 135$500,000 to $749,999
- 28$750,000 to $999,999
- 40$1,000,000 or more

Distribution of rent paid by renters
![Distribution of rent paid by renters]()
- 5$200 to $299
- 40$500 to $599
- 1$700 to $799
- 1$800 to $899
- 6$900 to $999
- 21$1,000 to $1,249
- 13$1,250 to $1,499
- 107$1,500 to $1,999
- 131$2,000 or more

Median rent in 2022:
| Railroad Property (Railroad Corridor): | $1,836 |
| Fillmore: | $1,721 |
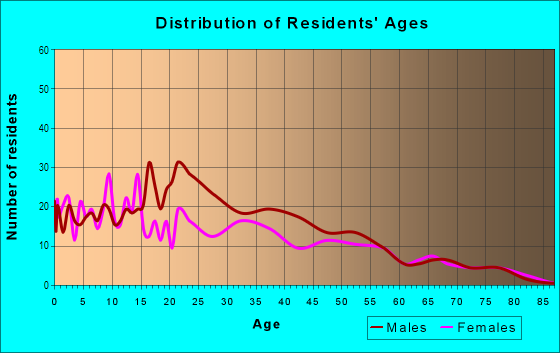
| Males: | 915 |
| Females: | 854 |
Males:
| This neighborhood: | 49.4 years |
| Whole city: | 35.3 years |
| This neighborhood: | 26.6 years |
| Whole city: | 34.6 years |
Average household size:
| Railroad Property (Railroad Corridor): | 2.7 people |
| Fillmore: | 3.3 people |
Percentage of family households:
| Railroad Property (Railroad Corridor): | 58.6% |
| Fillmore: | 60.4% |
| Here: | 55.2% |
| Fillmore: | 53.1% |
Percentage of married-couple families with children (among all households):
| Railroad Property (Railroad Corridor): | 30.1% |
| Fillmore: | 22.7% |
Percentage of single-mother households (among all households):
| Railroad Property (Railroad Corridor): | 4.8% |
| Fillmore: | 5.9% |
Percentage of never married males 15 years old and over:
Percentage of never married females 15 years old and over:
| Railroad Property (Railroad Corridor): | 15.5% |
| Fillmore: | 20.0% |
Percentage of never married females 15 years old and over:
| Railroad Property (Railroad Corridor): | 12.2% |
| city: | 17.2% |
Percentage of people that speak English not well or not at all:
| Railroad Property (Railroad Corridor): | 2.6% |
| Fillmore: | 9.6% |
Percentage of people born in this state:
Percentage of people born in another U.S. state:
Percentage of native residents but born outside the U.S.:
Percentage of foreign born residents:
| Here: | 72.6% |
| Fillmore: | 73.9% |
Percentage of people born in another U.S. state:
| Railroad Property (Railroad Corridor): | 8.2% |
| Fillmore: | 6.1% |
Percentage of native residents but born outside the U.S.:
| Here: | 0.6% |
| city: | 0.8% |
Percentage of foreign born residents:
| Here: | 18.7% |
| Fillmore: | 19.2% |
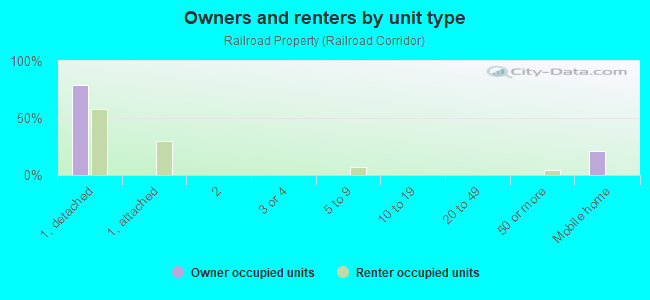
Owner-occupied
Renter-occupied


- Rooms in owner-occupied houses and condos in Railroad Property <
> - 01 room
- 02 rooms
- 03 rooms
- 534 rooms
- 525 rooms
- 1006 rooms
- 437 rooms
- 368 rooms
- 619+ rooms
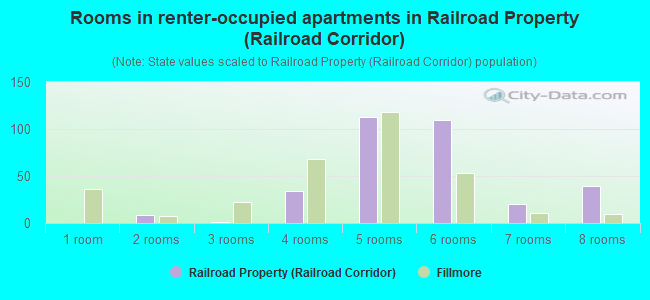
- Rooms in renter-occupied apartments in Railroad Property <
> - 01 room
- 82 rooms
- 13 rooms
- 344 rooms
- 1135 rooms
- 1106 rooms
- 207 rooms
- 398 rooms
- 09+ rooms
Owner-occupied
Renter-occupied
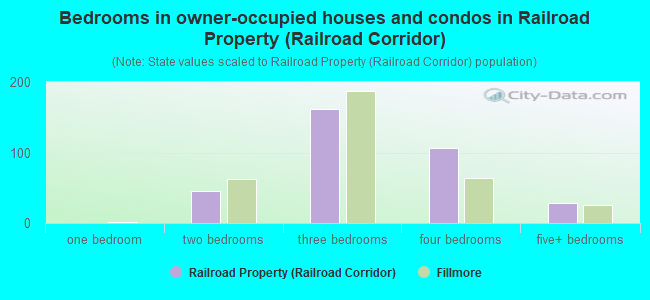
- Bedrooms in owner-occupied houses and condos in Railroad Property <
> - 0no bedroom
- 01 bedroom
- 462 bedrooms
- 1623 bedrooms
- 1064 bedrooms
- 285+ bedrooms
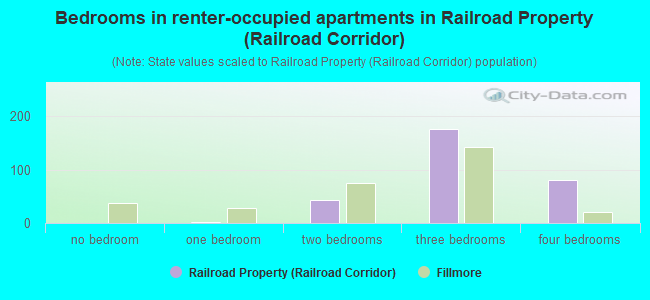
- Bedrooms in renter-occupied apartments in Railroad Property <
> - 0no bedroom
- 11 bedroom
- 432 bedrooms
- 1763 bedrooms
- 814 bedrooms
- 05+ bedrooms
Average number of cars or other vehicles available in houses/condos:
Average number of cars or other vehicles available in apartments:
| This neighborhood: | 2.5 |
| Fillmore: | 2.5 |
Average number of cars or other vehicles available in apartments:
| Here: | 1.7 |
| city: | 1.7 |
Percentage of units with a mortgage:
| Railroad Property (Railroad Corridor): | 51.7% |
| Fillmore: | 64.0% |
Average estimated value of detached houses in 2022 (86.1% of all units):
| Railroad Property (Railroad Corridor): | $572,727 |
| California: | $988,808 |

- Year house built in Railroad Property <
> - 112020 or later
- 192010 to 2019
- 592000 to 2009
- 151990 to 1999
- 1091980 to 1989
- 751970 to 1979
- 881960 to 1969
- 1941950 to 1959
- 11940 to 1949
- 1331939 or earlier
City-data.com crime index for city in 2020 (higher means more crime):
| City: | 105.8 |
| U.S. average: | 219.5 |
Travel time to work (commute)
![Travel time to work (commute)]()
- 70Less than 5 minutes
- 495 to 9 minutes
- 10410 to 14 minutes
- 5115 to 19 minutes
- 5620 to 24 minutes
- 5525 to 29 minutes
- 12230 to 34 minutes
- 3235 to 39 minutes
- 4640 to 44 minutes
- 27745 to 59 minutes
- 6860 to 89 minutes
- 4990 or more minutes

Means of transportation to work
![Means of transportation to work]()
- 67.3%596Drove a car alone
- 18.2%161Carpooled
- 3.8%34Bus
- 0.7%6Bicycle
- 3.5%31Walked
- 7.6%67Worked at home

Time leaving home to go to work
![Time leaving home to go to work]()
- 5612:00 a.m. to 4:59 a.m.
- 155:00 a.m. to 5:29 a.m.
- 1225:30 a.m. to 5:59 a.m.
- 246:00 a.m. to 6:29 a.m.
- 686:30 a.m. to 6:59 a.m.
- 1027:00 a.m. to 7:29 a.m.
- 877:30 a.m. to 7:59 a.m.
- 758:00 a.m. to 8:29 a.m.
- 238:30 a.m. to 8:59 a.m.
- 689:00 a.m. to 9:59 a.m.
- 4211:00 a.m. to 11:59 a.m.
- 6412:00 p.m. to 3:59 p.m.
- 724:00 p.m. to 11:59 p.m.

Occupations of males:
- Percentage of males in management occupations (except farmers):
Here: 23.8% city: 10.4%
- Percentage of males in business and financial operations occupations:
Here: 1.1% city: 2.4%
- Percentage of males in computer and mathematical occupations:
Here: 1.7% city: 1.9%
- Percentage of males in architecture and engineering occupations:
Here: 3.4% city: 3.2%
- Percentage of males in service occupations:
Here: 20.6% city: 18.9%
- Percentage of males in sales and office occupations:
Here: 8.0% city: 14.8%
- Percentage of males in construction, extraction, and maintenance occupations:
Here: 5.9% city: 8.0%
- Percentage of males in production occupations:
Here: 10.4% city: 8.9%
- Percentage of males in transportation occupations:
Here: 2.5% city: 3.2%
- Percentage of males in material moving occupations:
Here: 5.2% city: 6.1%
Occupations of females:
- Percentage of females in management occupations (except farmers):
Here: 7.7% city: 6.8%
- Percentage of females in architecture and engineering occupations:
Here: 4.6% city: 2.5%
- Percentage of females in community and social services occupations:
Here: 8.8% city: 5.0%
- Percentage of females in education, training, and library occupations:
Here: 7.1% city: 3.9%
- Percentage of females in arts, design, entertainment, sports, and media occupations:
Here: 1.8% city: 1.8%
- Percentage of females in healthcare practitioners and technical occupations:
Here: 41.6% city: 11.6%
- Percentage of females in service occupations:
Here: 5.5% city: 21.3%
- Percentage of females in sales and office occupations:
Here: 17.6% city: 29.7%
- Percentage of females in farming, fishing, and forestry occupations:
Here: 2.9% city: 4.5%
- Percentage of females in production occupations:
Here: 8.8% city: 3.4%
- Percentage of females in material moving occupations:
Here: 3.2% city: 1.7%
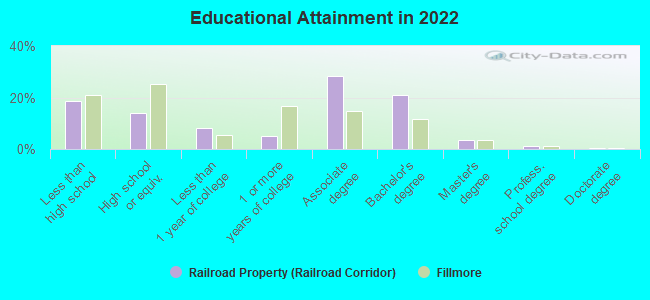
Education in this neighborhood (subdivision or community):
- Percentage of people 3 years and older in K-12 schools:
Railroad Property (Railroad Corridor): 17.6% Fillmore: 20.8%
- Percentage of people 3 years and older in undergraduate colleges:
Railroad Property (Railroad Corridor): 3.7% Fillmore: 8.0%
- Percentage of people 3 years and older in grad. or professional schools:
Railroad Property (Railroad Corridor): 0.0% Fillmore: 0.0%
- Percentage of students K-12 enrolled in private schools:
Railroad Property (Railroad Corridor): 12.1% Fillmore: 10.8%
Percentage of population below poverty level:
| Railroad Property (Railroad Corridor): | 8.1% |
| Fillmore: | 6.8% |
Median year owner moved in (as recorded in 2022):
Median year renter moved in (as recorded in 2022):
| Railroad Property (Railroad Corridor): | 1996 |
| Fillmore: | 2006 |
Median year renter moved in (as recorded in 2022):
| Railroad Property (Railroad Corridor): | 2010 |
| Fillmore: | 2013 |
Percentage of married-couple families with both working:
| Railroad Property (Railroad Corridor): | 103.6% |
| Fillmore: | 59.6% |
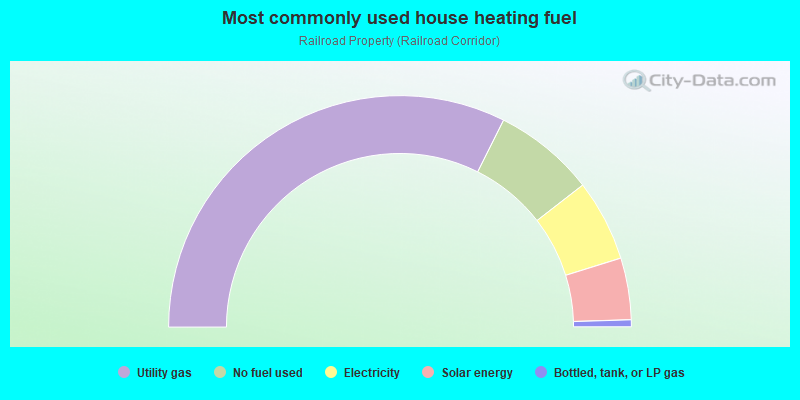
- 64.8%Utility gas
- 14.2%No fuel used
- 11.4%Electricity
- 8.6%Solar energy
- 1.0%Bottled, tank, or LP gas
Roads and streets:
Sespe Ave
Length: 1.47 miles
Directions: E-W, SE-NW, SW-NE
Address range: 230 to 899
Directions: E-W, SE-NW, SW-NE
Address range: 230 to 899
Santa Clara St (Santa Clara Ave)
Length: 1.07 miles
Directions: E-W, SW-NE
Address range: 258 to 899
Directions: E-W, SW-NE
Address range: 258 to 899
Main St
Length: 0.46 miles
Direction: E-W
Address range: 233 to 599
Direction: E-W
Address range: 233 to 599
Old Telegraph Rd
Length: 0.42 miles
Direction: SE-NW
Address range: 401 to 523
Direction: SE-NW
Address range: 401 to 523
B St
Length: 0.36 miles
Direction: N-S
Address range: 200 to 499
Direction: N-S
Address range: 200 to 499
del Valle Dr
Length: 0.22 miles
Directions: E-W, N-S, SW-NE
Address range: 200 to 799
Directions: E-W, N-S, SW-NE
Address range: 200 to 799
McCampbell St
Length: 0.18 miles
Direction: N-S
Address range: 200 to 399
Direction: N-S
Address range: 200 to 399
Central Ave
Length: 0.17 miles
Direction: N-S
Address range: 264 to 397
Direction: N-S
Address range: 264 to 397
A St
Length: 0.17 miles
Direction: N-S
Address range: 243 to 399
Direction: N-S
Address range: 243 to 399
Saratoga St
Length: 0.17 miles
Direction: N-S
Address range: 300 to 399
Direction: N-S
Address range: 300 to 399
Mountain View St
Length: 0.17 miles
Direction: N-S
Address range: 236 to 399
Direction: N-S
Address range: 236 to 399
Hume Dr
Length: 0.13 miles
Directions: E-W, N-S, SE-NW, SW-NE
Address range: 400 to 499
Directions: E-W, N-S, SE-NW, SW-NE
Address range: 400 to 499
Balden Ln
Length: 0.13 miles
Directions: E-W, N-S, SE-NW, SW-NE
Address range: 700 to 799
Directions: E-W, N-S, SE-NW, SW-NE
Address range: 700 to 799
Oliver St
Length: 0.11 miles
Direction: E-W
Address range: 800 to 899
Direction: E-W
Address range: 800 to 899
Fillmore St
Length: 0.11 miles
Direction: N-S
Address range: 300 to 399
Direction: N-S
Address range: 300 to 399
Wileman St
Length: 0.11 miles
Direction: E-W
Address range: 800 to 899
Direction: E-W
Address range: 800 to 899
Clay St
Length: 0.11 miles
Direction: N-S
Address range: 300 to 399
Direction: N-S
Address range: 300 to 399
Market St
Length: 0.11 miles
Direction: N-S
Address range: 300 to 399
Direction: N-S
Address range: 300 to 399
Pine Grove Ave (Orange Grove Ave)
Length: 0.06 miles
Direction: N-S
Address range: 398 to 499
Direction: N-S
Address range: 398 to 499
Mutau Cir
Length: 0.05 miles
Directions: E-W, N-S, SE-NW, SW-NE
Address range: 200 to 299
Directions: E-W, N-S, SE-NW, SW-NE
Address range: 200 to 299
1st St
Length: 0.05 miles
Direction: E-W
Direction: E-W
Railroad features:
Union Pacific RR
Length: 1.09 miles
Directions: E-W, SE-NW
Directions: E-W, SE-NW