Rancho neighborhood in San Jose, California (CA), 95111 detailed profile
Settings
X


Business Search - 14 Million verified businesses
Area: 0.041 square miles
Population: 431
Population density:
| Rancho: | 10,457 people per square mile |
| San Jose: | 5,554 people per square mile |

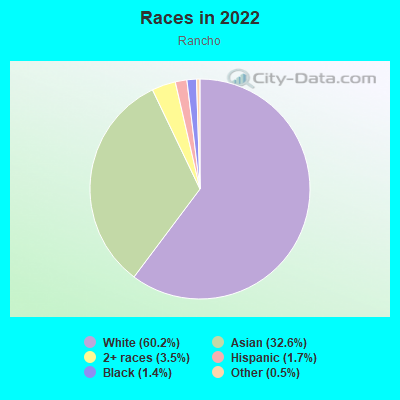
- 29666.4%Hispanic or Latino
- 7717.3%Asian
- 296.5%White
- 194.3%Native Hawaiian and Other
Pacific Islander - 153.4%Two or more races
- 102.2%Black
Median household income in 2022:
| Rancho: | $106,044 |
| San Jose: | $133,835 |
Distribution of median household income
![Distribution of median household income]()
- 7Less than $10,000
- 12$10,000 to $19,999
- 27$20,000 to $29,999
- 17$30,000 to $39,999
- 10$40,000 to $49,999
- 11$50,000 to $59,999
- 9$60,000 to $74,999
- 9$75,000 to $99,999
- 14$100,000 to $124,999
- 8$125,000 to $149,999
- 14$150,000 to $199,999
- 10$200,000 or more

Distribution of owner-occupied house/condo value
![Distribution of owner-occupied house/condo value]()
- 6$300,000 to $399,999
- 3$400,000 to $499,999
- 15$500,000 to $749,999
- 29$750,000 to $999,999
- 6$1,000,000 or more

Distribution of rent paid by renters
![Distribution of rent paid by renters]()
- 2$100 to $199
- 10$200 to $299
- 10$300 to $399
- 2$400 to $499
- 18$500 to $599
- 3$600 to $699
- 14$700 to $799
- 14$900 to $999
- 11$1,000 to $1,249
- 27$1,250 to $1,499
- 9$1,500 to $1,999
- 20$2,000 or more

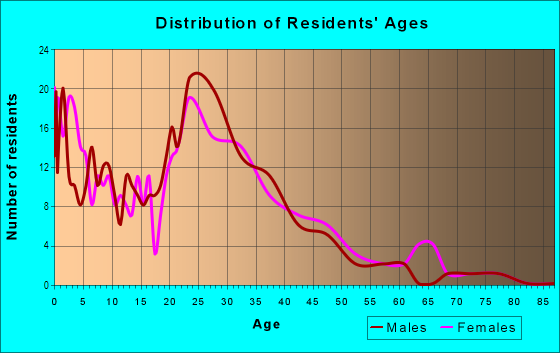
| Males: | 234 |
| Females: | 196 |
Males:
| This neighborhood: | 28.8 years |
| Whole city: | 37.6 years |
| This neighborhood: | 38.8 years |
| Whole city: | 39.1 years |
Average household size:
| Rancho: | 5.0 people |
| San Jose: | 2.9 people |
Percentage of family households:
| Rancho: | 47.8% |
| San Jose: | 49.9% |
| Here: | 37.1% |
| San Jose: | 53.0% |
Percentage of married-couple families with children (among all households):
| Rancho: | 12.3% |
| San Jose: | 25.8% |
Percentage of single-mother households (among all households):
| Rancho: | 9.0% |
| San Jose: | 5.2% |
Percentage of never married males 15 years old and over:
Percentage of never married females 15 years old and over:
| Rancho: | 29.7% |
| San Jose: | 20.9% |
Percentage of never married females 15 years old and over:
| Rancho: | 19.0% |
| city: | 16.7% |
Percentage of people that speak English not well or not at all:
| Rancho: | 10.0% |
| San Jose: | 11.4% |
Percentage of people born in this state:
Percentage of people born in another U.S. state:
Percentage of native residents but born outside the U.S.:
Percentage of foreign born residents:
| Here: | 47.9% |
| San Jose: | 46.1% |
Percentage of people born in another U.S. state:
| Rancho: | 2.8% |
| San Jose: | 10.4% |
Percentage of native residents but born outside the U.S.:
| Here: | 4.6% |
| city: | 1.7% |
Percentage of foreign born residents:
| Here: | 44.8% |
| San Jose: | 41.8% |
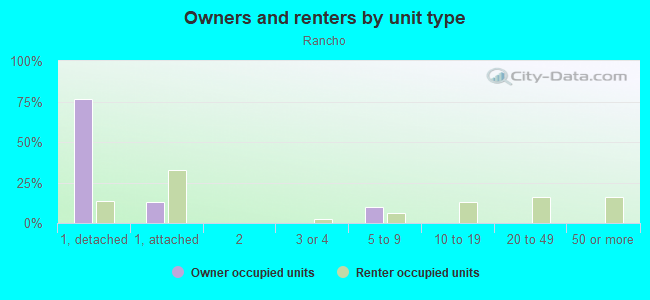
Owner-occupied
Renter-occupied

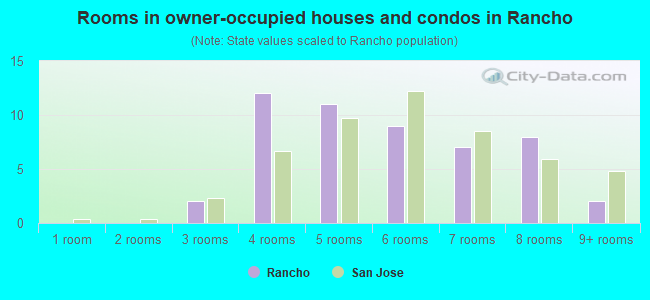
- Rooms in owner-occupied houses and condos in Rancho
- 01 room
- 02 rooms
- 23 rooms
- 124 rooms
- 115 rooms
- 96 rooms
- 77 rooms
- 88 rooms
- 29+ rooms
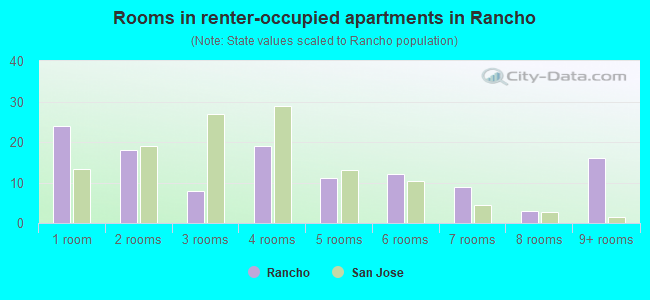
- Rooms in renter-occupied apartments in Rancho
- 241 room
- 182 rooms
- 83 rooms
- 194 rooms
- 115 rooms
- 126 rooms
- 97 rooms
- 38 rooms
- 169+ rooms
Owner-occupied
Renter-occupied
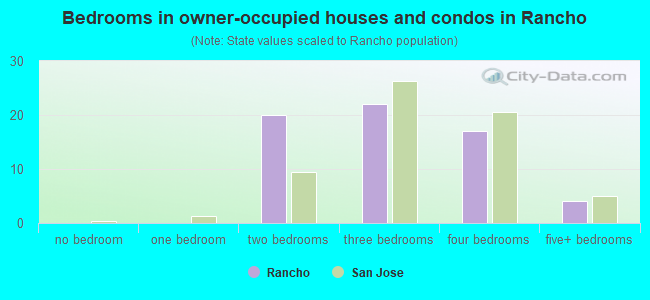
- Bedrooms in owner-occupied houses and condos in Rancho
- 0no bedroom
- 01 bedroom
- 202 bedrooms
- 223 bedrooms
- 174 bedrooms
- 45+ bedrooms
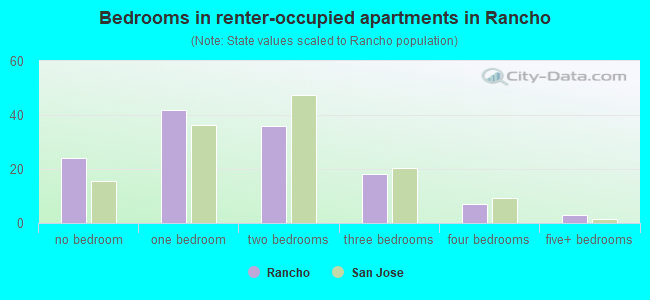
- Bedrooms in renter-occupied apartments in Rancho
- 24no bedroom
- 421 bedroom
- 362 bedrooms
- 183 bedrooms
- 74 bedrooms
- 35+ bedrooms
Average number of cars or other vehicles available in houses/condos:
Average number of cars or other vehicles available in apartments:
| This neighborhood: | 2.3 |
| San Jose: | 2.3 |
Average number of cars or other vehicles available in apartments:
| Here: | 2.3 |
| city: | 1.6 |
Percentage of units with a mortgage:
| Rancho: | 55.7% |
| San Jose: | 66.9% |
Housing prices:
- Average estimated value of detached houses in 2022 (73.6% of all units):
Rancho: $872,378 San Jose: $1,532,815
- Average estimated value of townhouses or other attached units in 2022 (24.2% of all units):
This neighborhood: $8,631,001 city: $1,024,857
- Average estimated '22 value of housing units in 5-or-more-unit structures (30.8% of all units):
Rancho: $574,517 San Jose: $791,954
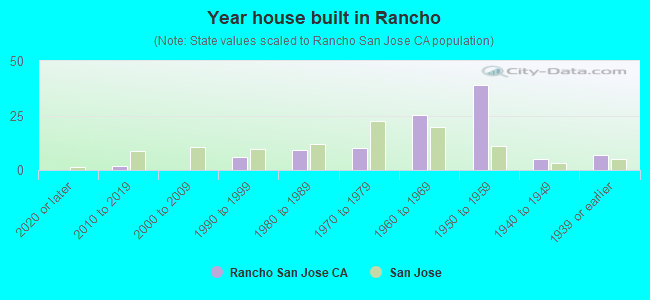
- Year house built in Rancho
- 02020 or later
- 22010 to 2019
- 02000 to 2009
- 61990 to 1999
- 91980 to 1989
- 101970 to 1979
- 251960 to 1969
- 391950 to 1959
- 51940 to 1949
- 71939 or earlier
City-data.com crime index for city in 2020 (higher means more crime):
| City: | 268.4 |
| U.S. average: | 219.5 |
Travel time to work (commute)
![Travel time to work (commute)]()
- 4Less than 5 minutes
- 55 to 9 minutes
- 2110 to 14 minutes
- 5515 to 19 minutes
- 5220 to 24 minutes
- 2325 to 29 minutes
- 6730 to 34 minutes
- 635 to 39 minutes
- 1440 to 44 minutes
- 3445 to 59 minutes
- 3060 to 89 minutes
- 1690 or more minutes

Means of transportation to work
![Means of transportation to work]()
- 66.4%125Drove a car alone
- 21.8%41Carpooled
- 8.0%15Bus
- 1.1%2Long-distance train or commuter rail
- 1.6%3Taxi
- 4.2%8Other means
- 3.7%7Worked at home

Time leaving home to go to work
![Time leaving home to go to work]()
- 1512:00 a.m. to 4:59 a.m.
- 255:00 a.m. to 5:29 a.m.
- 155:30 a.m. to 5:59 a.m.
- 486:00 a.m. to 6:29 a.m.
- 386:30 a.m. to 6:59 a.m.
- 447:00 a.m. to 7:29 a.m.
- 137:30 a.m. to 7:59 a.m.
- 568:00 a.m. to 8:29 a.m.
- 108:30 a.m. to 8:59 a.m.
- 229:00 a.m. to 9:59 a.m.
- 710:00 a.m. to 10:59 a.m.
- 411:00 a.m. to 11:59 a.m.
- 1812:00 p.m. to 3:59 p.m.
- 174:00 p.m. to 11:59 p.m.

Occupations of males:
- Percentage of males in management occupations (except farmers):
Here: 5.2% city: 13.0%
- Percentage of males in business and financial operations occupations:
Here: 1.2% city: 4.6%
- Percentage of males in computer and mathematical occupations:
Here: 1.7% city: 13.6%
- Percentage of males in architecture and engineering occupations:
Here: 4.6% city: 10.2%
- Percentage of males in community and social services occupations:
Here: 1.9% city: 0.8%
- Percentage of males in education, training, and library occupations:
Here: 3.3% city: 2.8%
- Percentage of males in arts, design, entertainment, sports, and media occupations:
Here: 1.1% city: 1.8%
- Percentage of males in service occupations:
Here: 8.5% city: 12.7%
- Percentage of males in sales and office occupations:
Here: 16.4% city: 12.8%
- Percentage of males in construction, extraction, and maintenance occupations:
Here: 29.3% city: 7.8%
- Percentage of males in production occupations:
Here: 12.6% city: 5.5%
- Percentage of males in transportation occupations:
Here: 5.0% city: 3.6%
- Percentage of males in material moving occupations:
Here: 6.4% city: 3.1%
Occupations of females:
- Percentage of females in management occupations (except farmers):
Here: 12.3% city: 11.0%
- Percentage of females in business and financial operations occupations:
Here: 6.9% city: 8.6%
- Percentage of females in architecture and engineering occupations:
Here: 9.2% city: 2.8%
- Percentage of females in education, training, and library occupations:
Here: 12.8% city: 8.1%
- Percentage of females in arts, design, entertainment, sports, and media occupations:
Here: 1.3% city: 2.0%
- Percentage of females in healthcare practitioners and technical occupations:
Here: 5.8% city: 6.8%
- Percentage of females in service occupations:
Here: 32.2% city: 21.7%
- Percentage of females in sales and office occupations:
Here: 19.3% city: 22.0%
- Percentage of females in production occupations:
Here: 8.9% city: 4.0%
- Percentage of females in material moving occupations:
Here: 6.8% city: 1.5%
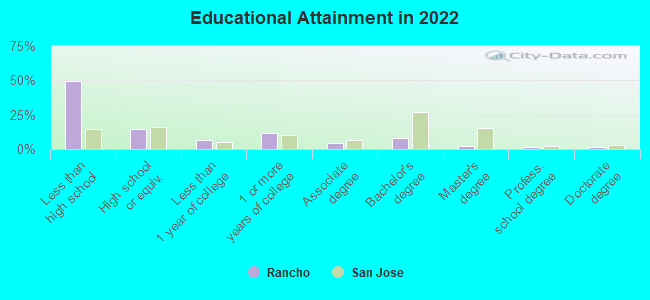
Education in this neighborhood (subdivision or community):
- Percentage of people 3 years and older in K-12 schools:
Rancho: 17.7% San Jose: 16.1%
- Percentage of people 3 years and older in undergraduate colleges:
Rancho: 5.0% San Jose: 6.5%
- Percentage of people 3 years and older in grad. or professional schools:
Rancho: 0.5% San Jose: 2.0%
- Percentage of students K-12 enrolled in private schools:
Rancho: 12.0% San Jose: 14.9%
Percentage of population below poverty level:
| Rancho: | 9.9% |
| San Jose: | 9.0% |
Median year owner moved in (as recorded in 2022):
Median year renter moved in (as recorded in 2022):
| Rancho: | 2008 |
| San Jose: | 2008 |
Median year renter moved in (as recorded in 2022):
| Rancho: | 2013 |
| San Jose: | 2020 |
Percentage of married-couple families with both working:
| Rancho: | 140.4% |
| San Jose: | 72.5% |

- 48.0%Utility gas
- 16.3%Bottled, tank, or LP gas
- 15.2%Electricity
- 11.0%Solar energy
- 6.7%No fuel used
- 2.8%Fuel oil, kerosene, etc.
Limited-access highways (interstate or state) in this neighborhood:
E Capitol Expy
Length: 0.10 miles
Directions: N-S, SW-NE
Directions: N-S, SW-NE
Roads and streets:
Seven Trees Blvd
Length: 0.12 miles
Direction: E-W
Address range: 3800 to 3859
Direction: E-W
Address range: 3800 to 3859
Rancho Manor Ct
Length: 0.07 miles
Directions: N-S, SE-NW, SW-NE
Address range: 100 to 161
Directions: N-S, SE-NW, SW-NE
Address range: 100 to 161
Rancho Dr
Length: 0.02 miles
Direction: N-S
Address range: 100 to 198
Direction: N-S
Address range: 100 to 198