Randolph neighborhood in Topeka, Kansas (KS), 66604 detailed profile
Settings
X

Business Search - 14 Million verified businesses
Area: 0.203 square miles
Population: 1,160
Population density:
| Randolph: | 5,701 people per square mile |
| Topeka: | 2,240 people per square mile |

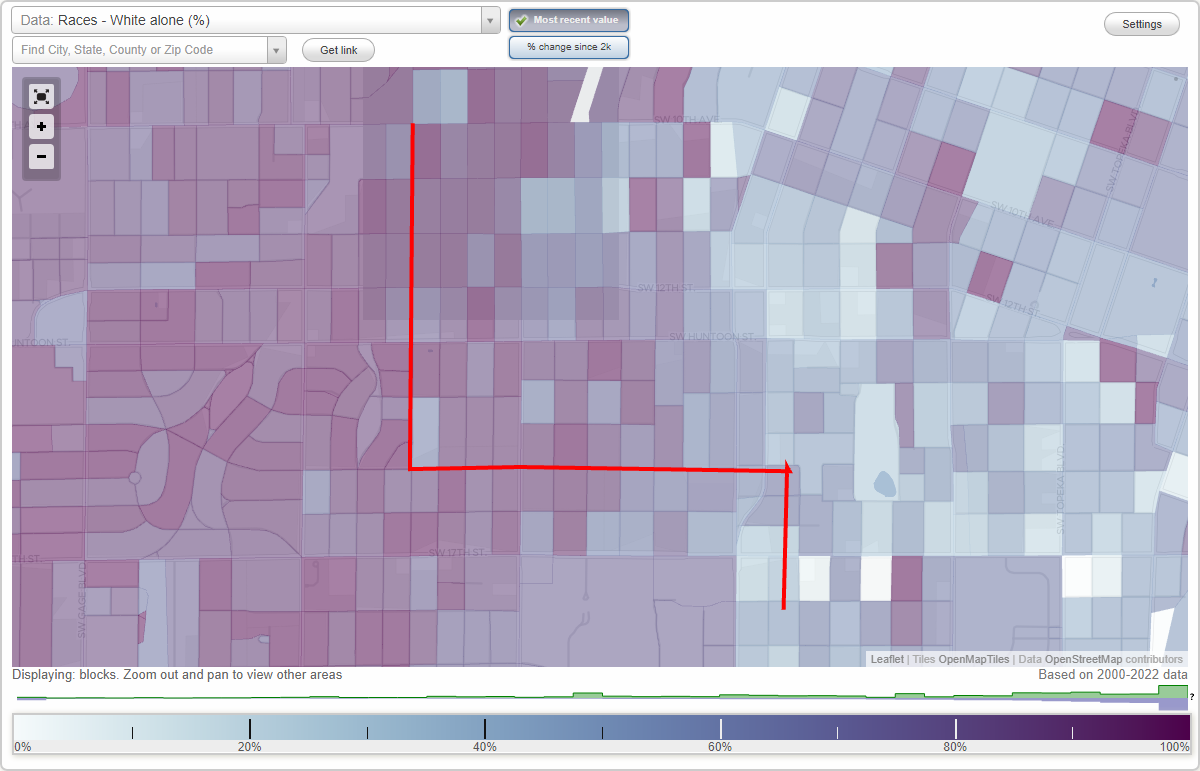
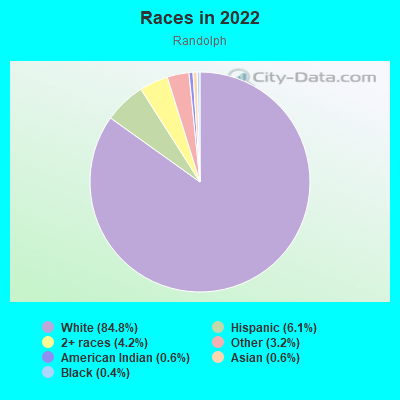
- 1,00884.8%White
- 736.1%Hispanic or Latino
- 504.2%Two or more races
- 383.2%Some other race
- 70.6%American Indian
- 70.6%Asian
- 50.4%Black
Median household income in 2022:
| Randolph: | $73,486 |
| Topeka: | $50,709 |
Distribution of median household income
![Distribution of median household income]()
- 9Less than $10,000
- 59$10,000 to $19,999
- 72$20,000 to $29,999
- 76$30,000 to $39,999
- 70$40,000 to $49,999
- 75$50,000 to $59,999
- 84$60,000 to $74,999
- 84$75,000 to $99,999
- 77$100,000 to $124,999
- 67$125,000 to $149,999
- 83$150,000 to $199,999
- 20$200,000 or more

Distribution of owner-occupied house/condo value
![Distribution of owner-occupied house/condo value]()
- 187Less than $50,000
- 301$50,000 to $99,999
- 171$100,000 to $149,999
- 74$150,000 to $199,999
- 11$200,000 to $249,999
- 58$250,000 to $299,999
- 8$300,000 to $399,999
- 1$400,000 to $499,999
- 2$500,000 to $749,999
- 3$750,000 to $999,999

Distribution of rent paid by renters
![Distribution of rent paid by renters]()
- 3Less than $100
- 9$200 to $299
- 50$300 to $399
- 73$400 to $499
- 21$500 to $599
- 27$600 to $699
- 46$700 to $799
- 28$800 to $899
- 34$900 to $999
- 29$1,000 to $1,249
- 7$1,250 to $1,499
- 40$2,000 or more

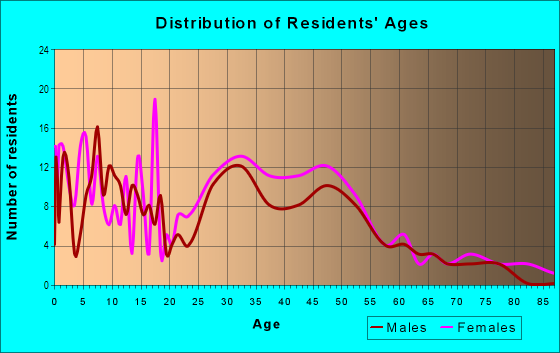
| Males: | 488 |
| Females: | 671 |
Males:
| This neighborhood: | 38.2 years |
| Whole city: | 37.1 years |
| This neighborhood: | 36.2 years |
| Whole city: | 38.8 years |
Average household size:
| Randolph: | 10.9 people |
| Topeka: | 2.2 people |
Percentage of family households:
| Randolph: | 35.2% |
| Topeka: | 38.2% |
| Here: | 36.2% |
| Topeka: | 35.2% |
Percentage of married-couple families with children (among all households):
| Randolph: | 27.5% |
| Topeka: | 27.5% |
Percentage of single-mother households (among all households):
| Randolph: | 21.1% |
| Topeka: | 10.7% |
Percentage of never married males 15 years old and over:
Percentage of never married females 15 years old and over:
| Randolph: | 7.1% |
| Topeka: | 19.2% |
Percentage of never married females 15 years old and over:
| Randolph: | 28.8% |
| city: | 17.5% |
Percentage of people that speak English not well or not at all:
| Randolph: | 0.0% |
| Topeka: | 2.2% |
Percentage of people born in this state:
Percentage of people born in another U.S. state:
Percentage of native residents but born outside the U.S.:
Percentage of foreign born residents:
| Here: | 70.1% |
| Topeka: | 67.1% |
Percentage of people born in another U.S. state:
| Randolph: | 24.7% |
| Topeka: | 25.0% |
Percentage of native residents but born outside the U.S.:
| Here: | 1.1% |
| city: | 1.7% |
Percentage of foreign born residents:
| Here: | 4.1% |
| Topeka: | 6.3% |
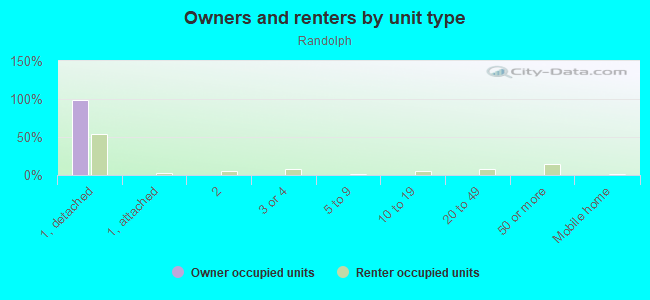
Owner-occupied
Renter-occupied

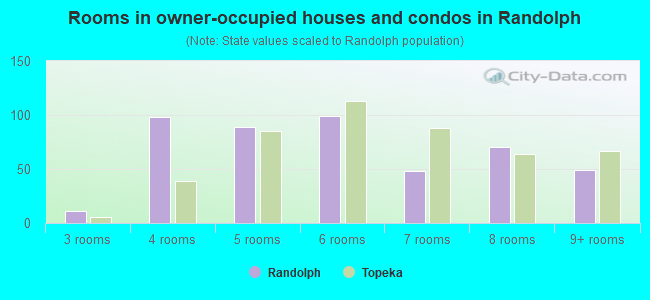
- Rooms in owner-occupied houses and condos in Randolph
- 01 room
- 02 rooms
- 113 rooms
- 984 rooms
- 895 rooms
- 996 rooms
- 487 rooms
- 708 rooms
- 499+ rooms
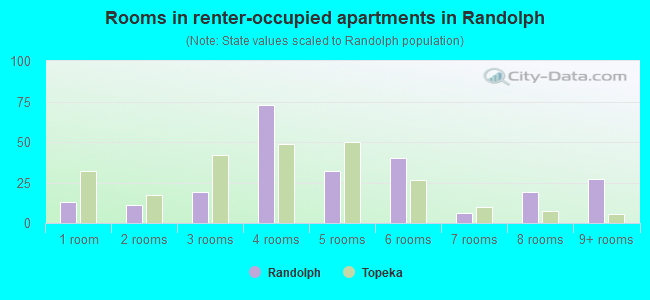
- Rooms in renter-occupied apartments in Randolph
- 131 room
- 112 rooms
- 193 rooms
- 734 rooms
- 325 rooms
- 406 rooms
- 67 rooms
- 198 rooms
- 279+ rooms
Owner-occupied
Renter-occupied
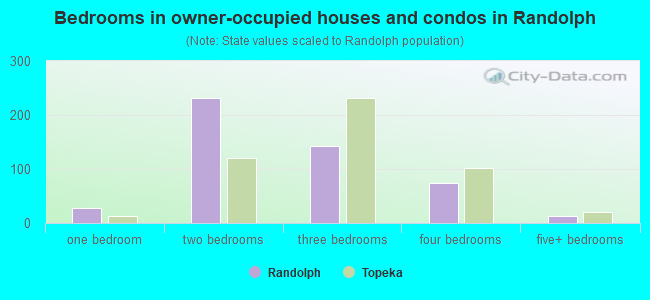
- Bedrooms in owner-occupied houses and condos in Randolph
- 0no bedroom
- 281 bedroom
- 2312 bedrooms
- 1423 bedrooms
- 744 bedrooms
- 135+ bedrooms
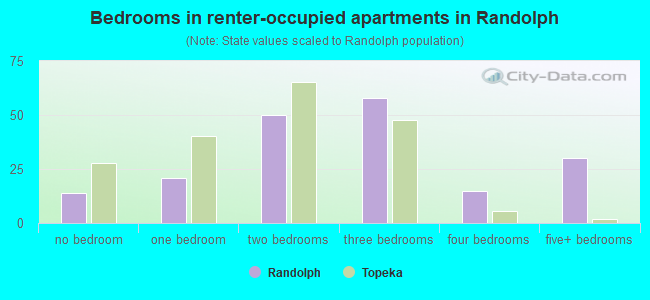
- Bedrooms in renter-occupied apartments in Randolph
- 14no bedroom
- 211 bedroom
- 502 bedrooms
- 583 bedrooms
- 154 bedrooms
- 305+ bedrooms
Average number of cars or other vehicles available in houses/condos:
Average number of cars or other vehicles available in apartments:
| This neighborhood: | 1.8 |
| Topeka: | 1.9 |
Average number of cars or other vehicles available in apartments:
| Here: | 1.5 |
| city: | 1.2 |
Percentage of units with a mortgage:
| Randolph: | 65.5% |
| Topeka: | 54.9% |
Average estimated value of detached houses in 2022 (96.9% of all units):
| Randolph: | $101,368 |
| Kansas: | $264,181 |
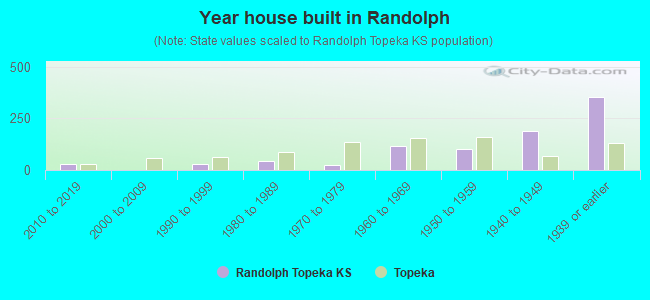
- Year house built in Randolph
- 02020 or later
- 282010 to 2019
- 12000 to 2009
- 301990 to 1999
- 451980 to 1989
- 241970 to 1979
- 1141960 to 1969
- 1021950 to 1959
- 1881940 to 1949
- 3521939 or earlier
City-data.com crime index for city in 2020 (higher means more crime):
| City: | 8.2 |
| U.S. average: | 219.5 |
Travel time to work (commute)
![Travel time to work (commute)]()
- 22Less than 5 minutes
- 955 to 9 minutes
- 12510 to 14 minutes
- 19315 to 19 minutes
- 6420 to 24 minutes
- 825 to 29 minutes
- 2330 to 34 minutes
- 1035 to 39 minutes
- 1640 to 44 minutes
- 3145 to 59 minutes
- 2160 to 89 minutes
- 490 or more minutes

Means of transportation to work
![Means of transportation to work]()
- 91.0%688Drove a car alone
- 12.0%91Carpooled
- 4.9%37Bus
- 0.7%5Motorcycle
- 4.1%31Bicycle
- 1.7%13Walked
- 1.5%11Other means
- 5.6%42Worked at home

Time leaving home to go to work
![Time leaving home to go to work]()
- 1912:00 a.m. to 4:59 a.m.
- 115:00 a.m. to 5:29 a.m.
- 85:30 a.m. to 5:59 a.m.
- 236:00 a.m. to 6:29 a.m.
- 506:30 a.m. to 6:59 a.m.
- 627:00 a.m. to 7:29 a.m.
- 1727:30 a.m. to 7:59 a.m.
- 438:00 a.m. to 8:29 a.m.
- 278:30 a.m. to 8:59 a.m.
- 499:00 a.m. to 9:59 a.m.
- 2710:00 a.m. to 10:59 a.m.
- 1411:00 a.m. to 11:59 a.m.
- 5912:00 p.m. to 3:59 p.m.
- 254:00 p.m. to 11:59 p.m.

Occupations of males:
- Percentage of males in management occupations (except farmers):
Here: 20.8% city: 9.3%
- Percentage of males in computer and mathematical occupations:
Here: 4.8% city: 4.7%
- Percentage of males in architecture and engineering occupations:
Here: 1.1% city: 2.5%
- Percentage of males in arts, design, entertainment, sports, and media occupations:
Here: 2.2% city: 1.2%
- Percentage of males in healthcare practitioners and technical occupations:
Here: 1.1% city: 2.0%
- Percentage of males in service occupations:
Here: 11.3% city: 16.6%
- Percentage of males in sales and office occupations:
Here: 11.9% city: 14.5%
- Percentage of males in farming, fishing, and forestry occupations:
Here: 2.8% city: 0.8%
- Percentage of males in construction, extraction, and maintenance occupations:
Here: 5.7% city: 9.7%
- Percentage of males in production occupations:
Here: 10.7% city: 8.2%
- Percentage of males in transportation occupations:
Here: 19.5% city: 4.6%
- Percentage of males in material moving occupations:
Here: 4.4% city: 8.9%
Occupations of females:
- Percentage of females in management occupations (except farmers):
Here: 5.4% city: 6.6%
- Percentage of females in business and financial operations occupations:
Here: 1.9% city: 6.9%
- Percentage of females in computer and mathematical occupations:
Here: 1.2% city: 1.7%
- Percentage of females in community and social services occupations:
Here: 1.4% city: 2.8%
- Percentage of females in legal occupations:
Here: 4.5% city: 1.0%
- Percentage of females in education, training, and library occupations:
Here: 7.2% city: 8.7%
- Percentage of females in healthcare practitioners and technical occupations:
Here: 8.9% city: 11.5%
- Percentage of females in service occupations:
Here: 28.8% city: 22.2%
- Percentage of females in sales and office occupations:
Here: 24.8% city: 26.9%
- Percentage of females in production occupations:
Here: 1.7% city: 3.3%
- Percentage of females in transportation occupations:
Here: 12.1% city: 0.9%
Percentage of people 16-64 in Armed Forces:
| Randolph: | 0.0% |
| Topeka: | 0.5% |
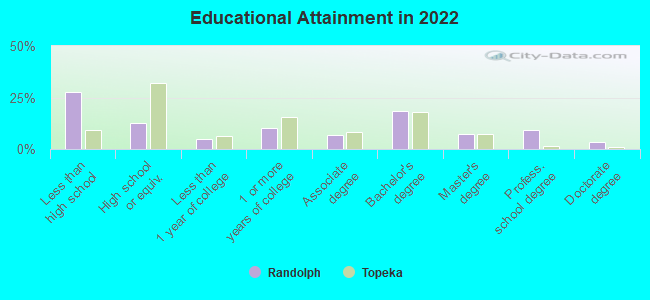
Education in this neighborhood (subdivision or community):
- Percentage of people 3 years and older in K-12 schools:
Randolph: 19.6% Topeka: 14.7%
- Percentage of people 3 years and older in undergraduate colleges:
Randolph: 7.4% Topeka: 4.3%
- Percentage of people 3 years and older in grad. or professional schools:
Randolph: 2.0% Topeka: 1.1%
- Percentage of students K-12 enrolled in private schools:
Randolph: 47.5% Topeka: 10.9%
Percentage of population below poverty level:
| Randolph: | 15.2% |
| Topeka: | 17.7% |
Median year owner moved in (as recorded in 2022):
| Randolph: | 2009 |
| Topeka: | 2011 |
Percentage of married-couple families with both working:
| Randolph: | 121.7% |
| Topeka: | 68.4% |
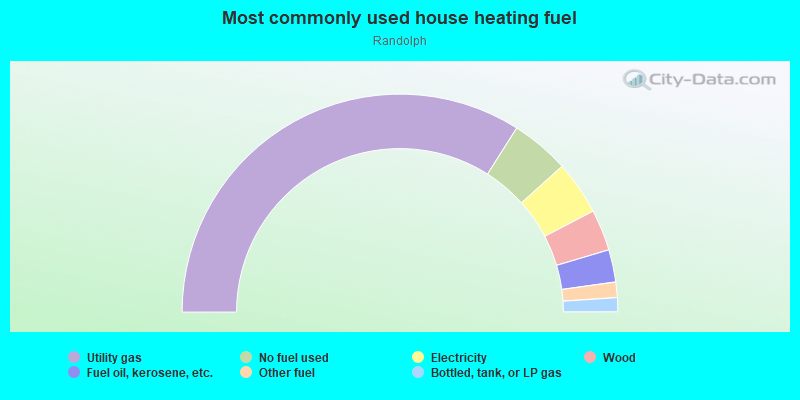
- 68.0%Utility gas
- 8.7%No fuel used
- 8.0%Electricity
- 6.1%Wood
- 4.8%Fuel oil, kerosene, etc.
- 2.3%Other fuel
- 2.1%Bottled, tank, or LP gas
Roads and streets:
SW High Ave
Length: 0.79 miles
Direction: N-S
Address range: 1000 to 1499
Direction: N-S
Address range: 1000 to 1499
SW Wayne Ave
Length: 0.79 miles
Direction: N-S
Address range: 1000 to 1499
Direction: N-S
Address range: 1000 to 1499
SW Medford Ave
Length: 0.67 miles
Direction: N-S
Address range: 1100 to 1499
Direction: N-S
Address range: 1100 to 1499
SW Macvicar Ave (SW Mac Vicar Ave)
Length: 0.59 miles
Direction: N-S
Address range: 1000 to 1298
Direction: N-S
Address range: 1000 to 1298
SW 13th St
Length: 0.24 miles
Direction: E-W
Address range: 2300 to 2599
Direction: E-W
Address range: 2300 to 2599
SW Huntoon St
Length: 0.24 miles
Direction: E-W
Address range: 2300 to 2599
Direction: E-W
Address range: 2300 to 2599
SW 12th St
Length: 0.24 miles
Direction: E-W
Address range: 2300 to 2599
Direction: E-W
Address range: 2300 to 2599
SW Munson Ave
Length: 0.24 miles
Direction: E-W
Address range: 2300 to 2599
Direction: E-W
Address range: 2300 to 2599
SW 11th St
Length: 0.24 miles
Direction: E-W
Address range: 2300 to 2599
Direction: E-W
Address range: 2300 to 2599
SW 10th Ave (SW 10th St)
Length: 0.16 miles
Direction: E-W
Address range: 2300 to 2499
Direction: E-W
Address range: 2300 to 2499
SW 15th St
Length: 0.08 miles
Direction: E-W
Address range: 2500 to 2599
Direction: E-W
Address range: 2500 to 2599