Red River District neighborhood in Austin, Texas (TX), 78701, 78702 detailed profile
Settings
X


Business Search - 14 Million verified businesses
Area: 0.086 square miles
Population: 635
Population density:
| Red River District: | 7,414 people per square mile |
| Austin: | 3,878 people per square mile |

- 31148.4%White
- 14522.6%Hispanic or Latino
- 9815.2%Black
- 416.4%Two or more races
- 365.6%Asian
- 111.7%Some other race
- 10.2%American Indian

Distribution of median household income
![Distribution of median household income]()
- 31Less than $10,000
- 22$10,000 to $19,999
- 15$20,000 to $29,999
- 20$30,000 to $39,999
- 13$40,000 to $49,999
- 10$50,000 to $59,999
- 26$60,000 to $74,999
- 28$75,000 to $99,999
- 55$100,000 to $124,999
- 31$125,000 to $149,999
- 30$150,000 to $199,999
- 68$200,000 or more

Distribution of owner-occupied house/condo value
![Distribution of owner-occupied house/condo value]()
- 12Less than $50,000
- 8$50,000 to $99,999
- 4$100,000 to $149,999
- 17$150,000 to $199,999
- 32$200,000 to $249,999
- 36$250,000 to $299,999
- 4$300,000 to $399,999
- 8$400,000 to $499,999
- 16$500,000 to $749,999
- 9$750,000 to $999,999
- 17$1,000,000 or more

Distribution of rent paid by renters
![Distribution of rent paid by renters]()
- 30Less than $100
- 11$100 to $199
- 27$200 to $299
- 28$300 to $399
- 42$400 to $499
- 1$600 to $699
- 13$700 to $799
- 7$800 to $899
- 5$900 to $999
- 21$1,000 to $1,249
- 5$1,250 to $1,499
- 123$1,500 to $1,999
- 125$2,000 or more

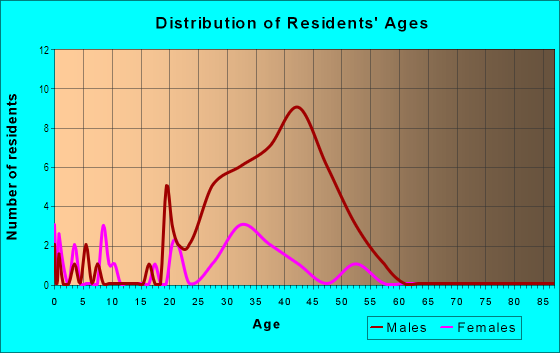
| Males: | 276 |
| Females: | 358 |
Males:
| This neighborhood: | 35.3 years |
| Whole city: | 34.5 years |
| This neighborhood: | 35.4 years |
| Whole city: | 34.4 years |
Average household size:
| Red River District: | 1.9 people |
| Austin: | 28.0 people |
Percentage of family households:
| Red River District: | 21.7% |
| Austin: | 36.6% |
| Here: | 17.0% |
| Austin: | 35.3% |
Percentage of married-couple families with children (among all households):
| Red River District: | 113.8% |
| Austin: | 36.3% |
Percentage of single-mother households (among all households):
| Red River District: | 23.5% |
| Austin: | 7.9% |
Percentage of never married males 15 years old and over:
Percentage of never married females 15 years old and over:
| Red River District: | 32.6% |
| Austin: | 25.0% |
Percentage of never married females 15 years old and over:
| Red River District: | 42.6% |
| city: | 19.9% |
Percentage of people that speak English not well or not at all:
| Red River District: | 0.0% |
| Austin: | 5.2% |
Percentage of people born in this state:
Percentage of people born in another U.S. state:
Percentage of native residents but born outside the U.S.:
Percentage of foreign born residents:
| Here: | 46.1% |
| Austin: | 48.2% |
Percentage of people born in another U.S. state:
| Red River District: | 38.5% |
| Austin: | 31.8% |
Percentage of native residents but born outside the U.S.:
| Here: | 2.6% |
| city: | 2.3% |
Percentage of foreign born residents:
| Here: | 12.8% |
| Austin: | 17.8% |

Owner-occupied
Renter-occupied


- Rooms in owner-occupied houses and condos in Red River District
- 191 room
- 42 rooms
- 373 rooms
- 44 rooms
- 145 rooms
- 106 rooms
- 37 rooms
- 18 rooms
- 19+ rooms

- Rooms in renter-occupied apartments in Red River District
- 121 room
- 1102 rooms
- 583 rooms
- 544 rooms
- 115 rooms
- 196 rooms
- 127 rooms
- 158 rooms
- 39+ rooms
Owner-occupied
Renter-occupied

- Bedrooms in owner-occupied houses and condos in Red River District
- 26no bedroom
- 81 bedroom
- 112 bedrooms
- 163 bedrooms
- 14 bedrooms
- 25+ bedrooms

- Bedrooms in renter-occupied apartments in Red River District
- 20no bedroom
- 1511 bedroom
- 832 bedrooms
- 213 bedrooms
- 114 bedrooms
- 05+ bedrooms
Average number of cars or other vehicles available in houses/condos:
Average number of cars or other vehicles available in apartments:
| This neighborhood: | 1.6 |
| Austin: | 1.9 |
Average number of cars or other vehicles available in apartments:
| Here: | 1.0 |
| city: | 1.3 |
Percentage of units with a mortgage:
| Red River District: | 80.5% |
| Austin: | 68.5% |
Housing prices:
- Average estimated value of detached houses in 2022 (18.5% of all units):
Red River District: $18,271,946 Austin: $737,673
- Average estimated value of townhouses or other attached units in 2022 (2.4% of all units):
This neighborhood: $564,524 city: $533,017
- Average estimated '22 value of housing units in 5-or-more-unit structures (74.2% of all units):
Red River District: $3,425,799 Austin: $800,345

- Year house built in Red River District
- 12020 or later
- 1492010 to 2019
- 1112000 to 2009
- 41990 to 1999
- 171980 to 1989
- 181970 to 1979
- 311960 to 1969
- 31950 to 1959
- 51940 to 1949
- 311939 or earlier

City-data.com crime index for city in 2020 (higher means more crime):
| City: | 316.8 |
| U.S. average: | 219.5 |
Travel time to work (commute)
![Travel time to work (commute)]()
- 25Less than 5 minutes
- 2565 to 9 minutes
- 22710 to 14 minutes
- 29215 to 19 minutes
- 17520 to 24 minutes
- 6825 to 29 minutes
- 10630 to 34 minutes
- 2035 to 39 minutes
- 2940 to 44 minutes
- 1845 to 59 minutes
- 3560 to 89 minutes

Means of transportation to work
![Means of transportation to work]()
- 45.2%195Drove a car alone
- 3.7%16Carpooled
- 1.6%7Bus
- 3.2%14Long-distance train or commuter rail
- 2.3%10Light rail, streetcar or trolley
- 1.2%5Taxi
- 3.5%15Motorcycle
- 2.1%9Bicycle
- 25.5%110Walked
- 3.0%13Other means
- 19.7%85Worked at home

Time leaving home to go to work
![Time leaving home to go to work]()
- 2612:00 a.m. to 4:59 a.m.
- 75:00 a.m. to 5:29 a.m.
- 415:30 a.m. to 5:59 a.m.
- 556:00 a.m. to 6:29 a.m.
- 236:30 a.m. to 6:59 a.m.
- 1197:00 a.m. to 7:29 a.m.
- 2077:30 a.m. to 7:59 a.m.
- 1798:00 a.m. to 8:29 a.m.
- 1748:30 a.m. to 8:59 a.m.
- 1669:00 a.m. to 9:59 a.m.
- 7510:00 a.m. to 10:59 a.m.
- 3411:00 a.m. to 11:59 a.m.
- 8512:00 p.m. to 3:59 p.m.
- 934:00 p.m. to 11:59 p.m.

Occupations of males:
- Percentage of males in management occupations (except farmers):
Here: 25.4% city: 15.3%
- Percentage of males in business and financial operations occupations:
Here: 3.2% city: 7.0%
- Percentage of males in computer and mathematical occupations:
Here: 21.5% city: 12.0%
- Percentage of males in architecture and engineering occupations:
Here: 2.7% city: 5.1%
- Percentage of males in legal occupations:
Here: 4.6% city: 1.9%
- Percentage of males in education, training, and library occupations:
Here: 4.7% city: 4.1%
- Percentage of males in arts, design, entertainment, sports, and media occupations:
Here: 11.3% city: 4.1%
- Percentage of males in healthcare practitioners and technical occupations:
Here: 2.2% city: 2.3%
- Percentage of males in service occupations:
Here: 7.2% city: 11.2%
- Percentage of males in sales and office occupations:
Here: 9.8% city: 14.9%
- Percentage of males in construction, extraction, and maintenance occupations:
Here: 5.6% city: 7.1%
Occupations of females:
- Percentage of females in management occupations (except farmers):
Here: 15.9% city: 13.5%
- Percentage of females in business and financial operations occupations:
Here: 21.2% city: 11.0%
- Percentage of females in computer and mathematical occupations:
Here: 5.4% city: 4.0%
- Percentage of females in architecture and engineering occupations:
Here: 2.7% city: 1.6%
- Percentage of females in life, physical, and social science occupations:
Here: 1.6% city: 1.7%
- Percentage of females in community and social services occupations:
Here: 2.3% city: 2.2%
- Percentage of females in legal occupations:
Here: 4.1% city: 2.4%
- Percentage of females in education, training, and library occupations:
Here: 3.3% city: 9.0%
- Percentage of females in arts, design, entertainment, sports, and media occupations:
Here: 2.7% city: 4.5%
- Percentage of females in healthcare practitioners and technical occupations:
Here: 5.3% city: 7.8%
- Percentage of females in service occupations:
Here: 9.2% city: 15.8%
- Percentage of females in sales and office occupations:
Here: 23.5% city: 22.9%
- Percentage of females in material moving occupations:
Here: 2.2% city: 0.9%
Education in this neighborhood (subdivision or community):
- Percentage of people 3 years and older in K-12 schools:
Red River District: 11.8% Austin: 12.4%
- Percentage of people 3 years and older in undergraduate colleges:
Red River District: 28.9% Austin: 6.1%
- Percentage of people 3 years and older in grad. or professional schools:
Red River District: 3.4% Austin: 2.5%
- Percentage of students K-12 enrolled in private schools:
Red River District: 38.4% Austin: 11.8%
Percentage of population below poverty level:
| Red River District: | 23.1% |
| Austin: | 11.1% |
Median year owner moved in (as recorded in 2022):
Median year renter moved in (as recorded in 2022):
| Red River District: | 2014 |
| Austin: | 2013 |
Median year renter moved in (as recorded in 2022):
| Red River District: | 2016 |
| Austin: | 2021 |
Percentage of married-couple families with both working:
| Red River District: | 48.6% |
| Austin: | 68.5% |

- 49.0%Electricity
- 39.5%Utility gas
- 4.8%Other fuel
- 3.5%Bottled, tank, or LP gas
- 2.5%Fuel oil, kerosene, etc.
- 0.7%No fuel used
Limited-access highways (interstate or state) in this neighborhood:
US Hwy 290 (I- 35)
Length: 0.31 miles
Direction: N-S
Direction: N-S
Roads and streets:
Red River St
Length: 0.29 miles
Direction: N-S
Address range: 800 to 1199
Direction: N-S
Address range: 800 to 1199
Neches St
Length: 0.29 miles
Direction: N-S
Address range: 800 to 1199
Direction: N-S
Address range: 800 to 1199
E 8th St
Length: 0.27 miles
Direction: E-W
Address range: 500 to 799
Direction: E-W
Address range: 500 to 799
E 12th St
Length: 0.23 miles
Direction: E-W
Address range: 500 to 799
Direction: E-W
Address range: 500 to 799
E 9th St
Length: 0.23 miles
Direction: E-W
Address range: 500 to 799
Direction: E-W
Address range: 500 to 799
E 10th St
Length: 0.23 miles
Direction: E-W
Address range: 500 to 799
Direction: E-W
Address range: 500 to 799
E 11th St
Length: 0.23 miles
Direction: E-W
Address range: 500 to 799
Direction: E-W
Address range: 500 to 799
I- 35 Svc Rd N (N I- 35 Svc Rd)
Length: 0.21 miles
Direction: N-S
Address range: 800 to 1098
Direction: N-S
Address range: 800 to 1098
N I- 35 Svc Rd (I- 35 Svc Rd N, East Ave)
Length: 0.09 miles
Direction: N-S
Address range: 1100 to 1198
Direction: N-S
Address range: 1100 to 1198
Sabine St
Length: 0.09 miles
Direction: N-S
Address range: 1100 to 1199
Direction: N-S
Address range: 1100 to 1199
11th St E
Length: 0.02 miles
Direction: E-W
Direction: E-W
12th St E
Length: 0.02 miles
Direction: E-W
Direction: E-W
Other features:
Waller Crk
Length: 0.36 miles
Directions: E-W, N-S, SE-NW, SW-NE
Directions: E-W, N-S, SE-NW, SW-NE