Redlands Mesa neighborhood in Grand Junction, Colorado (CO), 81503 detailed profile
Settings
X


Business Search - 14 Million verified businesses
Area: 0.764 square miles
Population: 355
Population density:
| Redlands Mesa: | 465 people per square mile |
| Grand Junction: | 2,209 people per square mile |

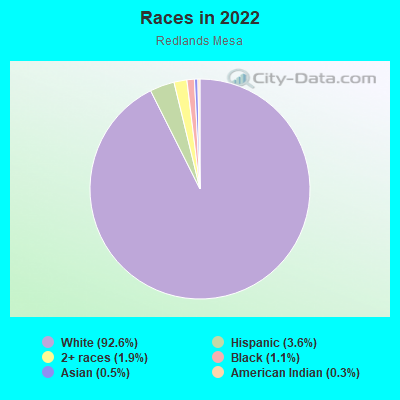
- 33992.6%White
- 133.6%Hispanic or Latino
- 71.9%Two or more races
- 41.1%Black
- 20.5%Asian
- 10.3%American Indian
Median household income in 2022:
| Redlands Mesa: | $136,563 |
| Grand Junction: | $61,458 |
Distribution of median household income
![Distribution of median household income]()
- 4Less than $10,000
- 7$10,000 to $19,999
- 7$20,000 to $29,999
- 5$30,000 to $39,999
- 8$40,000 to $49,999
- 9$50,000 to $59,999
- 9$60,000 to $74,999
- 19$75,000 to $99,999
- 12$100,000 to $124,999
- 12$125,000 to $149,999
- 20$150,000 to $199,999
- 39$200,000 or more

Distribution of owner-occupied house/condo value
![Distribution of owner-occupied house/condo value]()
- 2$50,000 to $99,999
- 4$150,000 to $199,999
- 11$200,000 to $249,999
- 15$250,000 to $299,999
- 15$300,000 to $399,999
- 17$400,000 to $499,999
- 52$500,000 to $749,999
- 41$750,000 to $999,999
- 4$1,000,000 or more

Distribution of rent paid by renters
![Distribution of rent paid by renters]()
- 5$900 to $999
- 1$1,000 to $1,249
- 3$1,250 to $1,499
- 7$1,500 to $1,999

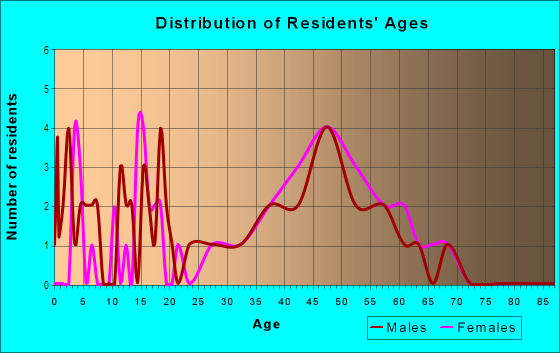
| Males: | 178 |
| Females: | 176 |
Males:
| This neighborhood: | 58.2 years |
| Whole city: | 35.2 years |
| This neighborhood: | 58.9 years |
| Whole city: | 41.4 years |
Average household size:
| Redlands Mesa: | 2.6 people |
| Grand Junction: | 2.3 people |
Percentage of family households:
| Redlands Mesa: | 44.7% |
| Grand Junction: | 41.5% |
| Here: | 83.2% |
| Grand Junction: | 44.5% |
Percentage of married-couple families with children (among all households):
| Redlands Mesa: | 32.2% |
| Grand Junction: | 30.4% |
Percentage of single-mother households (among all households):
| Redlands Mesa: | 4.0% |
| Grand Junction: | 7.7% |
Percentage of never married males 15 years old and over:
Percentage of never married females 15 years old and over:
| Redlands Mesa: | 6.8% |
| Grand Junction: | 20.7% |
Percentage of never married females 15 years old and over:
| Redlands Mesa: | 7.7% |
| city: | 15.0% |
Percentage of people that speak English not well or not at all:
| Redlands Mesa: | 0.6% |
| Grand Junction: | 0.8% |
Percentage of people born in this state:
Percentage of people born in another U.S. state:
Percentage of native residents but born outside the U.S.:
Percentage of foreign born residents:
| Here: | 33.7% |
| Grand Junction: | 47.4% |
Percentage of people born in another U.S. state:
| Redlands Mesa: | 63.2% |
| Grand Junction: | 47.0% |
Percentage of native residents but born outside the U.S.:
| Here: | 1.2% |
| city: | 1.0% |
Percentage of foreign born residents:
| Here: | 2.0% |
| Grand Junction: | 4.7% |
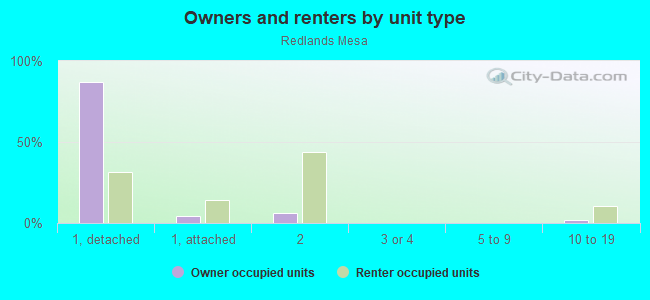
Owner-occupied
Renter-occupied

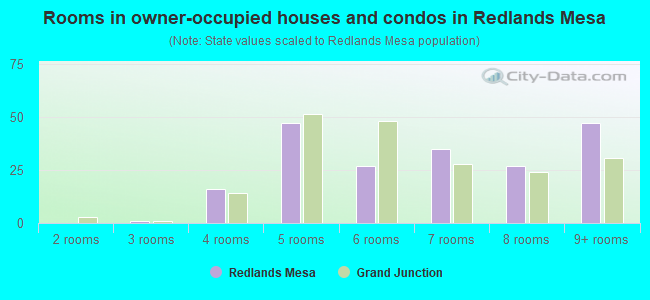
- Rooms in owner-occupied houses and condos in Redlands Mesa
- 01 room
- 02 rooms
- 13 rooms
- 164 rooms
- 475 rooms
- 276 rooms
- 357 rooms
- 278 rooms
- 479+ rooms
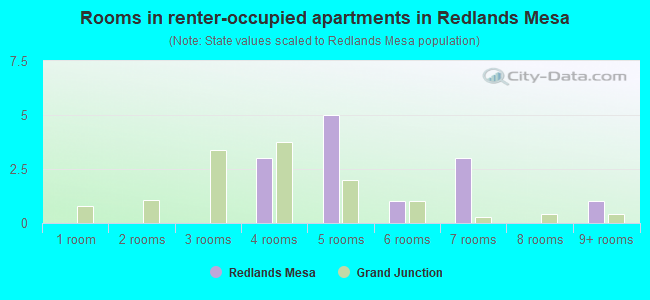
- Rooms in renter-occupied apartments in Redlands Mesa
- 01 room
- 02 rooms
- 03 rooms
- 34 rooms
- 55 rooms
- 16 rooms
- 37 rooms
- 08 rooms
- 19+ rooms
Owner-occupied
Renter-occupied
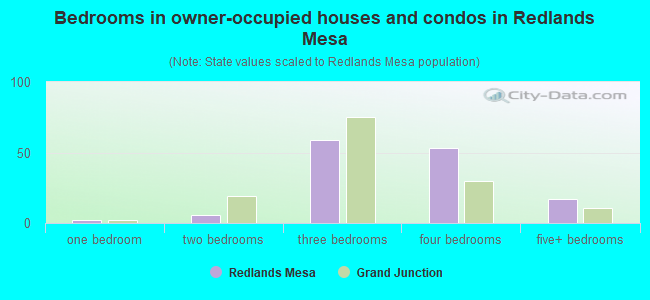
- Bedrooms in owner-occupied houses and condos in Redlands Mesa
- 0no bedroom
- 21 bedroom
- 62 bedrooms
- 593 bedrooms
- 534 bedrooms
- 175+ bedrooms
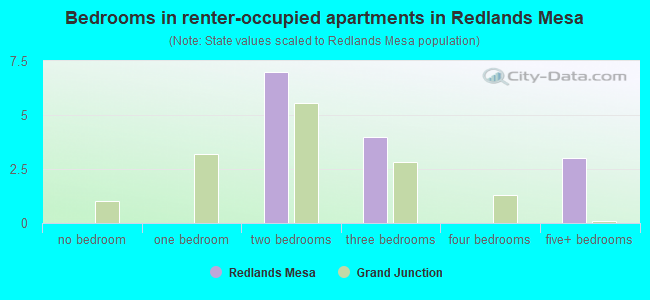
- Bedrooms in renter-occupied apartments in Redlands Mesa
- 0no bedroom
- 01 bedroom
- 72 bedrooms
- 43 bedrooms
- 04 bedrooms
- 35+ bedrooms
Average number of cars or other vehicles available in houses/condos:
Average number of cars or other vehicles available in apartments:
| This neighborhood: | 2.5 |
| Grand Junction: | 2.2 |
Average number of cars or other vehicles available in apartments:
| Here: | |
| city: |
Percentage of units with a mortgage:
| Redlands Mesa: | 57.9% |
| Grand Junction: | 65.2% |
Average estimated value of detached houses in 2022 (100.0% of all units):
| Redlands Mesa: | $589,351 |
| Grand Junction: | $357,130 |
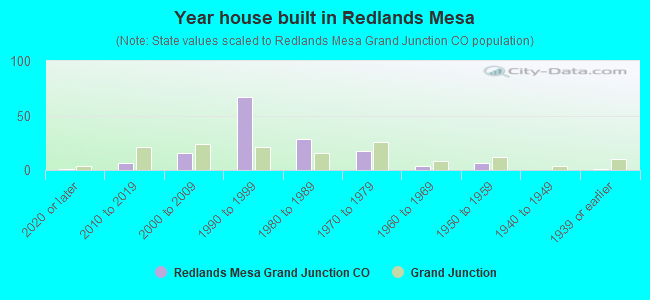
- Year house built in Redlands Mesa
- 12020 or later
- 62010 to 2019
- 162000 to 2009
- 671990 to 1999
- 281980 to 1989
- 171970 to 1979
- 41960 to 1969
- 61950 to 1959
- 01940 to 1949
- 11939 or earlier
City-data.com crime index for city in 2020 (higher means more crime):
| City: | 384.0 |
| U.S. average: | 219.5 |
Travel time to work (commute)
![Travel time to work (commute)]()
- 3Less than 5 minutes
- 105 to 9 minutes
- 5110 to 14 minutes
- 6215 to 19 minutes
- 4220 to 24 minutes
- 235 to 39 minutes
- 145 to 59 minutes
- 160 to 89 minutes
- 290 or more minutes

Means of transportation to work
![Means of transportation to work]()
- 81.6%123Drove a car alone
- 2.0%3Carpooled
- 0.7%1Bicycle
- 1.3%2Walked
- 0.7%1Other means
- 15.2%23Worked at home

Time leaving home to go to work
![Time leaving home to go to work]()
- 45:00 a.m. to 5:29 a.m.
- 105:30 a.m. to 5:59 a.m.
- 46:00 a.m. to 6:29 a.m.
- 206:30 a.m. to 6:59 a.m.
- 217:00 a.m. to 7:29 a.m.
- 607:30 a.m. to 7:59 a.m.
- 268:00 a.m. to 8:29 a.m.
- 78:30 a.m. to 8:59 a.m.
- 59:00 a.m. to 9:59 a.m.
- 510:00 a.m. to 10:59 a.m.
- 412:00 p.m. to 3:59 p.m.
- 54:00 p.m. to 11:59 p.m.

Occupations of males:
- Percentage of males in management occupations (except farmers):
Here: 29.6% city: 11.9%
- Percentage of males in business and financial operations occupations:
Here: 2.2% city: 2.7%
- Percentage of males in computer and mathematical occupations:
Here: 5.8% city: 2.6%
- Percentage of males in architecture and engineering occupations:
Here: 6.2% city: 3.0%
- Percentage of males in life, physical, and social science occupations:
Here: 4.7% city: 0.7%
- Percentage of males in community and social services occupations:
Here: 5.1% city: 2.6%
- Percentage of males in legal occupations:
Here: 3.3% city: 0.6%
- Percentage of males in education, training, and library occupations:
Here: 7.9% city: 3.4%
- Percentage of males in arts, design, entertainment, sports, and media occupations:
Here: 5.3% city: 2.8%
- Percentage of males in healthcare practitioners and technical occupations:
Here: 14.1% city: 4.1%
- Percentage of males in service occupations:
Here: 9.8% city: 15.2%
- Percentage of males in sales and office occupations:
Here: 19.8% city: 14.3%
- Percentage of males in production occupations:
Here: 2.5% city: 6.0%
- Percentage of males in transportation occupations:
Here: 4.9% city: 7.4%
- Percentage of males in material moving occupations:
Here: 7.6% city: 3.8%
Occupations of females:
- Percentage of females in management occupations (except farmers):
Here: 4.9% city: 9.3%
- Percentage of females in business and financial operations occupations:
Here: 11.6% city: 4.7%
- Percentage of females in architecture and engineering occupations:
Here: 7.5% city: 1.2%
- Percentage of females in life, physical, and social science occupations:
Here: 4.6% city: 1.5%
- Percentage of females in community and social services occupations:
Here: 2.5% city: 2.7%
- Percentage of females in legal occupations:
Here: 5.0% city: 1.2%
- Percentage of females in education, training, and library occupations:
Here: 12.5% city: 9.5%
- Percentage of females in arts, design, entertainment, sports, and media occupations:
Here: 3.7% city: 1.5%
- Percentage of females in healthcare practitioners and technical occupations:
Here: 25.5% city: 13.3%
- Percentage of females in service occupations:
Here: 9.9% city: 20.7%
- Percentage of females in sales and office occupations:
Here: 37.1% city: 28.2%
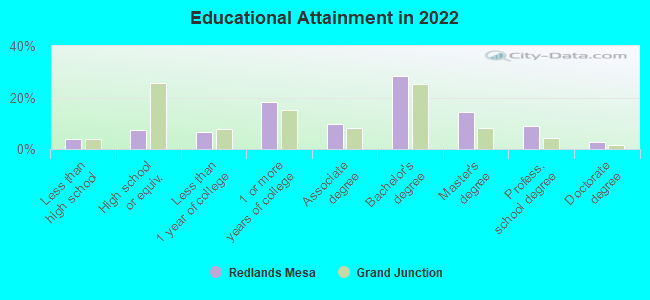
Education in this neighborhood (subdivision or community):
- Percentage of people 3 years and older in K-12 schools:
Redlands Mesa: 13.4% Grand Junction: 13.5%
- Percentage of people 3 years and older in undergraduate colleges:
Redlands Mesa: 2.9% Grand Junction: 8.2%
- Percentage of people 3 years and older in grad. or professional schools:
Redlands Mesa: 0.0% Grand Junction: 0.8%
- Percentage of students K-12 enrolled in private schools:
Redlands Mesa: 0.0% Grand Junction: 12.8%
Percentage of population below poverty level:
| Redlands Mesa: | 4.6% |
| Grand Junction: | 14.1% |
Median year owner moved in (as recorded in 2022):
| Redlands Mesa: | 2008 |
| Grand Junction: | 2013 |
Percentage of married-couple families with both working:
| Redlands Mesa: | 55.3% |
| Grand Junction: | 62.1% |
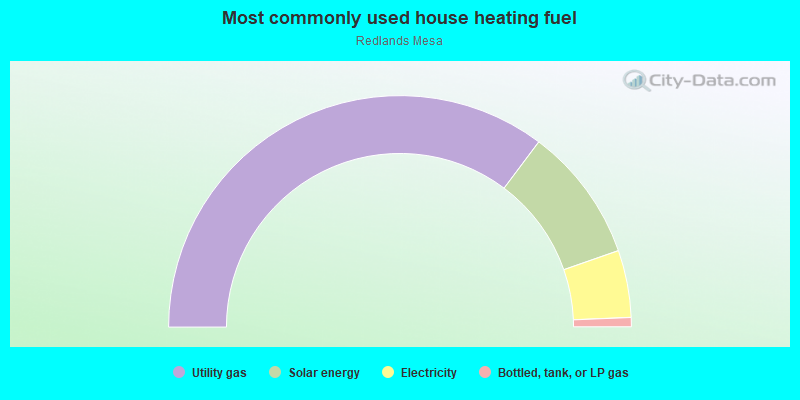
- 70.5%Utility gas
- 18.8%Solar energy
- 9.4%Electricity
- 1.3%Bottled, tank, or LP gas
Roads and streets:
W Ridges Blvd
Length: 1.11 miles
Directions: E-W, N-S, SE-NW, SW-NE
Address range: 300 to 2499
Directions: E-W, N-S, SE-NW, SW-NE
Address range: 300 to 2499
Meridian Ct
Length: 0.30 miles
Directions: E-W, N-S, SE-NW, SW-NE
Directions: E-W, N-S, SE-NW, SW-NE
Iron Horse Ct
Length: 0.22 miles
Directions: E-W, N-S, SE-NW, SW-NE
Directions: E-W, N-S, SE-NW, SW-NE
Red Ridge Ct
Length: 0.20 miles
Directions: E-W, N-S, SE-NW, SW-NE
Address range: 300 to 399
Directions: E-W, N-S, SE-NW, SW-NE
Address range: 300 to 399
Shadow Lake Ct
Length: 0.19 miles
Directions: E-W, N-S, SE-NW, SW-NE
Address range: 300 to 399
Directions: E-W, N-S, SE-NW, SW-NE
Address range: 300 to 399
Yellow Cat Ct
Length: 0.14 miles
Directions: E-W, N-S, SE-NW, SW-NE
Directions: E-W, N-S, SE-NW, SW-NE
Hearthstone Ct
Length: 0.13 miles
Directions: E-W, N-S, SE-NW, SW-NE
Directions: E-W, N-S, SE-NW, SW-NE
Claystone Ct
Length: 0.13 miles
Directions: E-W, N-S, SE-NW, SW-NE
Address range: 2300 to 2399
Directions: E-W, N-S, SE-NW, SW-NE
Address range: 2300 to 2399
Shadow Lake Cir
Length: 0.06 miles
Directions: E-W, N-S, SE-NW, SW-NE
Address range: 300 to 399
Directions: E-W, N-S, SE-NW, SW-NE
Address range: 300 to 399
Lions Paw Ct
Length: 0.03 miles
Directions: E-W, SE-NW
Directions: E-W, SE-NW