Renaissance Zone neighborhood in Bismarck, North Dakota (ND), 58501, 58504 detailed profile
Settings
X


Business Search - 14 Million verified businesses
Area: 0.192 square miles
Population: 300
Population density:
| Renaissance Zone: | 1,560 people per square mile |
| Bismarck: | 2,769 people per square mile |

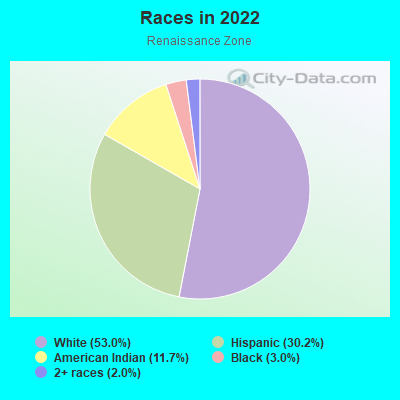
- 15853.0%White
- 9030.2%Hispanic or Latino
- 3511.7%American Indian
- 93.0%Black
- 62.0%Two or more races
Median household income in 2022:
| Renaissance Zone: | $35,156 |
| Bismarck: | $74,247 |
Distribution of median household income
![Distribution of median household income]()
- 27Less than $10,000
- 41$10,000 to $19,999
- 26$20,000 to $29,999
- 44$30,000 to $39,999
- 31$40,000 to $49,999
- 21$50,000 to $59,999
- 4$60,000 to $74,999
- 18$75,000 to $99,999
- 22$100,000 to $124,999
- 29$125,000 to $149,999
- 7$150,000 to $199,999
- 7$200,000 or more

Distribution of owner-occupied house/condo value
![Distribution of owner-occupied house/condo value]()
- 4Less than $50,000
- 4$50,000 to $99,999
- 13$100,000 to $149,999
- 5$150,000 to $199,999
- 33$200,000 to $249,999
- 21$250,000 to $299,999
- 6$300,000 to $399,999
- 8$400,000 to $499,999
- 10$500,000 to $749,999

Distribution of rent paid by renters
![Distribution of rent paid by renters]()
- 11Less than $100
- 9$100 to $199
- 31$200 to $299
- 36$300 to $399
- 26$400 to $499
- 15$500 to $599
- 17$600 to $699
- 42$700 to $799
- 14$800 to $899
- 4$900 to $999
- 13$1,000 to $1,249
- 7$1,250 to $1,499

Median rent in 2022:
| Renaissance Zone: | $445 |
| Bismarck: | $822 |
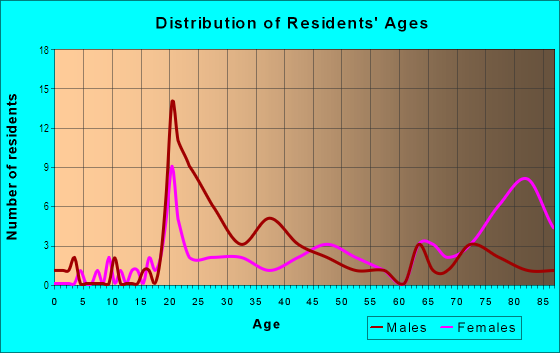
| Males: | 145 |
| Females: | 155 |
Males:
| This neighborhood: | 31.9 years |
| Whole city: | 37.2 years |
| This neighborhood: | 47.3 years |
| Whole city: | 39.5 years |
Average household size:
| Renaissance Zone: | 1.7 people |
| Bismarck: | 2.2 people |
Percentage of family households:
| Renaissance Zone: | 6.8% |
| Bismarck: | 40.1% |
| Here: | 40.8% |
| Bismarck: | 45.9% |
Percentage of married-couple families with children (among all households):
| Renaissance Zone: | 47.0% |
| Bismarck: | 32.4% |
Percentage of single-mother households (among all households):
| Renaissance Zone: | 56.2% |
| Bismarck: | 8.9% |
Percentage of never married males 15 years old and over:
Percentage of never married females 15 years old and over:
| Renaissance Zone: | 35.4% |
| Bismarck: | 18.2% |
Percentage of never married females 15 years old and over:
| Renaissance Zone: | 18.6% |
| city: | 14.5% |
Percentage of people that speak English not well or not at all:
| Renaissance Zone: | 0.0% |
| Bismarck: | 0.4% |
Percentage of people born in this state:
Percentage of people born in another U.S. state:
Percentage of native residents but born outside the U.S.:
Percentage of foreign born residents:
| Here: | 65.3% |
| Bismarck: | 69.4% |
Percentage of people born in another U.S. state:
| Renaissance Zone: | 32.1% |
| Bismarck: | 22.2% |
Percentage of native residents but born outside the U.S.:
| Here: | 1.1% |
| city: | 2.4% |
Percentage of foreign born residents:
| Here: | 1.5% |
| Bismarck: | 6.0% |
Owner-occupied
Renter-occupied

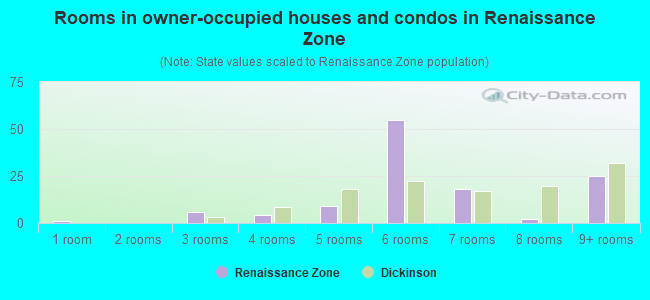
- Rooms in owner-occupied houses and condos in Renaissance Zone
- 01 room
- 02 rooms
- 33 rooms
- 54 rooms
- 85 rooms
- 126 rooms
- 217 rooms
- 48 rooms
- 499+ rooms
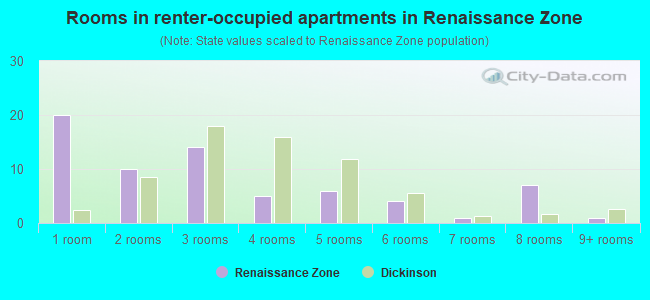
- Rooms in renter-occupied apartments in Renaissance Zone
- 101 room
- 302 rooms
- 373 rooms
- 744 rooms
- 05 rooms
- 116 rooms
- 77 rooms
- 28 rooms
- 39+ rooms
Owner-occupied
Renter-occupied
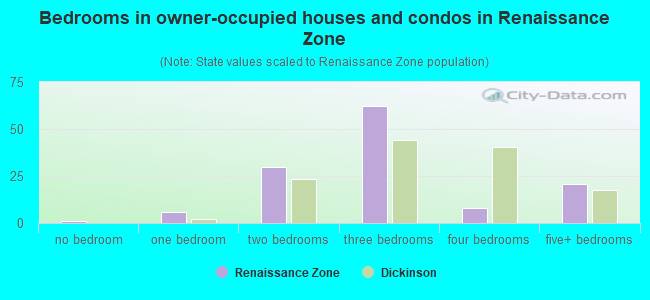
- Bedrooms in owner-occupied houses and condos in Renaissance Zone
- 0no bedroom
- 11 bedroom
- 32 bedrooms
- 383 bedrooms
- 354 bedrooms
- 55+ bedrooms
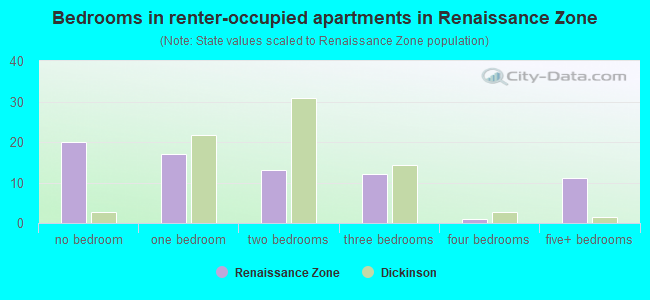
- Bedrooms in renter-occupied apartments in Renaissance Zone
- 10no bedroom
- 751 bedroom
- 782 bedrooms
- 103 bedrooms
- 114 bedrooms
- 05+ bedrooms
Average number of cars or other vehicles available in houses/condos:
Average number of cars or other vehicles available in apartments:
| This neighborhood: | 64.7 |
| Bismarck: | 2.3 |
Average number of cars or other vehicles available in apartments:
| Here: | 1.2 |
| city: | 1.4 |
Percentage of units with a mortgage:
| Renaissance Zone: | 11.5% |
| Bismarck: | 56.6% |
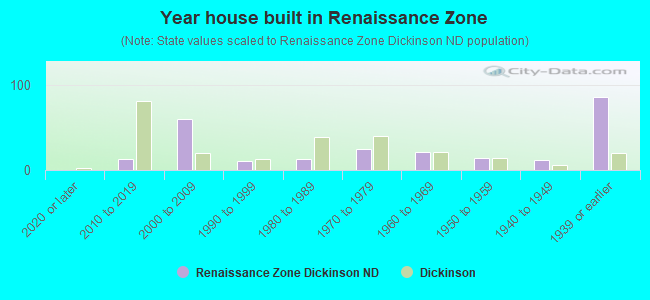
- Year house built in Renaissance Zone
- 02020 or later
- 42010 to 2019
- 82000 to 2009
- 51990 to 1999
- 341980 to 1989
- 801970 to 1979
- 171960 to 1969
- 141950 to 1959
- 31940 to 1949
- 211939 or earlier
City-data.com crime index for city in 2020 (higher means more crime):
| City: | 271.0 |
| U.S. average: | 219.5 |
Travel time to work (commute)
![Travel time to work (commute)]()
- 23Less than 5 minutes
- 1245 to 9 minutes
- 10710 to 14 minutes
- 5115 to 19 minutes
- 720 to 24 minutes
- 625 to 29 minutes
- 430 to 34 minutes
- 745 to 59 minutes
- 860 to 89 minutes
- 590 or more minutes

Means of transportation to work
![Means of transportation to work]()
- 47.4%49Drove a car alone
- 22.3%23Carpooled
- 28.1%29Walked
- 1.0%1Other means
- 4.8%5Worked at home

Time leaving home to go to work
![Time leaving home to go to work]()
- 5012:00 a.m. to 4:59 a.m.
- 65:00 a.m. to 5:29 a.m.
- 185:30 a.m. to 5:59 a.m.
- 216:00 a.m. to 6:29 a.m.
- 146:30 a.m. to 6:59 a.m.
- 397:00 a.m. to 7:29 a.m.
- 577:30 a.m. to 7:59 a.m.
- 268:00 a.m. to 8:29 a.m.
- 258:30 a.m. to 8:59 a.m.
- 159:00 a.m. to 9:59 a.m.
- 410:00 a.m. to 10:59 a.m.
- 511:00 a.m. to 11:59 a.m.
- 2712:00 p.m. to 3:59 p.m.
- 314:00 p.m. to 11:59 p.m.

Occupations of males:
- Percentage of males in management occupations (except farmers):
Here: 28.8% city: 10.0%
- Percentage of males in business and financial operations occupations:
Here: 1.7% city: 6.5%
- Percentage of males in computer and mathematical occupations:
Here: 8.7% city: 4.6%
- Percentage of males in architecture and engineering occupations:
Here: 7.1% city: 3.8%
- Percentage of males in life, physical, and social science occupations:
Here: 5.6% city: 1.1%
- Percentage of males in community and social services occupations:
Here: 5.1% city: 1.3%
- Percentage of males in legal occupations:
Here: 3.7% city: 0.9%
- Percentage of males in education, training, and library occupations:
Here: 7.1% city: 2.7%
- Percentage of males in healthcare practitioners and technical occupations:
Here: 11.6% city: 3.9%
- Percentage of males in service occupations:
Here: 29.7% city: 13.8%
- Percentage of males in sales and office occupations:
Here: 70.8% city: 17.6%
- Percentage of males in construction, extraction, and maintenance occupations:
Here: 13.5% city: 9.8%
- Percentage of males in production occupations:
Here: 20.9% city: 5.0%
- Percentage of males in transportation occupations:
Here: 25.2% city: 7.0%
- Percentage of males in material moving occupations:
Here: 20.0% city: 3.8%
Occupations of females:
- Percentage of females in management occupations (except farmers):
Here: 39.2% city: 8.7%
- Percentage of females in business and financial operations occupations:
Here: 28.7% city: 5.9%
- Percentage of females in computer and mathematical occupations:
Here: 8.5% city: 1.0%
- Percentage of females in community and social services occupations:
Here: 3.4% city: 2.5%
- Percentage of females in education, training, and library occupations:
Here: 13.1% city: 10.4%
- Percentage of females in arts, design, entertainment, sports, and media occupations:
Here: 8.0% city: 2.2%
- Percentage of females in healthcare practitioners and technical occupations:
Here: 64.3% city: 16.8%
- Percentage of females in service occupations:
Here: 35.6% city: 19.7%
- Percentage of females in sales and office occupations:
Here: 40.2% city: 25.0%
- Percentage of females in production occupations:
Here: 20.7% city: 1.5%
- Percentage of females in material moving occupations:
Here: 27.1% city: 1.5%
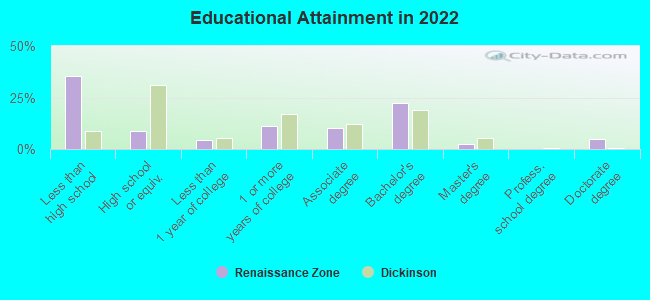
Education in this neighborhood (subdivision or community):
- Percentage of people 3 years and older in K-12 schools:
Renaissance Zone: 20.7% Bismarck: 15.5%
- Percentage of people 3 years and older in undergraduate colleges:
Renaissance Zone: 12.6% Bismarck: 4.2%
- Percentage of people 3 years and older in grad. or professional schools:
Renaissance Zone: 4.9% Bismarck: 1.7%
- Percentage of students K-12 enrolled in private schools:
Renaissance Zone: 15.7% Bismarck: 10.0%
Percentage of population below poverty level:
| Renaissance Zone: | 16.7% |
| Bismarck: | 13.1% |
Median year renter moved in (as recorded in 2022):
| Renaissance Zone: | 2014 |
| Bismarck: | 2020 |
Percentage of married-couple families with both working:
| Renaissance Zone: | 86.6% |
| Bismarck: | 87.0% |
- 49.1%Electricity
- 26.4%Utility gas
- 14.3%Bottled, tank, or LP gas
- 5.7%Other fuel
- 2.8%No fuel used
- 1.7%Coal or coke
Highways in this neighborhood:
I- 94 Bus (E Main Ave)
Length: 0.73 miles
Direction: E-W
Address range: 100 to 699
Direction: E-W
Address range: 100 to 699
Roads and streets:
E Front Ave
Length: 0.63 miles
Direction: E-W
Address range: 100 to 699
Direction: E-W
Address range: 100 to 699
E Broadway Ave
Length: 0.63 miles
Direction: E-W
Address range: 100 to 699
Direction: E-W
Address range: 100 to 699
E Sweet Ave
Length: 0.52 miles
Directions: E-W, SW-NE
Address range: 200 to 699
Directions: E-W, SW-NE
Address range: 200 to 699
E Thayer Ave
Length: 0.52 miles
Direction: E-W
Address range: 100 to 599
Direction: E-W
Address range: 100 to 599
N 6th St
Length: 0.16 miles
Direction: N-S
Address range: 100 to 299
Direction: N-S
Address range: 100 to 299
S 3rd St
Length: 0.16 miles
Direction: N-S
Address range: 100 to 299
Direction: N-S
Address range: 100 to 299
S 7th St
Length: 0.16 miles
Direction: N-S
Address range: 200 to 299
Direction: N-S
Address range: 200 to 299
S 5th St
Length: 0.16 miles
Direction: N-S
Address range: 100 to 299
Direction: N-S
Address range: 100 to 299
N 4th St
Length: 0.15 miles
Direction: N-S
Address range: 100 to 299
Direction: N-S
Address range: 100 to 299
N 5th St
Length: 0.15 miles
Direction: N-S
Address range: 100 to 299
Direction: N-S
Address range: 100 to 299
N 1st St
Length: 0.14 miles
Direction: N-S
Address range: 100 to 299
Direction: N-S
Address range: 100 to 299
N 2nd St
Length: 0.14 miles
Direction: N-S
Address range: 100 to 299
Direction: N-S
Address range: 100 to 299
N Mandan St
Length: 0.14 miles
Direction: N-S
Address range: 100 to 299
Direction: N-S
Address range: 100 to 299
N 7th St
Length: 0.14 miles
Direction: N-S
Address range: 100 to 299
Direction: N-S
Address range: 100 to 299
N 3rd St
Length: 0.14 miles
Direction: N-S
Address range: 100 to 299
Direction: N-S
Address range: 100 to 299
W Broadway Ave
Length: 0.10 miles
Direction: E-W
Address range: 100 to 199
Direction: E-W
Address range: 100 to 199
W Front Ave
Length: 0.10 miles
Direction: E-W
Address range: 1 to 199
Direction: E-W
Address range: 1 to 199
W Thayer Ave
Length: 0.10 miles
Direction: E-W
Address range: 100 to 199
Direction: E-W
Address range: 100 to 199
S 2nd St
Length: 0.07 miles
Direction: N-S
Address range: 200 to 337
Direction: N-S
Address range: 200 to 337
S 1st St
Length: 0.07 miles
Direction: N-S
Address range: 200 to 333
Direction: N-S
Address range: 200 to 333
Railroad features:
Burlington Northern Santa Fe Rlwy
Length: 0.42 miles
Direction: E-W
Direction: E-W