Riverbend neighborhood in Dearborn, Michigan (MI), 48124, 48128 detailed profile
Settings
X


Business Search - 14 Million verified businesses
Area: 0.511 square miles
Population: 2,122
Population density:
| Riverbend: | 4,152 people per square mile |
| Dearborn: | 4,421 people per square mile |

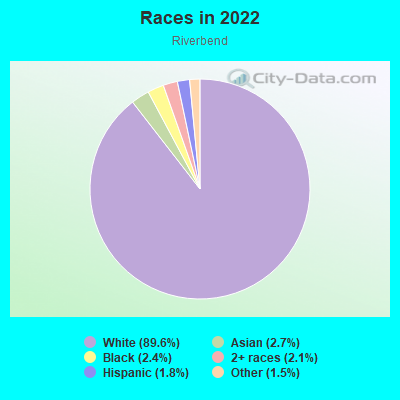
- 1,95689.6%White
- 582.7%Asian
- 522.4%Black
- 462.1%Two or more races
- 391.8%Hispanic or Latino
- 331.5%Some other race

Median household income in 2022:
| Riverbend: | $81,208 |
| Dearborn: | $58,467 |
Distribution of median household income
![Distribution of median household income]()
- 75Less than $10,000
- 51$10,000 to $19,999
- 89$20,000 to $29,999
- 65$30,000 to $39,999
- 117$40,000 to $49,999
- 42$50,000 to $59,999
- 150$60,000 to $74,999
- 76$75,000 to $99,999
- 61$100,000 to $124,999
- 74$125,000 to $149,999
- 106$150,000 to $199,999
- 112$200,000 or more

Distribution of owner-occupied house/condo value
![Distribution of owner-occupied house/condo value]()
- 376Less than $50,000
- 168$50,000 to $99,999
- 77$100,000 to $149,999
- 166$150,000 to $199,999
- 155$200,000 to $249,999
- 147$250,000 to $299,999
- 139$300,000 to $399,999
- 73$400,000 to $499,999
- 216$500,000 to $749,999
- 189$750,000 to $999,999
- 80$1,000,000 or more

Distribution of rent paid by renters
![Distribution of rent paid by renters]()
- 30$200 to $299
- 40$400 to $499
- 69$500 to $599
- 13$600 to $699
- 218$800 to $899
- 16$900 to $999
- 33$1,000 to $1,249
- 16$1,250 to $1,499
- 45$1,500 to $1,999

| Males: | 1,077 |
| Females: | 1,045 |
Males:
| This neighborhood: | 40.3 years |
| Whole city: | 30.8 years |
| This neighborhood: | 42.8 years |
| Whole city: | 31.0 years |
Average household size:
| Riverbend: | 7.2 people |
| Dearborn: | 2.9 people |
Percentage of family households:
| Riverbend: | 49.2% |
| Dearborn: | 49.7% |
| Here: | 51.9% |
| Dearborn: | 51.0% |
Percentage of married-couple families with children (among all households):
| Riverbend: | 38.6% |
| Dearborn: | 31.2% |
Percentage of single-mother households (among all households):
| Riverbend: | 3.7% |
| Dearborn: | 2.3% |
Percentage of never married males 15 years old and over:
Percentage of never married females 15 years old and over:
| Riverbend: | 17.0% |
| Dearborn: | 17.3% |
Percentage of never married females 15 years old and over:
| Riverbend: | 11.1% |
| city: | 15.8% |
Percentage of people that speak English not well or not at all:
| Riverbend: | 3.8% |
| Dearborn: | 10.0% |
Percentage of people born in this state:
Percentage of people born in another U.S. state:
Percentage of native residents but born outside the U.S.:
Percentage of foreign born residents:
| Here: | 71.4% |
| Dearborn: | 57.7% |
Percentage of people born in another U.S. state:
| Riverbend: | 10.8% |
| Dearborn: | 8.8% |
Percentage of native residents but born outside the U.S.:
| Here: | 1.5% |
| city: | 2.6% |
Percentage of foreign born residents:
| Here: | 16.2% |
| Dearborn: | 30.9% |
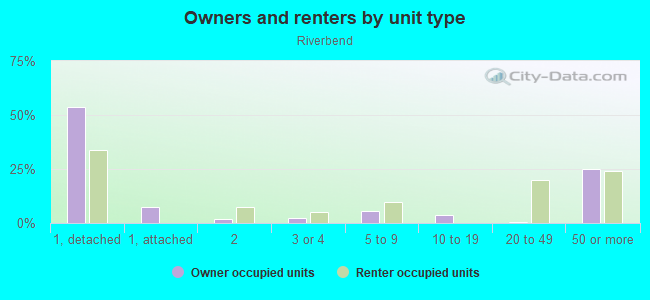
Owner-occupied
Renter-occupied

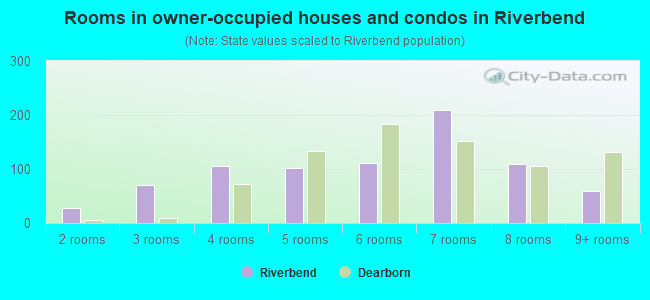
- Rooms in owner-occupied houses and condos in Riverbend
- 01 room
- 272 rooms
- 703 rooms
- 1054 rooms
- 1015 rooms
- 1126 rooms
- 2097 rooms
- 1098 rooms
- 599+ rooms
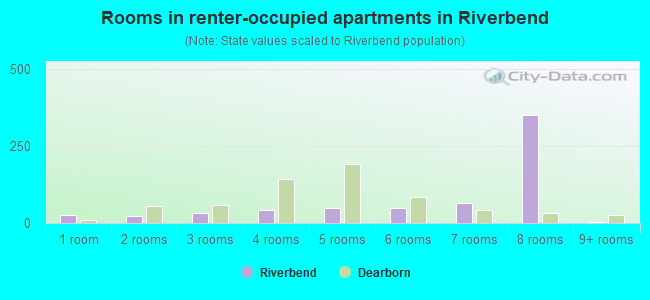
- Rooms in renter-occupied apartments in Riverbend
- 271 room
- 232 rooms
- 343 rooms
- 424 rooms
- 485 rooms
- 496 rooms
- 667 rooms
- 3508 rooms
- 49+ rooms
Owner-occupied
Renter-occupied
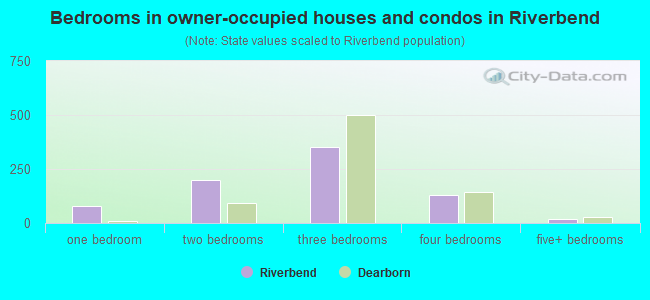
- Bedrooms in owner-occupied houses and condos in Riverbend
- 0no bedroom
- 781 bedroom
- 1972 bedrooms
- 3503 bedrooms
- 1294 bedrooms
- 205+ bedrooms
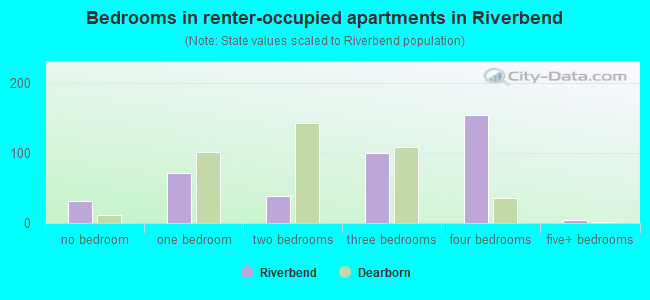
- Bedrooms in renter-occupied apartments in Riverbend
- 32no bedroom
- 711 bedroom
- 392 bedrooms
- 1003 bedrooms
- 1544 bedrooms
- 45+ bedrooms
Average number of cars or other vehicles available in houses/condos:
Average number of cars or other vehicles available in apartments:
| This neighborhood: | 1.9 |
| Dearborn: | 1.8 |
Average number of cars or other vehicles available in apartments:
| Here: | |
| city: |
Percentage of units with a mortgage:
| Riverbend: | 49.9% |
| Dearborn: | 53.2% |
Average estimated value of detached houses in 2022 (57.1% of all units):
| Riverbend: | $339,910 |
| Dearborn: | $222,556 |
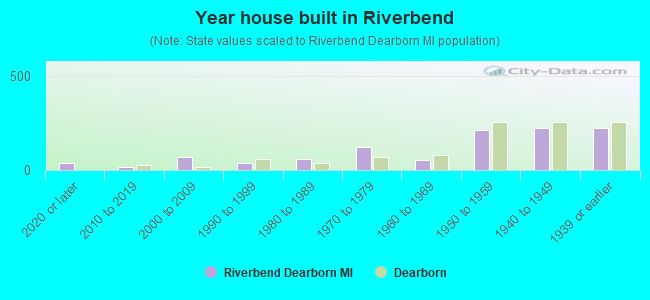
- Year house built in Riverbend
- 372020 or later
- 172010 to 2019
- 672000 to 2009
- 381990 to 1999
- 611980 to 1989
- 1251970 to 1979
- 561960 to 1969
- 2121950 to 1959
- 2261940 to 1949
- 2221939 or earlier
City-data.com crime index for city in 2020 (higher means more crime):
| City: | 176.4 |
| U.S. average: | 219.5 |
Travel time to work (commute)
![Travel time to work (commute)]()
- 20Less than 5 minutes
- 805 to 9 minutes
- 14210 to 14 minutes
- 11415 to 19 minutes
- 8120 to 24 minutes
- 3725 to 29 minutes
- 7930 to 34 minutes
- 3435 to 39 minutes
- 1840 to 44 minutes
- 7245 to 59 minutes
- 1260 to 89 minutes
- 1690 or more minutes

Means of transportation to work
![Means of transportation to work]()
- 80.9%714Drove a car alone
- 25.6%226Carpooled
- 1.7%15Bus
- 1.7%15Bicycle
- 2.4%21Walked
- 15.0%132Worked at home

Time leaving home to go to work
![Time leaving home to go to work]()
- 4112:00 a.m. to 4:59 a.m.
- 365:00 a.m. to 5:29 a.m.
- 355:30 a.m. to 5:59 a.m.
- 1206:00 a.m. to 6:29 a.m.
- 616:30 a.m. to 6:59 a.m.
- 977:00 a.m. to 7:29 a.m.
- 607:30 a.m. to 7:59 a.m.
- 1278:00 a.m. to 8:29 a.m.
- 788:30 a.m. to 8:59 a.m.
- 229:00 a.m. to 9:59 a.m.
- 7710:00 a.m. to 10:59 a.m.
- 7111:00 a.m. to 11:59 a.m.
- 2312:00 p.m. to 3:59 p.m.
- 834:00 p.m. to 11:59 p.m.

Occupations of males:
- Percentage of males in management occupations (except farmers):
Here: 12.6% city: 7.5%
- Percentage of males in business and financial operations occupations:
Here: 17.8% city: 4.8%
- Percentage of males in computer and mathematical occupations:
Here: 1.4% city: 5.7%
- Percentage of males in architecture and engineering occupations:
Here: 9.3% city: 7.5%
- Percentage of males in life, physical, and social science occupations:
Here: 3.3% city: 1.0%
- Percentage of males in education, training, and library occupations:
Here: 3.2% city: 3.8%
- Percentage of males in arts, design, entertainment, sports, and media occupations:
Here: 2.4% city: 1.9%
- Percentage of males in healthcare practitioners and technical occupations:
Here: 4.5% city: 4.4%
- Percentage of males in service occupations:
Here: 8.9% city: 13.8%
- Percentage of males in sales and office occupations:
Here: 15.5% city: 15.1%
- Percentage of males in construction, extraction, and maintenance occupations:
Here: 6.2% city: 5.1%
- Percentage of males in production occupations:
Here: 11.4% city: 8.5%
- Percentage of males in material moving occupations:
Here: 1.1% city: 5.8%
Occupations of females:
- Percentage of females in management occupations (except farmers):
Here: 10.4% city: 7.3%
- Percentage of females in business and financial operations occupations:
Here: 9.7% city: 6.9%
- Percentage of females in architecture and engineering occupations:
Here: 1.7% city: 1.4%
- Percentage of females in life, physical, and social science occupations:
Here: 4.6% city: 0.8%
- Percentage of females in community and social services occupations:
Here: 1.4% city: 2.6%
- Percentage of females in legal occupations:
Here: 1.6% city: 0.8%
- Percentage of females in education, training, and library occupations:
Here: 14.3% city: 11.1%
- Percentage of females in healthcare practitioners and technical occupations:
Here: 20.7% city: 15.7%
- Percentage of females in service occupations:
Here: 11.6% city: 19.0%
- Percentage of females in sales and office occupations:
Here: 21.9% city: 23.6%
- Percentage of females in production occupations:
Here: 1.6% city: 2.8%
- Percentage of females in transportation occupations:
Here: 1.8% city: 1.1%
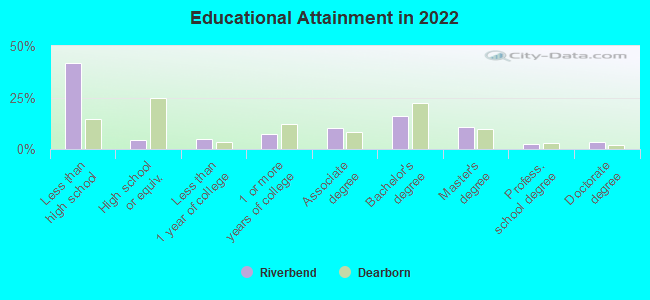
Education in this neighborhood (subdivision or community):
- Percentage of people 3 years and older in K-12 schools:
Riverbend: 24.7% Dearborn: 26.0%
- Percentage of people 3 years and older in undergraduate colleges:
Riverbend: 11.7% Dearborn: 5.6%
- Percentage of people 3 years and older in grad. or professional schools:
Riverbend: 2.6% Dearborn: 2.2%
- Percentage of students K-12 enrolled in private schools:
Riverbend: 105.4% Dearborn: 6.8%
Percentage of population below poverty level:
| Riverbend: | 12.0% |
| Dearborn: | 25.4% |
Median year owner moved in (as recorded in 2022):
| Riverbend: | 2005 |
| Dearborn: | 2013 |
Percentage of married-couple families with both working:
| Riverbend: | 98.8% |
| Dearborn: | 37.3% |
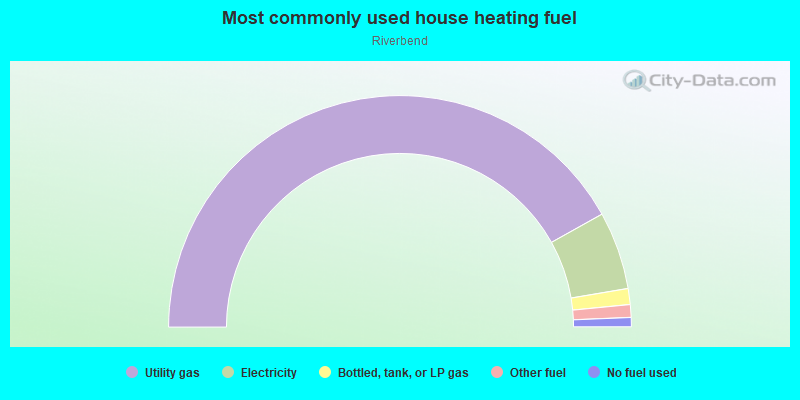
- 83.8%Utility gas
- 10.9%Electricity
- 2.2%Bottled, tank, or LP gas
- 1.8%Other fuel
- 1.3%No fuel used
Roads and streets:
W Outer Dr
Length: 1.51 miles
Directions: N-S, SW-NE
Address range: 18601 to 19498
Directions: N-S, SW-NE
Address range: 18601 to 19498
Cherry Hill St
Length: 1.20 miles
Directions: E-W, SE-NW, SW-NE
Address range: 21977 to 23099
Directions: E-W, SE-NW, SW-NE
Address range: 21977 to 23099
N Military St
Length: 0.99 miles
Directions: N-S, SE-NW
Address range: 101 to 899
Directions: N-S, SE-NW
Address range: 101 to 899
Morley Ave
Length: 0.56 miles
Direction: E-W
Address range: 22001 to 22698
Direction: E-W
Address range: 22001 to 22698
Long Blvd
Length: 0.54 miles
Directions: E-W, N-S, SE-NW, SW-NE
Address range: 22148 to 23198
Directions: E-W, N-S, SE-NW, SW-NE
Address range: 22148 to 23198
Law St
Length: 0.49 miles
Direction: E-W
Address range: 22400 to 22999
Direction: E-W
Address range: 22400 to 22999
Alexandrine St
Length: 0.47 miles
Direction: E-W
Address range: 22400 to 22999
Direction: E-W
Address range: 22400 to 22999
S Military St
Length: 0.41 miles
Directions: N-S, SE-NW
Address range: 100 to 799
Directions: N-S, SE-NW
Address range: 100 to 799
Nash St
Length: 0.30 miles
Directions: E-W, SW-NE
Address range: 22500 to 22799
Directions: E-W, SW-NE
Address range: 22500 to 22799
Fort Dearborn St
Length: 0.30 miles
Directions: N-S, SE-NW
Address range: 100 to 599
Directions: N-S, SE-NW
Address range: 100 to 599
Tannahill St
Length: 0.26 miles
Directions: N-S, SE-NW
Address range: 100 to 499
Directions: N-S, SE-NW
Address range: 100 to 499
River Ln
Length: 0.25 miles
Directions: SE-NW, SW-NE
Address range: 100 to 499
Directions: SE-NW, SW-NE
Address range: 100 to 499
Wellington St
Length: 0.24 miles
Directions: E-W, SE-NW
Address range: 22700 to 22999
Directions: E-W, SE-NW
Address range: 22700 to 22999
N Nash St
Length: 0.23 miles
Direction: SW-NE
Address range: 100 to 399
Direction: SW-NE
Address range: 100 to 399
Sylvan St
Length: 0.22 miles
Directions: E-W, N-S, SE-NW, SW-NE
Address range: 100 to 499
Directions: E-W, N-S, SE-NW, SW-NE
Address range: 100 to 499
N Reginald St
Length: 0.20 miles
Directions: N-S, SE-NW
Address range: 100 to 399
Directions: N-S, SE-NW
Address range: 100 to 399
Devonshire St
Length: 0.19 miles
Directions: N-S, SE-NW
Address range: 100 to 399
Directions: N-S, SE-NW
Address range: 100 to 399
Cromwell St
Length: 0.18 miles
Direction: SE-NW
Address range: 22800 to 23045
Direction: SE-NW
Address range: 22800 to 23045
S Reginald St
Length: 0.14 miles
Direction: N-S
Address range: 100 to 299
Direction: N-S
Address range: 100 to 299
Marlboro St
Length: 0.11 miles
Direction: E-W
Address range: 22500 to 22659
Direction: E-W
Address range: 22500 to 22659
Morley Ct
Length: 0.10 miles
Direction: SE-NW
Address range: 500 to 799
Direction: SE-NW
Address range: 500 to 799
Woodbridge Ct
Length: 0.10 miles
Directions: E-W, SW-NE
Address range: 1 to 22630
Directions: E-W, SW-NE
Address range: 1 to 22630
Kensington St
Length: 0.10 miles
Direction: SW-NE
Address range: 600 to 799
Direction: SW-NE
Address range: 600 to 799
Sheridan St
Length: 0.08 miles
Direction: E-W
Address range: 22500 to 22643
Direction: E-W
Address range: 22500 to 22643
Morley North Pl
Length: 0.08 miles
Direction: SE-NW
Address range: 1 to 99
Direction: SE-NW
Address range: 1 to 99
Wagner Ct
Length: 0.07 miles
Directions: N-S, SE-NW
Address range: 500 to 799
Directions: N-S, SE-NW
Address range: 500 to 799
Brainard St
Length: 0.06 miles
Direction: N-S
Address range: 100 to 199
Direction: N-S
Address range: 100 to 199
Other features:
Lower Rouge Riv
Length: 0.51 miles
Directions: E-W, N-S, SE-NW, SW-NE
Directions: E-W, N-S, SE-NW, SW-NE