Riverforest neighborhood in Lansing, Michigan (MI), 48906 detailed profile
Settings
X


Business Search - 14 Million verified businesses
Area: 0.274 square miles
Population: 1,024
Population density:
| Riverforest: | 3,741 people per square mile |
| Lansing: | 3,223 people per square mile |

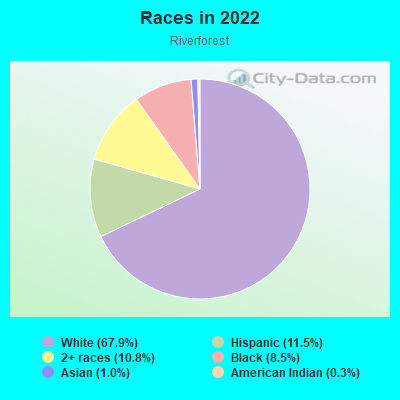
- 70167.9%White
- 11911.5%Hispanic or Latino
- 11110.8%Two or more races
- 888.5%Black
- 101.0%Asian
- 30.3%American Indian

Median household income in 2022:
| Riverforest: | $55,506 |
| Lansing: | $48,962 |
Distribution of median household income
![Distribution of median household income]()
- 7Less than $10,000
- 30$10,000 to $19,999
- 31$20,000 to $29,999
- 16$30,000 to $39,999
- 46$40,000 to $49,999
- 61$50,000 to $59,999
- 41$60,000 to $74,999
- 112$75,000 to $99,999
- 27$100,000 to $124,999
- 97$125,000 to $149,999
- 19$150,000 to $199,999
- 27$200,000 or more

Distribution of owner-occupied house/condo value
![Distribution of owner-occupied house/condo value]()
- 18Less than $50,000
- 81$50,000 to $99,999
- 216$100,000 to $149,999
- 102$150,000 to $199,999
- 86$200,000 to $249,999
- 12$250,000 to $299,999
- 10$300,000 to $399,999
- 3$400,000 to $499,999
- 8$750,000 to $999,999

Distribution of rent paid by renters
![Distribution of rent paid by renters]()
- 17Less than $100
- 6$200 to $299
- 1$300 to $399
- 24$400 to $499
- 70$500 to $599
- 44$600 to $699
- 42$700 to $799
- 9$800 to $899
- 9$1,000 to $1,249
- 5$1,250 to $1,499

| Males: | 509 |
| Females: | 514 |
Males:
| This neighborhood: | 35.9 years |
| Whole city: | 33.0 years |
| This neighborhood: | 32.1 years |
| Whole city: | 34.5 years |
Average household size:
| Riverforest: | 2.5 people |
| Lansing: | 2.1 people |
Percentage of family households:
| Riverforest: | 35.7% |
| Lansing: | 33.9% |
| Here: | 38.1% |
| Lansing: | 27.4% |
Percentage of married-couple families with children (among all households):
| Riverforest: | 38.4% |
| Lansing: | 23.0% |
Percentage of single-mother households (among all households):
| Riverforest: | 12.0% |
| Lansing: | 14.1% |
Percentage of never married males 15 years old and over:
Percentage of never married females 15 years old and over:
| Riverforest: | 17.2% |
| Lansing: | 24.9% |
Percentage of never married females 15 years old and over:
| Riverforest: | 15.1% |
| city: | 21.6% |
Percentage of people that speak English not well or not at all:
| Riverforest: | 2.5% |
| Lansing: | 2.3% |
Percentage of people born in this state:
Percentage of people born in another U.S. state:
Percentage of native residents but born outside the U.S.:
Percentage of foreign born residents:
| Here: | 78.7% |
| Lansing: | 72.5% |
Percentage of people born in another U.S. state:
| Riverforest: | 16.1% |
| Lansing: | 19.1% |
Percentage of native residents but born outside the U.S.:
| Here: | 1.2% |
| city: | 0.8% |
Percentage of foreign born residents:
| Here: | 5.2% |
| Lansing: | 7.6% |
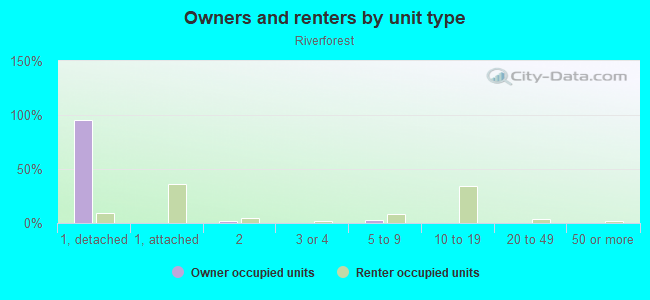
Owner-occupied
Renter-occupied

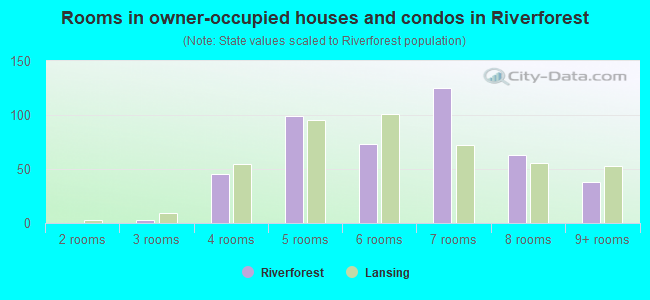
- Rooms in owner-occupied houses and condos in Riverforest
- 01 room
- 02 rooms
- 33 rooms
- 454 rooms
- 995 rooms
- 736 rooms
- 1257 rooms
- 638 rooms
- 389+ rooms
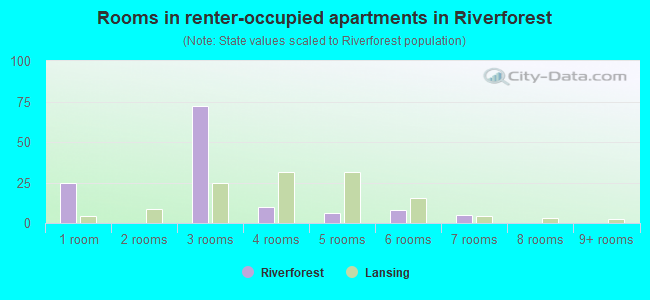
- Rooms in renter-occupied apartments in Riverforest
- 251 room
- 02 rooms
- 723 rooms
- 104 rooms
- 65 rooms
- 86 rooms
- 57 rooms
- 08 rooms
- 09+ rooms
Owner-occupied
Renter-occupied
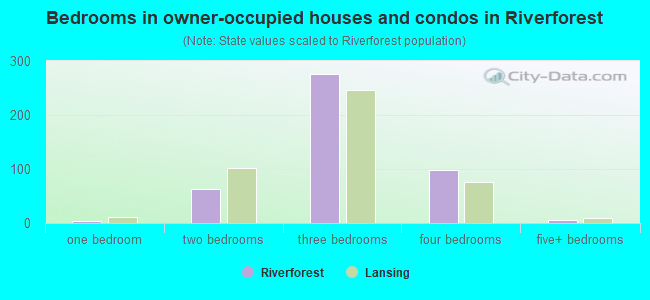
- Bedrooms in owner-occupied houses and condos in Riverforest
- 0no bedroom
- 41 bedroom
- 632 bedrooms
- 2763 bedrooms
- 984 bedrooms
- 65+ bedrooms
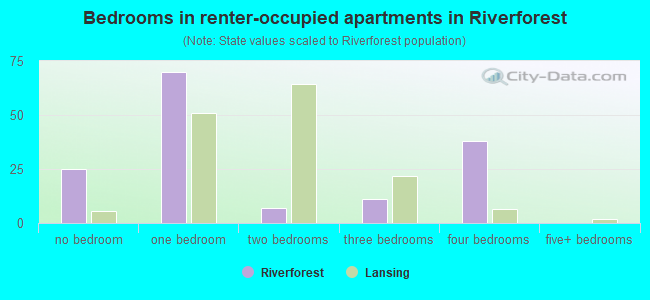
- Bedrooms in renter-occupied apartments in Riverforest
- 25no bedroom
- 701 bedroom
- 72 bedrooms
- 113 bedrooms
- 384 bedrooms
- 05+ bedrooms
Average number of cars or other vehicles available in houses/condos:
Average number of cars or other vehicles available in apartments:
| This neighborhood: | 1.8 |
| Lansing: | 1.7 |
Average number of cars or other vehicles available in apartments:
| Here: | 1.6 |
| city: | 1.1 |
Percentage of units with a mortgage:
| Riverforest: | 72.8% |
| Lansing: | 65.6% |
Average estimated value of detached houses in 2022 (99.6% of all units):
| Riverforest: | $164,381 |
| Lansing: | $121,378 |
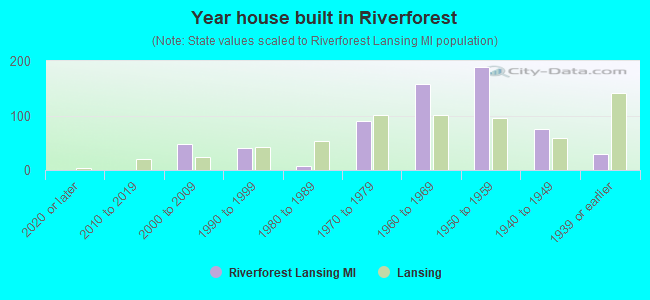
- Year house built in Riverforest
- 02020 or later
- 02010 to 2019
- 482000 to 2009
- 411990 to 1999
- 71980 to 1989
- 901970 to 1979
- 1571960 to 1969
- 1891950 to 1959
- 751940 to 1949
- 301939 or earlier
City-data.com crime index for city in 2020 (higher means more crime):
| City: | 553.0 |
| U.S. average: | 219.5 |
Travel time to work (commute)
![Travel time to work (commute)]()
- 3Less than 5 minutes
- 255 to 9 minutes
- 7110 to 14 minutes
- 14015 to 19 minutes
- 7120 to 24 minutes
- 3325 to 29 minutes
- 2130 to 34 minutes
- 140 to 44 minutes
- 945 to 59 minutes
- 1060 to 89 minutes
- 590 or more minutes

Means of transportation to work
![Means of transportation to work]()
- 62.2%335Drove a car alone
- 13.2%71Carpooled
- 2.0%11Bus
- 3.3%18Motorcycle
- 0.4%2Walked
- 24.3%131Worked at home

Time leaving home to go to work
![Time leaving home to go to work]()
- 212:00 a.m. to 4:59 a.m.
- 345:00 a.m. to 5:29 a.m.
- 105:30 a.m. to 5:59 a.m.
- 306:00 a.m. to 6:29 a.m.
- 686:30 a.m. to 6:59 a.m.
- 697:00 a.m. to 7:29 a.m.
- 907:30 a.m. to 7:59 a.m.
- 248:00 a.m. to 8:29 a.m.
- 178:30 a.m. to 8:59 a.m.
- 169:00 a.m. to 9:59 a.m.
- 510:00 a.m. to 10:59 a.m.
- 111:00 a.m. to 11:59 a.m.
- 112:00 p.m. to 3:59 p.m.
- 304:00 p.m. to 11:59 p.m.

Occupations of males:
- Percentage of males in management occupations (except farmers):
Here: 7.6% city: 6.2%
- Percentage of males in business and financial operations occupations:
Here: 7.2% city: 4.1%
- Percentage of males in computer and mathematical occupations:
Here: 10.1% city: 6.1%
- Percentage of males in architecture and engineering occupations:
Here: 7.9% city: 2.5%
- Percentage of males in life, physical, and social science occupations:
Here: 2.2% city: 1.9%
- Percentage of males in legal occupations:
Here: 4.0% city: 0.7%
- Percentage of males in education, training, and library occupations:
Here: 1.7% city: 4.9%
- Percentage of males in arts, design, entertainment, sports, and media occupations:
Here: 2.2% city: 1.9%
- Percentage of males in sales and office occupations:
Here: 24.2% city: 13.3%
- Percentage of males in construction, extraction, and maintenance occupations:
Here: 9.4% city: 6.5%
- Percentage of males in transportation occupations:
Here: 5.8% city: 6.7%
- Percentage of males in material moving occupations:
Here: 4.4% city: 8.5%
Occupations of females:
- Percentage of females in management occupations (except farmers):
Here: 7.0% city: 6.9%
- Percentage of females in business and financial operations occupations:
Here: 22.7% city: 6.7%
- Percentage of females in computer and mathematical occupations:
Here: 7.2% city: 2.4%
- Percentage of females in life, physical, and social science occupations:
Here: 1.1% city: 1.6%
- Percentage of females in legal occupations:
Here: 2.1% city: 1.1%
- Percentage of females in education, training, and library occupations:
Here: 12.1% city: 8.7%
- Percentage of females in healthcare practitioners and technical occupations:
Here: 8.3% city: 6.7%
- Percentage of females in service occupations:
Here: 11.1% city: 25.0%
- Percentage of females in sales and office occupations:
Here: 20.1% city: 25.9%
- Percentage of females in production occupations:
Here: 8.3% city: 5.6%
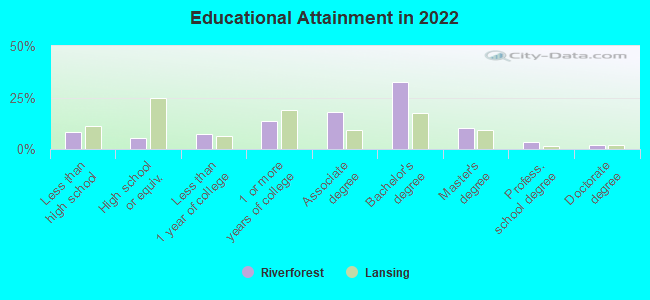
Education in this neighborhood (subdivision or community):
- Percentage of people 3 years and older in K-12 schools:
Riverforest: 12.1% Lansing: 14.3%
- Percentage of people 3 years and older in undergraduate colleges:
Riverforest: 7.3% Lansing: 4.6%
- Percentage of people 3 years and older in grad. or professional schools:
Riverforest: 2.0% Lansing: 2.6%
- Percentage of students K-12 enrolled in private schools:
Riverforest: 26.3% Lansing: 7.9%
Percentage of population below poverty level:
| Riverforest: | 5.8% |
| Lansing: | 22.2% |
Median year owner moved in (as recorded in 2022):
Median year renter moved in (as recorded in 2022):
| Riverforest: | 2004 |
| Lansing: | 2012 |
Median year renter moved in (as recorded in 2022):
| Riverforest: | 2015 |
| Lansing: | 2020 |
Percentage of married-couple families with both working:
| Riverforest: | 74.0% |
| Lansing: | 59.6% |
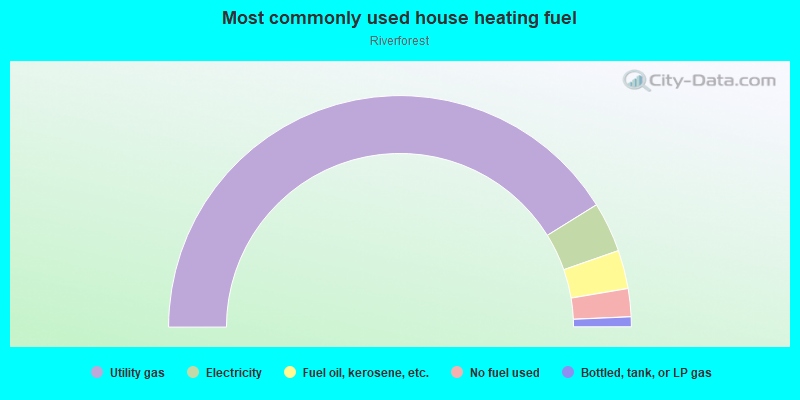
- 82.3%Utility gas
- 7.0%Electricity
- 5.4%Fuel oil, kerosene, etc.
- 3.9%No fuel used
- 1.4%Bottled, tank, or LP gas
Roads and streets:
Cumberland Rd
Length: 1.04 miles
Directions: E-W, N-S, SE-NW, SW-NE
Address range: 1900 to 2999
Directions: E-W, N-S, SE-NW, SW-NE
Address range: 1900 to 2999
Arlington Rd
Length: 0.38 miles
Directions: E-W, N-S, SW-NE
Address range: 2300 to 2799
Directions: E-W, N-S, SW-NE
Address range: 2300 to 2799
Dillingham Ave
Length: 0.38 miles
Directions: N-S, SE-NW
Address range: 2100 to 2699
Directions: N-S, SE-NW
Address range: 2100 to 2699
Cogswell Dr
Length: 0.35 miles
Directions: N-S, SE-NW
Address range: 2000 to 2499
Directions: N-S, SE-NW
Address range: 2000 to 2499
Delta River Dr
Length: 0.32 miles
Direction: E-W
Address range: 2700 to 3099
Direction: E-W
Address range: 2700 to 3099
Barstow Rd
Length: 0.30 miles
Direction: N-S
Address range: 2100 to 2599
Direction: N-S
Address range: 2100 to 2599
Westbury Rd
Length: 0.29 miles
Direction: N-S
Address range: 2100 to 2599
Direction: N-S
Address range: 2100 to 2599
Colchester Rd
Length: 0.24 miles
Direction: E-W
Address range: 2800 to 3099
Direction: E-W
Address range: 2800 to 3099
Leon Ave
Length: 0.22 miles
Direction: N-S
Address range: 2300 to 2699
Direction: N-S
Address range: 2300 to 2699
Pembroke Rd
Length: 0.18 miles
Directions: E-W, SE-NW
Address range: 2200 to 2299
Directions: E-W, SE-NW
Address range: 2200 to 2299
Darby Dr
Length: 0.15 miles
Directions: N-S, SE-NW
Address range: 2300 to 2499
Directions: N-S, SE-NW
Address range: 2300 to 2499
Tecumseh River Rd
Length: 0.14 miles
Directions: E-W, N-S, SW-NE
Address range: 2000 to 2599
Directions: E-W, N-S, SW-NE
Address range: 2000 to 2599
Trent St
Length: 0.13 miles
Direction: E-W
Address range: 2500 to 2699
Direction: E-W
Address range: 2500 to 2699
Forest Glen Ave
Length: 0.11 miles
Direction: E-W
Address range: 2100 to 2199
Direction: E-W
Address range: 2100 to 2199
Afton Pl
Length: 0.08 miles
Direction: N-S
Address range: 2400 to 2599
Direction: N-S
Address range: 2400 to 2599
Northwest Ave
Length: 0.07 miles
Direction: N-S
Address range: 2451 to 2599
Direction: N-S
Address range: 2451 to 2599
Edgebrook Dr
Length: 0.05 miles
Directions: N-S, SW-NE
Address range: 2700 to 2799
Directions: N-S, SW-NE
Address range: 2700 to 2799