Riverpoint (River Point) neighborhood in Lansing, Michigan (MI), 48910, 48912 detailed profile
Settings
X


Business Search - 14 Million verified businesses
Area: 0.101 square miles
Population: 186
Population density:
| Riverpoint (River Point): | 1,838 people per square mile |
| Lansing: | 3,223 people per square mile |

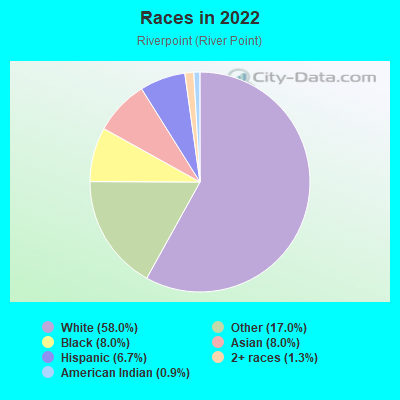
- 13058.0%White
- 3817.0%Some other race
- 188.0%Black
- 188.0%Asian
- 156.7%Hispanic or Latino
- 31.3%Two or more races
- 20.9%American Indian
Median household income in 2022:
| Riverpoint (River Point): | $53,920 |
| Lansing: | $48,962 |
Distribution of median household income
![Distribution of median household income]()
- 5Less than $10,000
- 27$10,000 to $19,999
- 14$20,000 to $29,999
- 15$30,000 to $39,999
- 13$40,000 to $49,999
- 6$50,000 to $59,999
- 21$60,000 to $74,999
- 27$75,000 to $99,999
- 10$100,000 to $124,999
- 9$125,000 to $149,999
- 6$150,000 to $199,999

Distribution of owner-occupied house/condo value
![Distribution of owner-occupied house/condo value]()
- 22Less than $50,000
- 23$50,000 to $99,999
- 14$100,000 to $149,999
- 14$150,000 to $199,999
- 7$250,000 to $299,999

Distribution of rent paid by renters
![Distribution of rent paid by renters]()
- 1$200 to $299
- 6$400 to $499
- 7$500 to $599
- 37$600 to $699
- 21$700 to $799
- 28$800 to $899
- 18$900 to $999
- 5$1,000 to $1,249
- 3$1,250 to $1,499

Median rent in 2022:
| Riverpoint (River Point): | $849 |
| Lansing: | $773 |
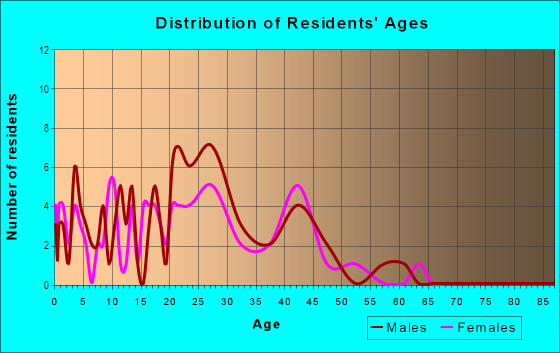
| Males: | 92 |
| Females: | 94 |
Males:
| This neighborhood: | 19.1 years |
| Whole city: | 33.0 years |
| This neighborhood: | 31.6 years |
| Whole city: | 34.5 years |
Average household size:
| Riverpoint (River Point): | 2.2 people |
| Lansing: | 2.1 people |
Percentage of family households:
| Riverpoint (River Point): | 14.7% |
| Lansing: | 33.9% |
| Here: | 9.2% |
| Lansing: | 27.4% |
Percentage of married-couple families with children (among all households):
| Riverpoint (River Point): | 57.5% |
| Lansing: | 23.0% |
Percentage of single-mother households (among all households):
| Riverpoint (River Point): | 1233.5% |
| Lansing: | 14.1% |
Percentage of never married males 15 years old and over:
Percentage of never married females 15 years old and over:
| Riverpoint (River Point): | 40.5% |
| Lansing: | 24.9% |
Percentage of never married females 15 years old and over:
| Riverpoint (River Point): | 33.4% |
| city: | 21.6% |
Percentage of people that speak English not well or not at all:
| Riverpoint (River Point): | 0.0% |
| Lansing: | 2.3% |
Percentage of people born in this state:
Percentage of people born in another U.S. state:
Percentage of native residents but born outside the U.S.:
Percentage of foreign born residents:
| Here: | 82.5% |
| Lansing: | 72.5% |
Percentage of people born in another U.S. state:
| Riverpoint (River Point): | 13.1% |
| Lansing: | 19.1% |
Percentage of native residents but born outside the U.S.:
| Here: | 0.2% |
| city: | 0.8% |
Percentage of foreign born residents:
| Here: | 4.2% |
| Lansing: | 7.6% |
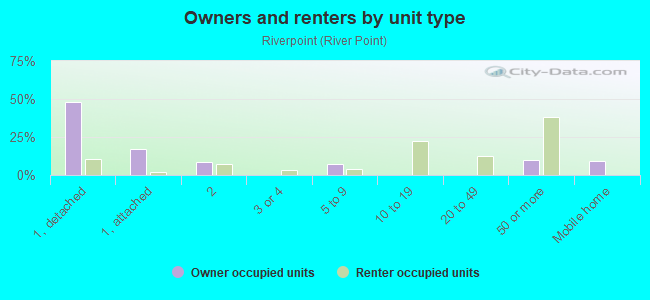
Owner-occupied
Renter-occupied

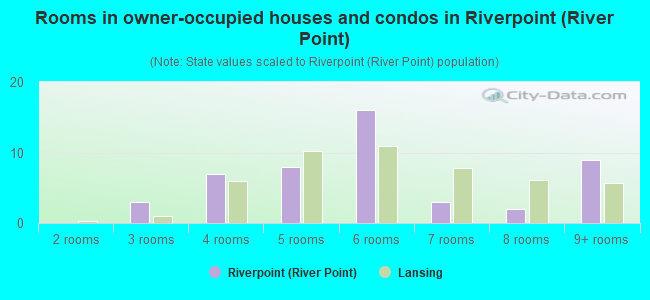
- Rooms in owner-occupied houses and condos in Riverpoint <
> - 01 room
- 02 rooms
- 33 rooms
- 74 rooms
- 85 rooms
- 166 rooms
- 37 rooms
- 28 rooms
- 99+ rooms
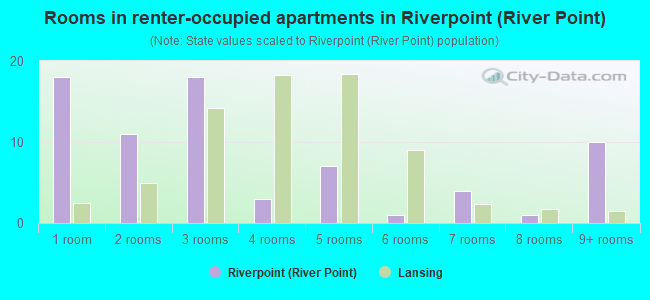
- Rooms in renter-occupied apartments in Riverpoint <
> - 181 room
- 112 rooms
- 183 rooms
- 34 rooms
- 75 rooms
- 16 rooms
- 47 rooms
- 18 rooms
- 109+ rooms
Owner-occupied
Renter-occupied

- Bedrooms in owner-occupied houses and condos in Riverpoint <
> - 0no bedroom
- 71 bedroom
- 72 bedrooms
- 163 bedrooms
- 24 bedrooms
- 95+ bedrooms
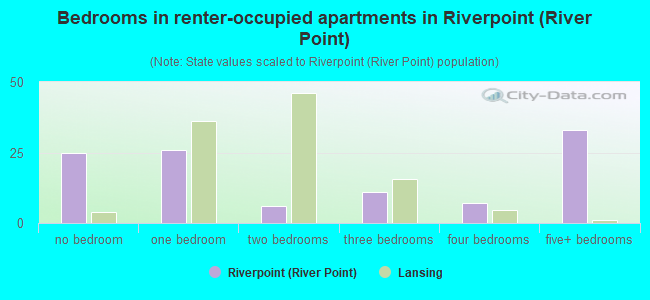
- Bedrooms in renter-occupied apartments in Riverpoint <
> - 25no bedroom
- 261 bedroom
- 62 bedrooms
- 113 bedrooms
- 74 bedrooms
- 335+ bedrooms
Average number of cars or other vehicles available in houses/condos:
Average number of cars or other vehicles available in apartments:
| This neighborhood: | 1.0 |
| Lansing: | 1.7 |
Average number of cars or other vehicles available in apartments:
| Here: | 1.3 |
| city: | 1.1 |
Percentage of units with a mortgage:
| Riverpoint (River Point): | 76.6% |
| Lansing: | 65.6% |
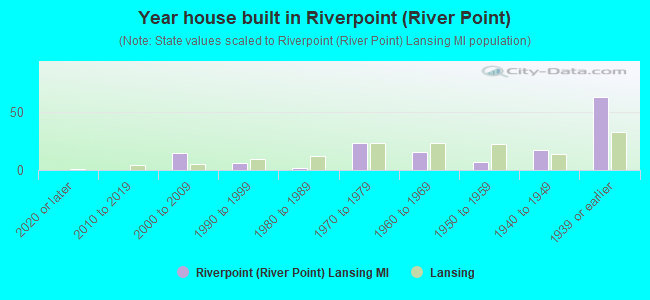
- Year house built in Riverpoint <
> - 02020 or later
- 02010 to 2019
- 152000 to 2009
- 61990 to 1999
- 21980 to 1989
- 231970 to 1979
- 161960 to 1969
- 71950 to 1959
- 171940 to 1949
- 631939 or earlier
City-data.com crime index for city in 2020 (higher means more crime):
| City: | 553.0 |
| U.S. average: | 219.5 |
Travel time to work (commute)
![Travel time to work (commute)]()
- 4Less than 5 minutes
- 235 to 9 minutes
- 5110 to 14 minutes
- 3915 to 19 minutes
- 2120 to 24 minutes
- 330 to 34 minutes
- 840 to 44 minutes
- 745 to 59 minutes
- 260 to 89 minutes

Means of transportation to work
![Means of transportation to work]()
- 59.8%92Drove a car alone
- 9.1%14Carpooled
- 2.0%3Bus
- 2.6%4Motorcycle
- 5.2%8Walked
- 0.7%1Other means
- 20.2%31Worked at home

Time leaving home to go to work
![Time leaving home to go to work]()
- 1312:00 a.m. to 4:59 a.m.
- 75:30 a.m. to 5:59 a.m.
- 126:00 a.m. to 6:29 a.m.
- 116:30 a.m. to 6:59 a.m.
- 37:00 a.m. to 7:29 a.m.
- 267:30 a.m. to 7:59 a.m.
- 108:00 a.m. to 8:29 a.m.
- 158:30 a.m. to 8:59 a.m.
- 59:00 a.m. to 9:59 a.m.
- 610:00 a.m. to 10:59 a.m.
- 1812:00 p.m. to 3:59 p.m.
- 244:00 p.m. to 11:59 p.m.

Occupations of males:
- Percentage of males in management occupations (except farmers):
Here: 7.5% city: 6.2%
- Percentage of males in computer and mathematical occupations:
Here: 17.8% city: 6.1%
- Percentage of males in architecture and engineering occupations:
Here: 1.3% city: 2.5%
- Percentage of males in legal occupations:
Here: 9.9% city: 0.7%
- Percentage of males in education, training, and library occupations:
Here: 3.5% city: 4.9%
- Percentage of males in arts, design, entertainment, sports, and media occupations:
Here: 3.0% city: 1.9%
- Percentage of males in service occupations:
Here: 23.4% city: 17.2%
- Percentage of males in sales and office occupations:
Here: 11.9% city: 13.3%
- Percentage of males in construction, extraction, and maintenance occupations:
Here: 7.0% city: 6.5%
- Percentage of males in production occupations:
Here: 1.6% city: 9.4%
- Percentage of males in material moving occupations:
Here: 10.5% city: 8.5%
Occupations of females:
- Percentage of females in management occupations (except farmers):
Here: 8.2% city: 6.9%
- Percentage of females in computer and mathematical occupations:
Here: 6.2% city: 2.4%
- Percentage of females in education, training, and library occupations:
Here: 17.7% city: 8.7%
- Percentage of females in arts, design, entertainment, sports, and media occupations:
Here: 21.6% city: 1.7%
- Percentage of females in healthcare practitioners and technical occupations:
Here: 4.9% city: 6.7%
- Percentage of females in service occupations:
Here: 5.4% city: 25.0%
- Percentage of females in sales and office occupations:
Here: 30.8% city: 25.9%
- Percentage of females in construction, extraction, and maintenance occupations:
Here: 7.6% city: 0.2%
- Percentage of females in production occupations:
Here: 5.2% city: 5.6%
- Percentage of females in transportation occupations:
Here: 1.4% city: 1.5%
- Percentage of females in material moving occupations:
Here: 5.3% city: 2.3%
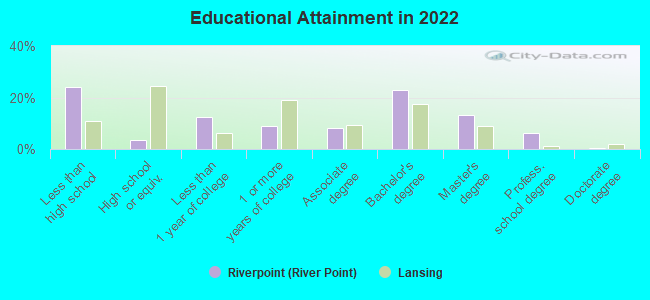
Education in this neighborhood (subdivision or community):
- Percentage of people 3 years and older in K-12 schools:
Riverpoint (River Point): 73.1% Lansing: 14.3%
- Percentage of people 3 years and older in undergraduate colleges:
Riverpoint (River Point): 6.5% Lansing: 4.6%
- Percentage of people 3 years and older in grad. or professional schools:
Riverpoint (River Point): 5.9% Lansing: 2.6%
- Percentage of students K-12 enrolled in private schools:
Riverpoint (River Point): 0.7% Lansing: 7.9%
Percentage of population below poverty level:
| Riverpoint (River Point): | 25.9% |
| Lansing: | 22.2% |
Median year owner moved in (as recorded in 2022):
Median year renter moved in (as recorded in 2022):
| Riverpoint (River Point): | 2015 |
| Lansing: | 2012 |
Median year renter moved in (as recorded in 2022):
| Riverpoint (River Point): | 2019 |
| Lansing: | 2020 |
Percentage of married-couple families with both working:
| Riverpoint (River Point): | 23.0% |
| Lansing: | 59.6% |
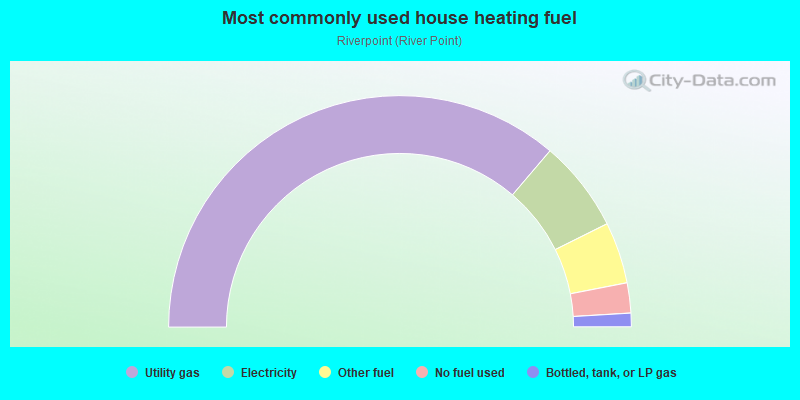
- 72.4%Utility gas
- 12.8%Electricity
- 8.6%Other fuel
- 4.2%No fuel used
- 1.9%Bottled, tank, or LP gas
Highways in this neighborhood:
Martin Luther King Jr Blvd (Cedar St, I- 96 Bus, S Cedar St)
Length: 0.06 miles
Direction: N-S
Address range: 1201 to 1398
Direction: N-S
Address range: 1201 to 1398
Roads and streets:
E South St
Length: 0.47 miles
Direction: E-W
Address range: 100 to 499
Direction: E-W
Address range: 100 to 499
S Washington Ave
Length: 0.27 miles
Direction: N-S
Address range: 1000 to 1299
Direction: N-S
Address range: 1000 to 1299
S Grand Ave
Length: 0.24 miles
Direction: N-S
Address range: 900 to 1199
Direction: N-S
Address range: 900 to 1199
E Elm St
Length: 0.24 miles
Direction: E-W
Address range: 100 to 313
Direction: E-W
Address range: 100 to 313
E Hazel St
Length: 0.23 miles
Directions: E-W, SE-NW
Address range: 100 to 299
Directions: E-W, SE-NW
Address range: 100 to 299
Platt St
Length: 0.21 miles
Directions: N-S, SE-NW, SW-NE
Address range: 1000 to 1199
Directions: N-S, SE-NW, SW-NE
Address range: 1000 to 1199
Clear St
Length: 0.09 miles
Direction: N-S
Address range: 1000 to 1099
Direction: N-S
Address range: 1000 to 1099
Cottage Ave
Length: 0.08 miles
Direction: E-W
Address range: 100 to 199
Direction: E-W
Address range: 100 to 199
Gross Ct
Length: 0.08 miles
Direction: E-W
Address range: 100 to 199
Direction: E-W
Address range: 100 to 199
W South St
Length: 0.08 miles
Direction: E-W
Address range: 100 to 199
Direction: E-W
Address range: 100 to 199
W Hazel St
Length: 0.08 miles
Direction: E-W
Address range: 100 to 199
Direction: E-W
Address range: 100 to 199
Railroad features:
Grand Funk Western RR (Amtrak RR)
Length: 0.47 miles
Direction: E-W
Direction: E-W
Conrail RR
Length: 0.05 miles
Direction: N-S
Direction: N-S