Riverside neighborhood in Grand Junction, Colorado (CO), 81505 detailed profile
Settings
X


Business Search - 14 Million verified businesses
Area: 0.347 square miles
Population: 195
Population density:
| Riverside: | 562 people per square mile |
| Grand Junction: | 2,209 people per square mile |

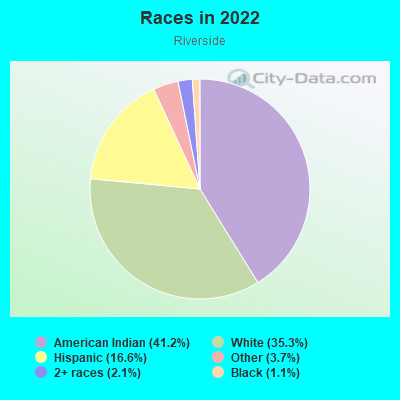
- 13167.9%White
- 6031.1%Hispanic or Latino
- 21.0%Two or more races
Median household income in 2022:
| Riverside: | $80,312 |
| Grand Junction: | $61,458 |
Distribution of median household income
![Distribution of median household income]()
- 2Less than $10,000
- 38$10,000 to $19,999
- 73$20,000 to $29,999
- 10$30,000 to $39,999
- 31$40,000 to $49,999
- 11$50,000 to $59,999
- 4$60,000 to $74,999
- 15$75,000 to $99,999
- 12$100,000 to $124,999
- 29$125,000 to $149,999
- 34$150,000 to $199,999
- 4$200,000 or more

Distribution of owner-occupied house/condo value
![Distribution of owner-occupied house/condo value]()
- 86Less than $50,000
- 57$50,000 to $99,999
- 1$100,000 to $149,999
- 4$150,000 to $199,999
- 16$200,000 to $249,999
- 6$250,000 to $299,999
- 11$300,000 to $399,999
- 11$400,000 to $499,999
- 29$500,000 to $749,999
- 8$750,000 to $999,999
- 3$1,000,000 or more

Distribution of rent paid by renters
![Distribution of rent paid by renters]()
- 11$200 to $299
- 2$300 to $399
- 10$400 to $499
- 29$500 to $599
- 8$600 to $699
- 8$700 to $799
- 2$800 to $899
- 10$900 to $999
- 5$1,000 to $1,249
- 4$1,250 to $1,499
- 27$1,500 to $1,999
- 4$2,000 or more

Median rent in 2022:
| Riverside: | $865 |
| Grand Junction: | $1,037 |
| Males: | 99 |
| Females: | 95 |
Males:
| This neighborhood: | 38.8 years |
| Whole city: | 35.2 years |
| This neighborhood: | 49.1 years |
| Whole city: | 41.4 years |
Average household size:
| Riverside: | 2.4 people |
| Grand Junction: | 2.3 people |
Percentage of family households:
| Riverside: | 34.4% |
| Grand Junction: | 41.5% |
| Here: | 41.6% |
| Grand Junction: | 44.5% |
Percentage of married-couple families with children (among all households):
| Riverside: | 35.2% |
| Grand Junction: | 30.4% |
Percentage of single-mother households (among all households):
| Riverside: | 8.4% |
| Grand Junction: | 7.7% |
Percentage of never married males 15 years old and over:
Percentage of never married females 15 years old and over:
| Riverside: | 11.2% |
| Grand Junction: | 20.7% |
Percentage of never married females 15 years old and over:
| Riverside: | 15.4% |
| city: | 15.0% |
Percentage of people that speak English not well or not at all:
| Riverside: | 1.1% |
| Grand Junction: | 0.8% |
Percentage of people born in this state:
Percentage of people born in another U.S. state:
Percentage of native residents but born outside the U.S.:
Percentage of foreign born residents:
| Here: | 40.9% |
| Grand Junction: | 47.4% |
Percentage of people born in another U.S. state:
| Riverside: | 53.5% |
| Grand Junction: | 47.0% |
Percentage of native residents but born outside the U.S.:
| Here: | 0.5% |
| city: | 1.0% |
Percentage of foreign born residents:
| Here: | 5.2% |
| Grand Junction: | 4.7% |
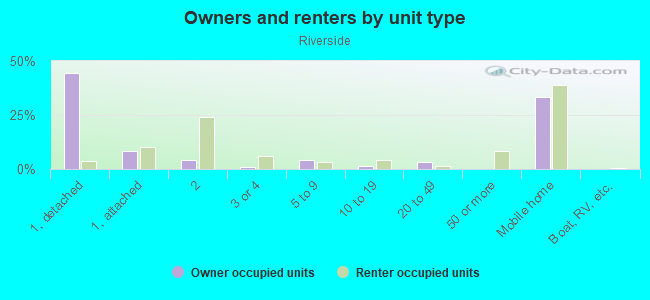
Owner-occupied
Renter-occupied

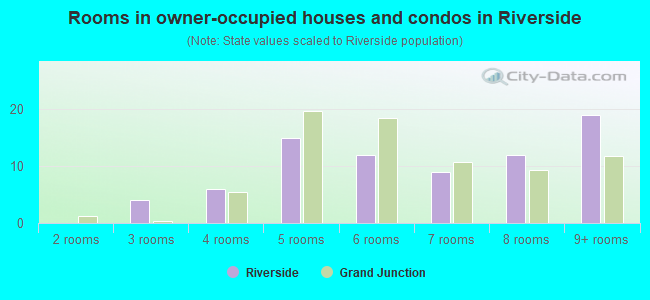
- Rooms in owner-occupied houses and condos in Riverside
- 01 room
- 02 rooms
- 43 rooms
- 64 rooms
- 155 rooms
- 126 rooms
- 97 rooms
- 128 rooms
- 199+ rooms
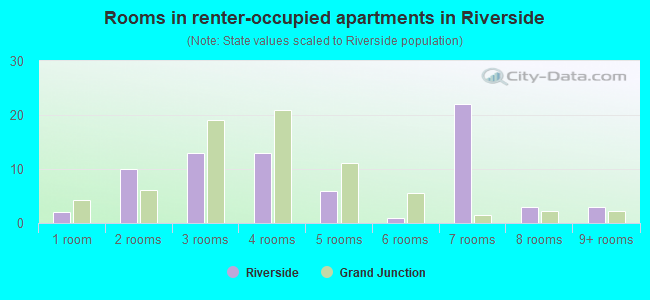
- Rooms in renter-occupied apartments in Riverside
- 21 room
- 102 rooms
- 133 rooms
- 134 rooms
- 65 rooms
- 16 rooms
- 227 rooms
- 38 rooms
- 39+ rooms
Owner-occupied
Renter-occupied
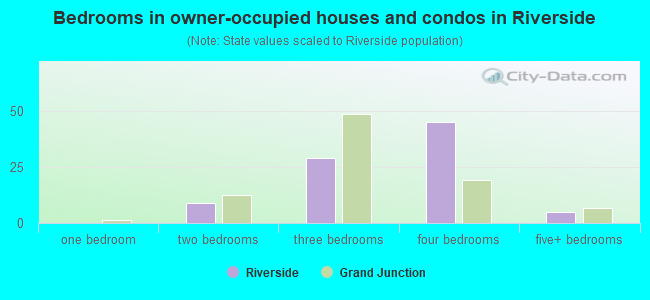
- Bedrooms in owner-occupied houses and condos in Riverside
- 0no bedroom
- 01 bedroom
- 92 bedrooms
- 293 bedrooms
- 454 bedrooms
- 55+ bedrooms
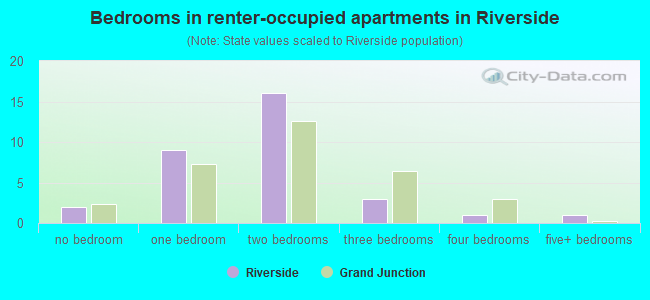
- Bedrooms in renter-occupied apartments in Riverside
- 2no bedroom
- 91 bedroom
- 162 bedrooms
- 33 bedrooms
- 14 bedrooms
- 15+ bedrooms
Average number of cars or other vehicles available in houses/condos:
Average number of cars or other vehicles available in apartments:
| This neighborhood: | 2.2 |
| Grand Junction: | 2.2 |
Average number of cars or other vehicles available in apartments:
| Here: | 1.2 |
| city: | 1.3 |
Percentage of units with a mortgage:
| Riverside: | 50.1% |
| Grand Junction: | 65.2% |
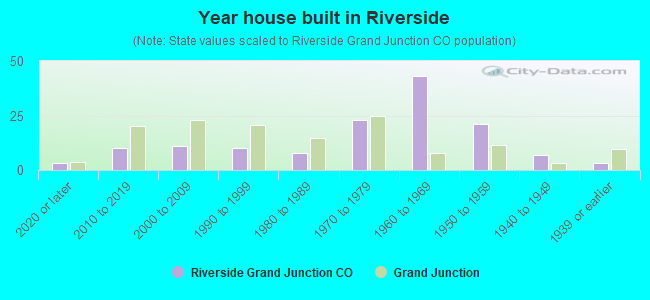
- Year house built in Riverside
- 32020 or later
- 102010 to 2019
- 112000 to 2009
- 101990 to 1999
- 81980 to 1989
- 231970 to 1979
- 431960 to 1969
- 211950 to 1959
- 71940 to 1949
- 31939 or earlier
City-data.com crime index for city in 2020 (higher means more crime):
| City: | 384.0 |
| U.S. average: | 219.5 |
Travel time to work (commute)
![Travel time to work (commute)]()
- 6Less than 5 minutes
- 255 to 9 minutes
- 4510 to 14 minutes
- 2015 to 19 minutes
- 1320 to 24 minutes
- 325 to 29 minutes
- 230 to 34 minutes
- 1345 to 59 minutes
- 560 to 89 minutes
- 190 or more minutes

Means of transportation to work
![Means of transportation to work]()
- 76.3%75Drove a car alone
- 10.2%10Carpooled
- 1.0%1Bus
- 1.0%1Motorcycle
- 12.2%12Bicycle
- 1.0%1Other means
- 9.2%9Worked at home

Time leaving home to go to work
![Time leaving home to go to work]()
- 2312:00 a.m. to 4:59 a.m.
- 15:00 a.m. to 5:29 a.m.
- 55:30 a.m. to 5:59 a.m.
- 56:00 a.m. to 6:29 a.m.
- 86:30 a.m. to 6:59 a.m.
- 217:00 a.m. to 7:29 a.m.
- 207:30 a.m. to 7:59 a.m.
- 138:00 a.m. to 8:29 a.m.
- 38:30 a.m. to 8:59 a.m.
- 129:00 a.m. to 9:59 a.m.
- 610:00 a.m. to 10:59 a.m.
- 211:00 a.m. to 11:59 a.m.
- 712:00 p.m. to 3:59 p.m.
- 64:00 p.m. to 11:59 p.m.

Occupations of males:
- Percentage of males in management occupations (except farmers):
Here: 19.2% city: 11.9%
- Percentage of males in community and social services occupations:
Here: 4.6% city: 2.6%
- Percentage of males in education, training, and library occupations:
Here: 2.8% city: 3.4%
- Percentage of males in arts, design, entertainment, sports, and media occupations:
Here: 2.9% city: 2.8%
- Percentage of males in healthcare practitioners and technical occupations:
Here: 4.5% city: 4.1%
- Percentage of males in service occupations:
Here: 13.1% city: 15.2%
- Percentage of males in sales and office occupations:
Here: 13.7% city: 14.3%
- Percentage of males in farming, fishing, and forestry occupations:
Here: 4.9% city: 0.9%
- Percentage of males in construction, extraction, and maintenance occupations:
Here: 11.7% city: 10.5%
- Percentage of males in production occupations:
Here: 1.4% city: 6.0%
- Percentage of males in transportation occupations:
Here: 1.8% city: 7.4%
- Percentage of males in material moving occupations:
Here: 8.8% city: 3.8%
Occupations of females:
- Percentage of females in management occupations (except farmers):
Here: 7.1% city: 9.3%
- Percentage of females in business and financial operations occupations:
Here: 3.9% city: 4.7%
- Percentage of females in architecture and engineering occupations:
Here: 1.5% city: 1.2%
- Percentage of females in community and social services occupations:
Here: 4.4% city: 2.7%
- Percentage of females in legal occupations:
Here: 4.8% city: 1.2%
- Percentage of females in education, training, and library occupations:
Here: 4.6% city: 9.5%
- Percentage of females in arts, design, entertainment, sports, and media occupations:
Here: 1.4% city: 1.5%
- Percentage of females in healthcare practitioners and technical occupations:
Here: 8.7% city: 13.3%
- Percentage of females in service occupations:
Here: 17.3% city: 20.7%
- Percentage of females in sales and office occupations:
Here: 41.5% city: 28.2%
- Percentage of females in production occupations:
Here: 2.4% city: 1.9%
- Percentage of females in transportation occupations:
Here: 2.3% city: 0.2%
- Percentage of females in material moving occupations:
Here: 1.1% city: 2.3%
Percentage of people 16-64 in Armed Forces:
| Riverside: | 0.1% |
| Grand Junction: | 0.1% |
Education in this neighborhood (subdivision or community):
- Percentage of people 3 years and older in K-12 schools:
Riverside: 12.1% Grand Junction: 13.5%
- Percentage of people 3 years and older in undergraduate colleges:
Riverside: 7.9% Grand Junction: 8.2%
- Percentage of people 3 years and older in grad. or professional schools:
Riverside: 2.1% Grand Junction: 0.8%
- Percentage of students K-12 enrolled in private schools:
Riverside: 52.2% Grand Junction: 12.8%
Percentage of population below poverty level:
| Riverside: | 12.5% |
| Grand Junction: | 14.1% |
Median year owner moved in (as recorded in 2022):
Median year renter moved in (as recorded in 2022):
| Riverside: | 2011 |
| Grand Junction: | 2013 |
Median year renter moved in (as recorded in 2022):
| Riverside: | 2018 |
| Grand Junction: | 2021 |
Percentage of married-couple families with both working:
| Riverside: | 56.8% |
| Grand Junction: | 62.1% |
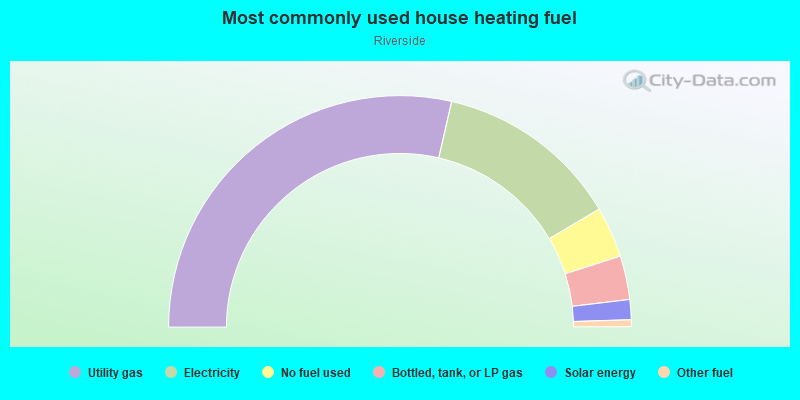
- 57.2%Utility gas
- 25.8%Electricity
- 7.1%No fuel used
- 6.1%Bottled, tank, or LP gas
- 2.8%Solar energy
- 1.0%Other fuel
Highways in this neighborhood:
Hwy 6 and 50 (US Hwy 6, I- 70 Business Lp, US Hwy 50, I- 70 Bus)
Length: 0.04 miles
Direction: E-W
Direction: E-W
Roads and streets:
River Rd
Length: 0.87 miles
Direction: SE-NW
Address range: 2444 to 2499
Direction: SE-NW
Address range: 2444 to 2499
W Independent Ave
Length: 0.37 miles
Directions: E-W, SE-NW
Address range: 2400 to 2499
Directions: E-W, SE-NW
Address range: 2400 to 2499
Independent Ave (W Independent Ave)
Length: 0.27 miles
Directions: E-W, SW-NE
Address range: 2500 to 2515
Directions: E-W, SW-NE
Address range: 2500 to 2515
25 Rd
Length: 0.24 miles
Direction: N-S
Address range: 500 to 535
Direction: N-S
Address range: 500 to 535
24 1/3 Rd
Length: 0.19 miles
Direction: N-S
Direction: N-S
Trolley St
Length: 0.16 miles
Direction: E-W
Direction: E-W
24 3/4 Rd
Length: 0.03 miles
Direction: SW-NE
Direction: SW-NE
Railroad features:
Union Pacific RR
Length: 0.27 miles
Direction: SE-NW
Direction: SE-NW