Riverside neighborhood in Tempe, Arizona (AZ), 85281 detailed profile
Settings
X


Business Search - 14 Million verified businesses
Area: 0.232 square miles
Population: 4,374
Population density:
| Riverside: | 18,838 people per square mile |
| Tempe: | 4,641 people per square mile |

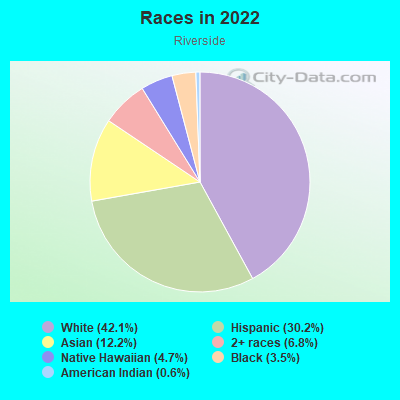
- 1,85542.1%White
- 1,33130.2%Hispanic or Latino
- 53612.2%Asian
- 3006.8%Two or more races
- 2054.7%Native Hawaiian and Other
Pacific Islander - 1523.5%Black
- 250.6%American Indian
Median household income in 2022:
| Riverside: | $65,162 |
| Tempe: | $76,007 |
Distribution of median household income
![Distribution of median household income]()
- 342Less than $10,000
- 90$10,000 to $19,999
- 236$20,000 to $29,999
- 88$30,000 to $39,999
- 330$40,000 to $49,999
- 333$50,000 to $59,999
- 280$60,000 to $74,999
- 282$75,000 to $99,999
- 241$100,000 to $124,999
- 251$125,000 to $149,999
- 61$150,000 to $199,999
- 145$200,000 or more

Distribution of owner-occupied house/condo value
![Distribution of owner-occupied house/condo value]()
- 117Less than $50,000
- 35$100,000 to $149,999
- 45$150,000 to $199,999
- 21$200,000 to $249,999
- 36$250,000 to $299,999
- 282$300,000 to $399,999
- 83$400,000 to $499,999
- 13$500,000 to $749,999

Distribution of rent paid by renters
![Distribution of rent paid by renters]()
- 31$500 to $599
- 5$600 to $699
- 73$700 to $799
- 94$800 to $899
- 341$900 to $999
- 494$1,000 to $1,249
- 91$1,250 to $1,499
- 526$1,500 to $1,999
- 626$2,000 or more

Median rent in 2022:
| Riverside: | $1,520 |
| Tempe: | $1,566 |
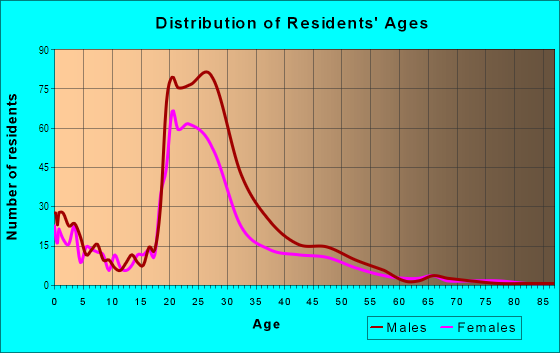
| Males: | 2,474 |
| Females: | 1,900 |
Males:
| This neighborhood: | 28.0 years |
| Whole city: | 28.9 years |
| This neighborhood: | 26.9 years |
| Whole city: | 30.5 years |
Average household size:
| Riverside: | 2.3 people |
| Tempe: | 2.3 people |
Percentage of family households:
| Riverside: | 22.9% |
| Tempe: | 36.3% |
| Here: | 10.0% |
| Tempe: | 32.6% |
Percentage of married-couple families with children (among all households):
| Riverside: | 22.8% |
| Tempe: | 26.9% |
Percentage of single-mother households (among all households):
| Riverside: | 30.0% |
| Tempe: | 8.3% |
Percentage of never married males 15 years old and over:
Percentage of never married females 15 years old and over:
| Riverside: | 41.2% |
| Tempe: | 32.9% |
Percentage of never married females 15 years old and over:
| Riverside: | 28.9% |
| city: | 21.7% |
Percentage of people that speak English not well or not at all:
| Riverside: | 3.9% |
| Tempe: | 2.0% |
Percentage of people born in this state:
Percentage of people born in another U.S. state:
Percentage of native residents but born outside the U.S.:
Percentage of foreign born residents:
| Here: | 37.9% |
| Tempe: | 39.3% |
Percentage of people born in another U.S. state:
| Riverside: | 47.5% |
| Tempe: | 46.0% |
Percentage of native residents but born outside the U.S.:
| Here: | 1.7% |
| city: | 1.8% |
Percentage of foreign born residents:
| Here: | 12.9% |
| Tempe: | 12.9% |
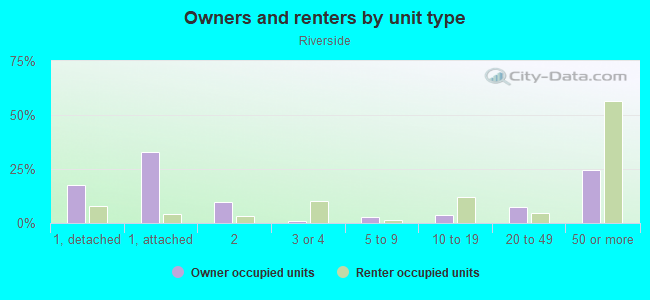
Owner-occupied
Renter-occupied

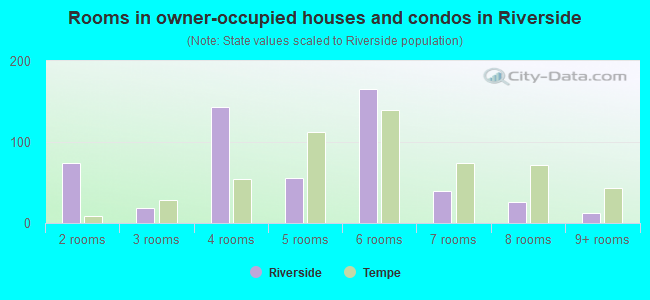
- Rooms in owner-occupied houses and condos in Riverside
- 01 room
- 742 rooms
- 183 rooms
- 1434 rooms
- 565 rooms
- 1656 rooms
- 397 rooms
- 268 rooms
- 129+ rooms
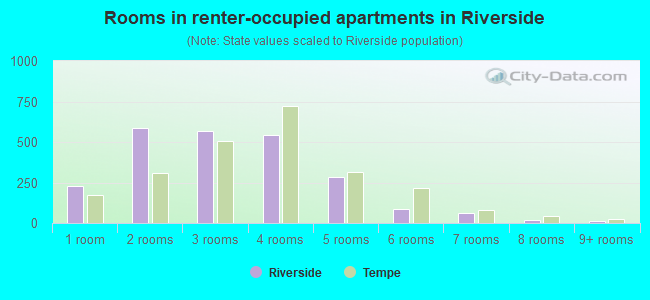
- Rooms in renter-occupied apartments in Riverside
- 2281 room
- 5852 rooms
- 5673 rooms
- 5454 rooms
- 2825 rooms
- 846 rooms
- 647 rooms
- 208 rooms
- 139+ rooms
Owner-occupied
Renter-occupied
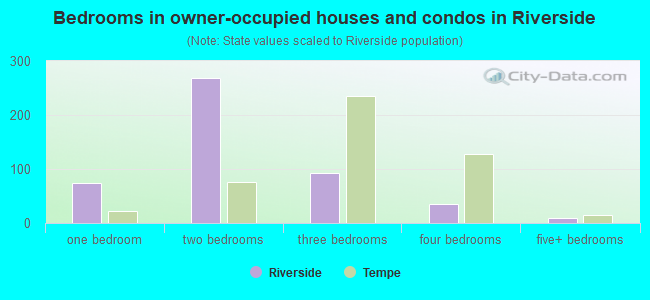
- Bedrooms in owner-occupied houses and condos in Riverside
- 0no bedroom
- 741 bedroom
- 2682 bedrooms
- 933 bedrooms
- 354 bedrooms
- 95+ bedrooms
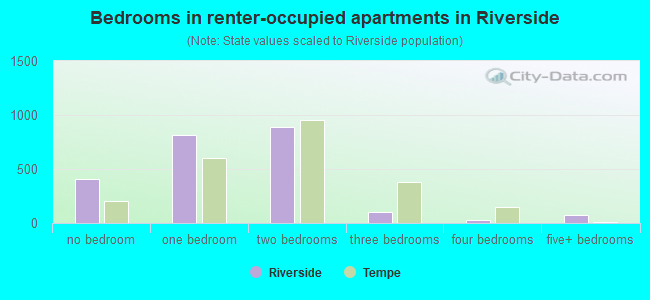
- Bedrooms in renter-occupied apartments in Riverside
- 404no bedroom
- 8151 bedroom
- 8852 bedrooms
- 1003 bedrooms
- 294 bedrooms
- 755+ bedrooms
Average number of cars or other vehicles available in houses/condos:
Average number of cars or other vehicles available in apartments:
| This neighborhood: | 1.0 |
| Tempe: | 2.0 |
Average number of cars or other vehicles available in apartments:
| Here: | 1.2 |
| city: | 1.6 |
Percentage of units with a mortgage:
| Riverside: | 57.1% |
| Tempe: | 69.2% |
Housing prices:
- Average estimated value of detached houses in 2022 (3.2% of all units):
Riverside: $389,263 Tempe: $535,475
- Average estimated value of townhouses or other attached units in 2022 (13.3% of all units):
This neighborhood: $233,977 city: $325,212
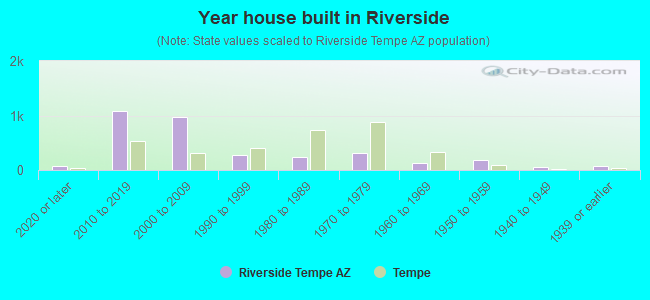
- Year house built in Riverside
- 692020 or later
- 1,0852010 to 2019
- 9712000 to 2009
- 2831990 to 1999
- 2451980 to 1989
- 3181970 to 1979
- 1231960 to 1969
- 1821950 to 1959
- 591940 to 1949
- 671939 or earlier
City-data.com crime index for city in 2020 (higher means more crime):
| City: | 347.1 |
| U.S. average: | 219.5 |
Travel time to work (commute)
![Travel time to work (commute)]()
- 25Less than 5 minutes
- 2035 to 9 minutes
- 32510 to 14 minutes
- 35815 to 19 minutes
- 29520 to 24 minutes
- 22125 to 29 minutes
- 10530 to 34 minutes
- 1035 to 39 minutes
- 3340 to 44 minutes
- 21445 to 59 minutes
- 7060 to 89 minutes
- 2890 or more minutes

Means of transportation to work
![Means of transportation to work]()
- 43.4%1,396Drove a car alone
- 7.9%255Carpooled
- 5.8%185Bus
- 2.0%65Light rail, streetcar or trolley
- 2.5%81Taxi
- 0.4%13Motorcycle
- 4.0%127Bicycle
- 7.6%245Walked
- 0.7%21Other means
- 26.9%866Worked at home

Time leaving home to go to work
![Time leaving home to go to work]()
- 6212:00 a.m. to 4:59 a.m.
- 145:00 a.m. to 5:29 a.m.
- 485:30 a.m. to 5:59 a.m.
- 1316:00 a.m. to 6:29 a.m.
- 1256:30 a.m. to 6:59 a.m.
- 1887:00 a.m. to 7:29 a.m.
- 1177:30 a.m. to 7:59 a.m.
- 3178:00 a.m. to 8:29 a.m.
- 2518:30 a.m. to 8:59 a.m.
- 1139:00 a.m. to 9:59 a.m.
- 6110:00 a.m. to 10:59 a.m.
- 4511:00 a.m. to 11:59 a.m.
- 20912:00 p.m. to 3:59 p.m.
- 774:00 p.m. to 11:59 p.m.

Occupations of males:
- Percentage of males in management occupations (except farmers):
Here: 10.5% city: 10.2%
- Percentage of males in business and financial operations occupations:
Here: 6.3% city: 6.5%
- Percentage of males in computer and mathematical occupations:
Here: 17.4% city: 8.4%
- Percentage of males in architecture and engineering occupations:
Here: 7.4% city: 5.0%
- Percentage of males in life, physical, and social science occupations:
Here: 5.4% city: 1.9%
- Percentage of males in legal occupations:
Here: 2.1% city: 1.1%
- Percentage of males in education, training, and library occupations:
Here: 4.5% city: 6.1%
- Percentage of males in arts, design, entertainment, sports, and media occupations:
Here: 4.4% city: 2.8%
- Percentage of males in healthcare practitioners and technical occupations:
Here: 4.7% city: 2.8%
- Percentage of males in service occupations:
Here: 10.9% city: 14.4%
- Percentage of males in sales and office occupations:
Here: 11.6% city: 19.0%
- Percentage of males in construction, extraction, and maintenance occupations:
Here: 5.9% city: 5.1%
- Percentage of males in production occupations:
Here: 4.9% city: 4.4%
- Percentage of males in transportation occupations:
Here: 1.6% city: 3.9%
Occupations of females:
- Percentage of females in management occupations (except farmers):
Here: 8.9% city: 7.5%
- Percentage of females in business and financial operations occupations:
Here: 25.5% city: 9.3%
- Percentage of females in computer and mathematical occupations:
Here: 7.7% city: 3.3%
- Percentage of females in life, physical, and social science occupations:
Here: 2.5% city: 1.5%
- Percentage of females in community and social services occupations:
Here: 2.7% city: 3.4%
- Percentage of females in education, training, and library occupations:
Here: 1.6% city: 12.0%
- Percentage of females in arts, design, entertainment, sports, and media occupations:
Here: 8.2% city: 3.1%
- Percentage of females in service occupations:
Here: 21.7% city: 18.9%
- Percentage of females in sales and office occupations:
Here: 21.1% city: 26.9%
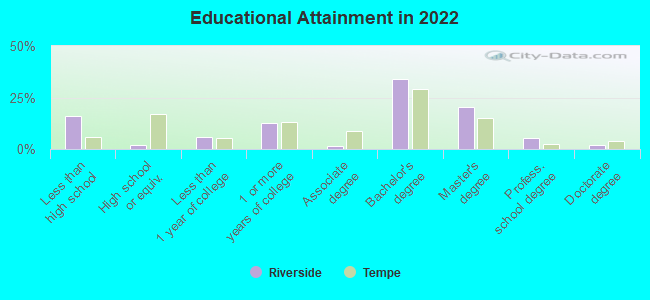
Education in this neighborhood (subdivision or community):
- Percentage of people 3 years and older in K-12 schools:
Riverside: 8.3% Tempe: 12.5%
- Percentage of people 3 years and older in undergraduate colleges:
Riverside: 22.3% Tempe: 15.4%
- Percentage of people 3 years and older in grad. or professional schools:
Riverside: 8.5% Tempe: 6.3%
- Percentage of students K-12 enrolled in private schools:
Riverside: 34.3% Tempe: 9.2%
Percentage of population below poverty level:
| Riverside: | 29.7% |
| Tempe: | 15.0% |
Median year owner moved in (as recorded in 2022):
| Riverside: | 2007 |
| Tempe: | 2013 |
Percentage of married-couple families with both working:
| Riverside: | 120.3% |
| Tempe: | 77.6% |
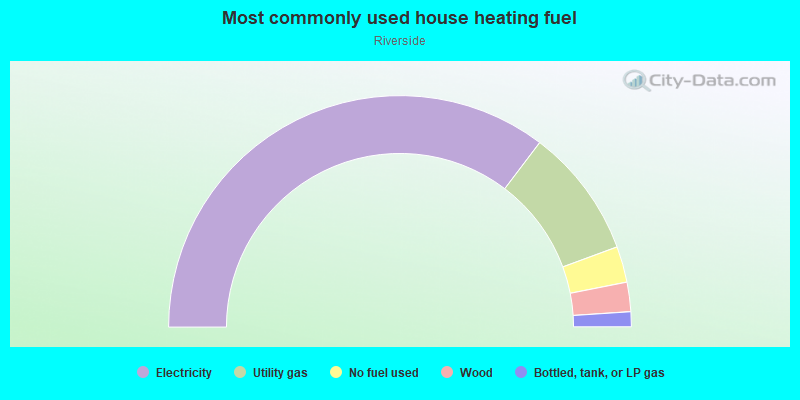
- 70.5%Electricity
- 18.1%Utility gas
- 5.0%No fuel used
- 4.1%Wood
- 2.1%Bottled, tank, or LP gas
Roads and streets:
S Farmer Ave
Length: 0.47 miles
Directions: E-W, N-S, SE-NW, SW-NE
Address range: 350 to 799
Directions: E-W, N-S, SE-NW, SW-NE
Address range: 350 to 799
W University Dr
Length: 0.45 miles
Direction: E-W
Address range: 300 to 867
Direction: E-W
Address range: 300 to 867
W 5th St
Length: 0.41 miles
Direction: E-W
Address range: 400 to 799
Direction: E-W
Address range: 400 to 799
S Roosevelt St
Length: 0.41 miles
Direction: N-S
Address range: 238 to 799
Direction: N-S
Address range: 238 to 799
W 7th St
Length: 0.34 miles
Direction: E-W
Address range: 300 to 879
Direction: E-W
Address range: 300 to 879
S Wilson St
Length: 0.32 miles
Directions: N-S, SE-NW
Address range: 168 to 699
Directions: N-S, SE-NW
Address range: 168 to 699
W Brown St
Length: 0.22 miles
Direction: E-W
Address range: 500 to 799
Direction: E-W
Address range: 500 to 799
W 6th St
Length: 0.21 miles
Direction: E-W
Address range: 300 to 499
Direction: E-W
Address range: 300 to 499
W 3rd St
Length: 0.20 miles
Directions: E-W, SE-NW
Address range: 600 to 999
Directions: E-W, SE-NW
Address range: 600 to 999
W 2nd St
Length: 0.14 miles
Direction: E-W
Address range: 500 to 899
Direction: E-W
Address range: 500 to 899
S McKemy St
Length: 0.12 miles
Directions: N-S, SE-NW, SW-NE
Address range: 228 to 499
Directions: N-S, SE-NW, SW-NE
Address range: 228 to 499
S Rosen Dr
Length: 0.09 miles
Direction: N-S
Address range: 700 to 799
Direction: N-S
Address range: 700 to 799
S Mitchell Dr
Length: 0.05 miles
Direction: N-S
Address range: 400 to 499
Direction: N-S
Address range: 400 to 499
S Carney Ave
Length: 0.05 miles
Direction: N-S
Address range: 100 to 399
Direction: N-S
Address range: 100 to 399