Rogers Industrial Park neighborhood in Rogers, Arkansas (AR), 72756 detailed profile
Settings
X


Business Search - 14 Million verified businesses
Area: 0.397 square miles
Population: 664
Population density:
| Rogers Industrial Park: | 1,675 people per square mile |
| Rogers: | 2,177 people per square mile |

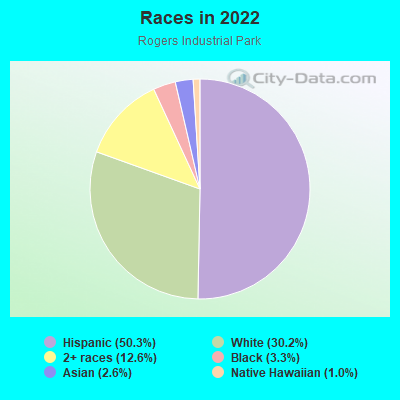
- 38650.3%Hispanic or Latino
- 23230.2%White
- 9712.6%Two or more races
- 253.3%Black
- 202.6%Asian
- 81.0%Native Hawaiian and Other
Pacific Islander
Median household income in 2022:
| Rogers Industrial Park: | $62,679 |
| Rogers: | $81,770 |
Distribution of median household income
![Distribution of median household income]()
- 11Less than $10,000
- 19$10,000 to $19,999
- 11$20,000 to $29,999
- 30$30,000 to $39,999
- 29$40,000 to $49,999
- 3$50,000 to $59,999
- 6$60,000 to $74,999
- 66$75,000 to $99,999
- 3$100,000 to $124,999
- 24$125,000 to $149,999
- 6$150,000 to $199,999
- 6$200,000 or more

Distribution of owner-occupied house/condo value
![Distribution of owner-occupied house/condo value]()
- 10Less than $50,000
- 22$50,000 to $99,999
- 17$100,000 to $149,999
- 9$150,000 to $199,999
- 3$200,000 to $249,999
- 8$250,000 to $299,999
- 5$500,000 to $749,999

Distribution of rent paid by renters
![Distribution of rent paid by renters]()
- 8Less than $100
- 9$100 to $199
- 42$200 to $299
- 48$300 to $399
- 34$400 to $499
- 29$500 to $599
- 22$600 to $699
- 22$700 to $799
- 23$800 to $899
- 27$900 to $999
- 6$1,000 to $1,249

Median rent in 2022:
| Rogers Industrial Park: | $697 |
| Rogers: | $998 |
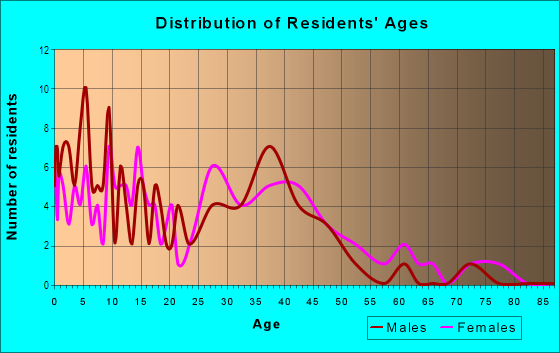
| Males: | 340 |
| Females: | 323 |
Males:
| This neighborhood: | 28.2 years |
| Whole city: | 34.0 years |
| This neighborhood: | 30.0 years |
| Whole city: | 38.7 years |
Average household size:
| Rogers Industrial Park: | 3.3 people |
| Rogers: | 2.7 people |
Percentage of family households:
| Rogers Industrial Park: | 71.7% |
| Rogers: | 56.7% |
| Here: | 51.0% |
| Rogers: | 58.6% |
Percentage of married-couple families with children (among all households):
| Rogers Industrial Park: | 19.5% |
| Rogers: | 26.9% |
Percentage of single-mother households (among all households):
| Rogers Industrial Park: | 10.6% |
| Rogers: | 6.4% |
Percentage of never married males 15 years old and over:
Percentage of never married females 15 years old and over:
| Rogers Industrial Park: | 24.9% |
| Rogers: | 14.3% |
Percentage of never married females 15 years old and over:
| Rogers Industrial Park: | 23.7% |
| city: | 13.4% |
Percentage of people born in this state:
Percentage of people born in another U.S. state:
Percentage of native residents but born outside the U.S.:
Percentage of foreign born residents:
| Here: | 39.4% |
| Rogers: | 41.1% |
Percentage of people born in another U.S. state:
| Rogers Industrial Park: | 36.7% |
| Rogers: | 41.9% |
Percentage of native residents but born outside the U.S.:
| Here: | 4.8% |
| city: | 2.1% |
Percentage of foreign born residents:
| Here: | 19.1% |
| Rogers: | 15.0% |
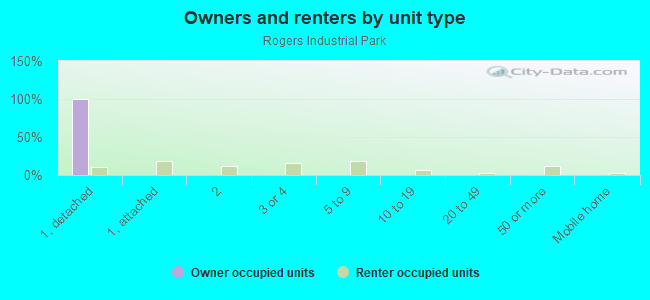
Owner-occupied
Renter-occupied

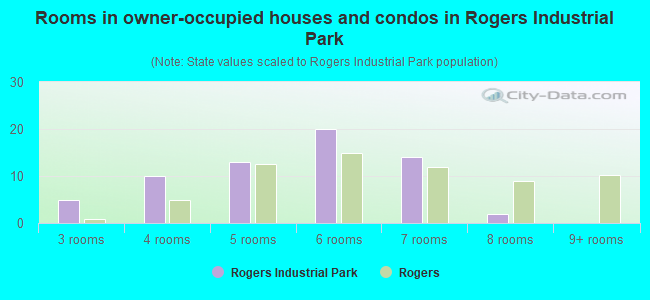
- Rooms in owner-occupied houses and condos in Rogers Industrial Park
- 01 room
- 02 rooms
- 53 rooms
- 104 rooms
- 135 rooms
- 206 rooms
- 147 rooms
- 28 rooms
- 09+ rooms
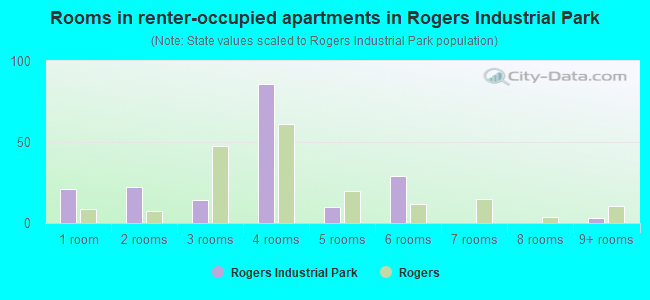
- Rooms in renter-occupied apartments in Rogers Industrial Park
- 211 room
- 222 rooms
- 143 rooms
- 864 rooms
- 105 rooms
- 296 rooms
- 07 rooms
- 08 rooms
- 39+ rooms
Owner-occupied
Renter-occupied
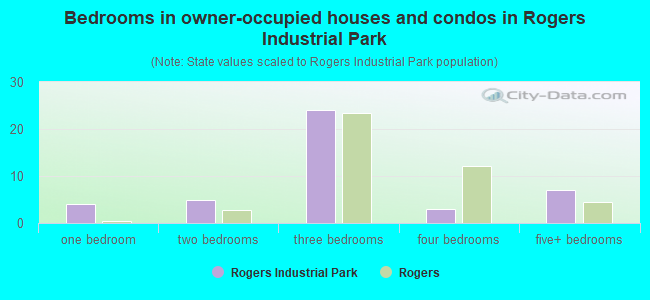
- Bedrooms in owner-occupied houses and condos in Rogers Industrial Park
- 0no bedroom
- 41 bedroom
- 52 bedrooms
- 243 bedrooms
- 34 bedrooms
- 75+ bedrooms
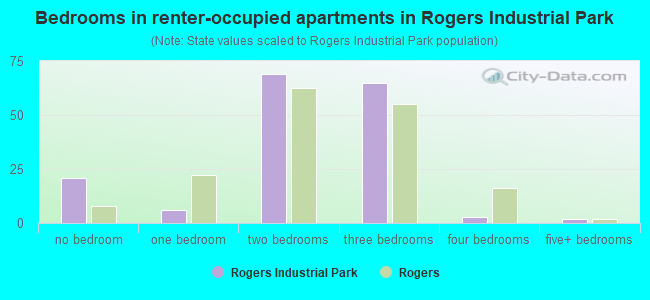
- Bedrooms in renter-occupied apartments in Rogers Industrial Park
- 21no bedroom
- 61 bedroom
- 692 bedrooms
- 653 bedrooms
- 34 bedrooms
- 25+ bedrooms
Average number of cars or other vehicles available in houses/condos:
Average number of cars or other vehicles available in apartments:
| This neighborhood: | 1.8 |
| Rogers: | 2.2 |
Average number of cars or other vehicles available in apartments:
| Here: | 1.6 |
| city: | 1.6 |
Percentage of units with a mortgage:
| Rogers Industrial Park: | 71.6% |
| Rogers: | 68.3% |
Average estimated value of detached houses in 2022 (30.2% of all units):
| Rogers Industrial Park: | $184,663 |
| Arkansas: | $243,881 |
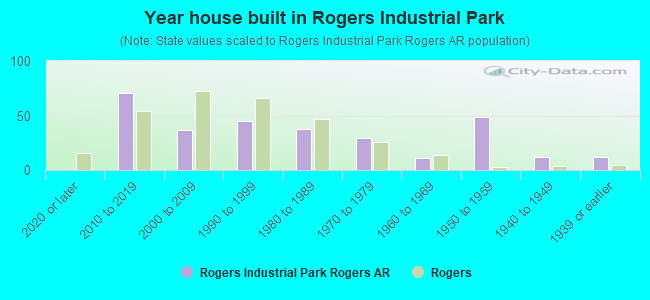
- Year house built in Rogers Industrial Park
- 02020 or later
- 712010 to 2019
- 372000 to 2009
- 451990 to 1999
- 381980 to 1989
- 291970 to 1979
- 111960 to 1969
- 491950 to 1959
- 121940 to 1949
- 121939 or earlier
City-data.com crime index for city in 2020 (higher means more crime):
| City: | 256.2 |
| U.S. average: | 219.5 |
Travel time to work (commute)
![Travel time to work (commute)]()
- 19Less than 5 minutes
- 815 to 9 minutes
- 6410 to 14 minutes
- 11415 to 19 minutes
- 7920 to 24 minutes
- 1625 to 29 minutes
- 6130 to 34 minutes
- 3145 to 59 minutes
- 460 to 89 minutes
- 490 or more minutes

Means of transportation to work
![Means of transportation to work]()
- 46.4%152Drove a car alone
- 33.5%110Carpooled
- 0.9%3Bicycle
- 8.2%27Walked
- 11.3%37Worked at home

Time leaving home to go to work
![Time leaving home to go to work]()
- 2312:00 a.m. to 4:59 a.m.
- 265:00 a.m. to 5:29 a.m.
- 125:30 a.m. to 5:59 a.m.
- 746:00 a.m. to 6:29 a.m.
- 816:30 a.m. to 6:59 a.m.
- 897:00 a.m. to 7:29 a.m.
- 187:30 a.m. to 7:59 a.m.
- 278:00 a.m. to 8:29 a.m.
- 98:30 a.m. to 8:59 a.m.
- 269:00 a.m. to 9:59 a.m.
- 4912:00 p.m. to 3:59 p.m.
- 354:00 p.m. to 11:59 p.m.

Occupations of males:
- Percentage of males in computer and mathematical occupations:
Here: 2.9% city: 4.2%
- Percentage of males in architecture and engineering occupations:
Here: 1.8% city: 2.1%
- Percentage of males in education, training, and library occupations:
Here: 10.4% city: 2.5%
- Percentage of males in healthcare practitioners and technical occupations:
Here: 6.6% city: 2.3%
- Percentage of males in service occupations:
Here: 13.9% city: 11.4%
- Percentage of males in sales and office occupations:
Here: 9.3% city: 17.8%
- Percentage of males in construction, extraction, and maintenance occupations:
Here: 53.5% city: 13.2%
- Percentage of males in production occupations:
Here: 3.3% city: 10.8%
- Percentage of males in transportation occupations:
Here: 3.5% city: 3.7%
- Percentage of males in material moving occupations:
Here: 4.6% city: 7.7%
Occupations of females:
- Percentage of females in management occupations (except farmers):
Here: 11.9% city: 7.7%
- Percentage of females in business and financial operations occupations:
Here: 8.7% city: 5.3%
- Percentage of females in community and social services occupations:
Here: 2.8% city: 1.8%
- Percentage of females in legal occupations:
Here: 2.5% city: 0.9%
- Percentage of females in education, training, and library occupations:
Here: 4.7% city: 7.5%
- Percentage of females in arts, design, entertainment, sports, and media occupations:
Here: 2.8% city: 2.8%
- Percentage of females in healthcare practitioners and technical occupations:
Here: 8.9% city: 8.1%
- Percentage of females in service occupations:
Here: 33.7% city: 21.3%
- Percentage of females in sales and office occupations:
Here: 23.5% city: 27.5%
- Percentage of females in production occupations:
Here: 22.9% city: 9.2%
- Percentage of females in transportation occupations:
Here: 1.2% city: 1.1%
- Percentage of females in material moving occupations:
Here: 6.6% city: 3.8%
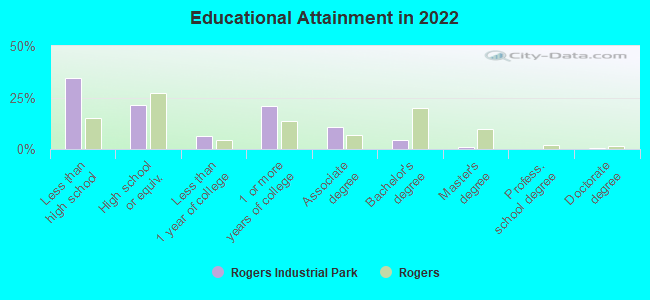
Education in this neighborhood (subdivision or community):
- Percentage of people 3 years and older in K-12 schools:
Rogers Industrial Park: 27.4% Rogers: 19.9%
- Percentage of people 3 years and older in undergraduate colleges:
Rogers Industrial Park: 0.5% Rogers: 4.3%
- Percentage of people 3 years and older in grad. or professional schools:
Rogers Industrial Park: 0.8% Rogers: 0.7%
- Percentage of students K-12 enrolled in private schools:
Rogers Industrial Park: 2.3% Rogers: 10.5%
Percentage of population below poverty level:
| Rogers Industrial Park: | 27.6% |
| Rogers: | 12.3% |
Median year owner moved in (as recorded in 2022):
Median year renter moved in (as recorded in 2022):
| Rogers Industrial Park: | 2006 |
| Rogers: | 2014 |
Median year renter moved in (as recorded in 2022):
| Rogers Industrial Park: | 2014 |
| Rogers: | 2020 |
Percentage of married-couple families with both working:
| Rogers Industrial Park: | 86.8% |
| Rogers: | 69.7% |
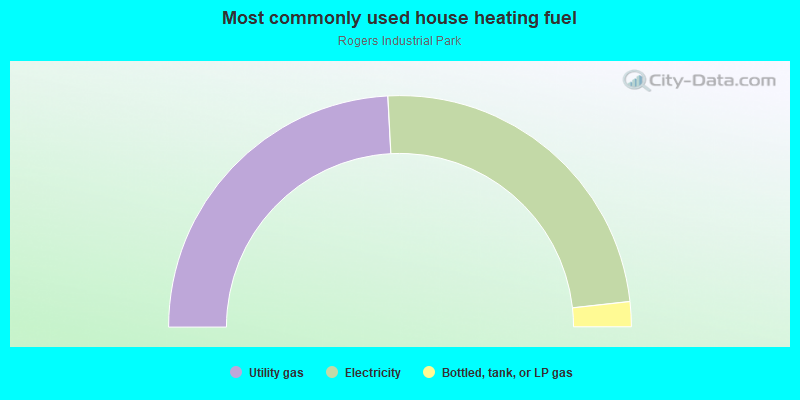
- 48.4%Utility gas
- 48.2%Electricity
- 3.5%Bottled, tank, or LP gas
Roads and streets:
Bekaert Dr
Length: 0.76 miles
Directions: E-W, N-S, SW-NE
Directions: E-W, N-S, SW-NE
N 35th St
Length: 0.16 miles
Direction: N-S
Direction: N-S