Ruston neighborhood in Tacoma, Washington (WA), 98407 detailed profile
Settings
X


Business Search - 14 Million verified businesses
Area: 0.254 square miles
Population: 1,083
Population density:
| Ruston: | 4,262 people per square mile |
| Tacoma: | 4,429 people per square mile |

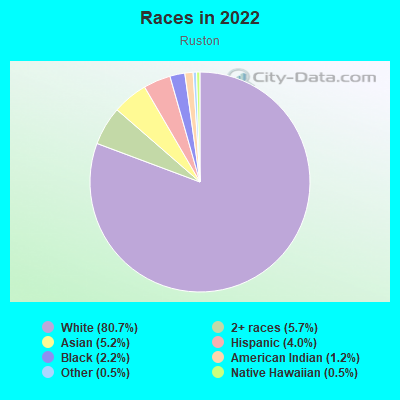
- 88080.7%White
- 625.7%Two or more races
- 575.2%Asian
- 444.0%Hispanic or Latino
- 242.2%Black
- 131.2%American Indian
- 50.5%Native Hawaiian and Other
Pacific Islander - 60.5%Some other race
Median household income in 2022:
| Ruston: | $102,996 |
| Tacoma: | $80,784 |
Distribution of median household income
![Distribution of median household income]()
- 7Less than $10,000
- 67$10,000 to $19,999
- 27$20,000 to $29,999
- 10$30,000 to $39,999
- 20$40,000 to $49,999
- 51$50,000 to $59,999
- 77$60,000 to $74,999
- 81$75,000 to $99,999
- 67$100,000 to $124,999
- 51$125,000 to $149,999
- 66$150,000 to $199,999
- 93$200,000 or more

Distribution of owner-occupied house/condo value
![Distribution of owner-occupied house/condo value]()
- 9Less than $50,000
- 1$50,000 to $99,999
- 2$100,000 to $149,999
- 48$250,000 to $299,999
- 34$300,000 to $399,999
- 78$400,000 to $499,999
- 69$500,000 to $749,999
- 97$750,000 to $999,999
- 48$1,000,000 or more

Distribution of rent paid by renters
![Distribution of rent paid by renters]()
- 9$800 to $899
- 18$900 to $999
- 56$1,000 to $1,249
- 37$1,250 to $1,499
- 31$1,500 to $1,999
- 94$2,000 or more

Median rent in 2022:
| Ruston: | $1,477 |
| Tacoma: | $1,426 |
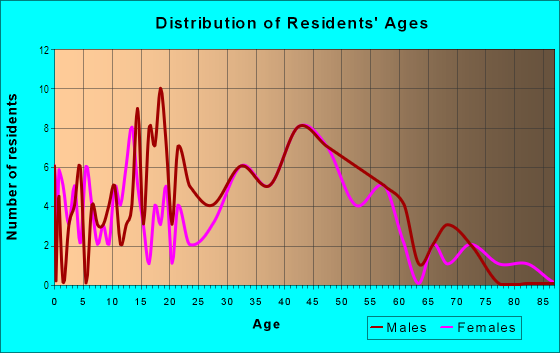
| Males: | 504 |
| Females: | 579 |
Males:
| This neighborhood: | 43.3 years |
| Whole city: | 36.0 years |
| This neighborhood: | 50.7 years |
| Whole city: | 38.1 years |
Average household size:
| Ruston: | 1.9 people |
| Tacoma: | 2.4 people |
Percentage of family households:
| Ruston: | 31.9% |
| Tacoma: | 43.7% |
| Here: | 34.5% |
| Tacoma: | 39.9% |
Percentage of married-couple families with children (among all households):
| Ruston: | 41.8% |
| Tacoma: | 27.8% |
Percentage of single-mother households (among all households):
| Ruston: | 10.4% |
| Tacoma: | 8.6% |
Percentage of never married males 15 years old and over:
Percentage of never married females 15 years old and over:
| Ruston: | 15.6% |
| Tacoma: | 20.8% |
Percentage of never married females 15 years old and over:
| Ruston: | 10.5% |
| city: | 17.5% |
Percentage of people that speak English not well or not at all:
| Ruston: | 0.2% |
| Tacoma: | 3.1% |
Percentage of people born in this state:
Percentage of people born in another U.S. state:
Percentage of native residents but born outside the U.S.:
Percentage of foreign born residents:
| Here: | 46.5% |
| Tacoma: | 48.7% |
Percentage of people born in another U.S. state:
| Ruston: | 43.5% |
| Tacoma: | 37.0% |
Percentage of native residents but born outside the U.S.:
| Here: | 2.9% |
| city: | 2.4% |
Percentage of foreign born residents:
| Here: | 7.1% |
| Tacoma: | 12.0% |
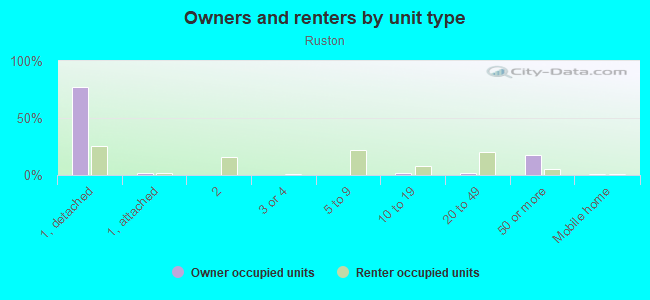
Owner-occupied
Renter-occupied

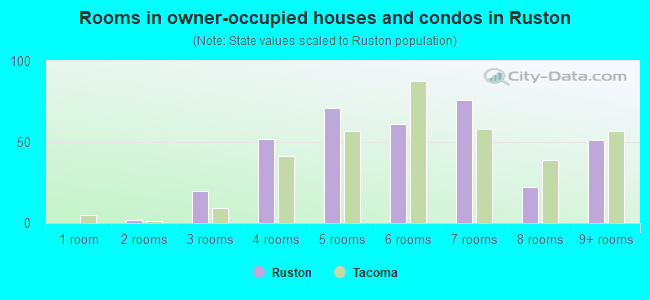
- Rooms in owner-occupied houses and condos in Ruston
- 01 room
- 22 rooms
- 203 rooms
- 524 rooms
- 715 rooms
- 616 rooms
- 767 rooms
- 228 rooms
- 519+ rooms
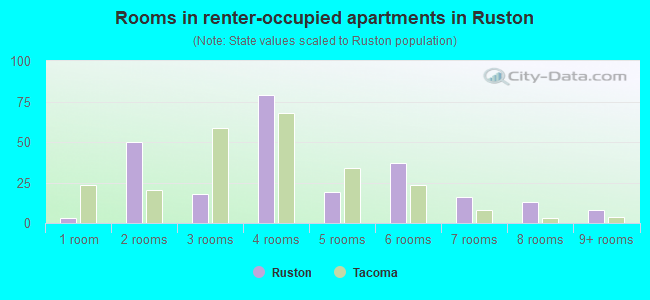
- Rooms in renter-occupied apartments in Ruston
- 31 room
- 502 rooms
- 183 rooms
- 794 rooms
- 195 rooms
- 376 rooms
- 167 rooms
- 138 rooms
- 89+ rooms
Owner-occupied
Renter-occupied
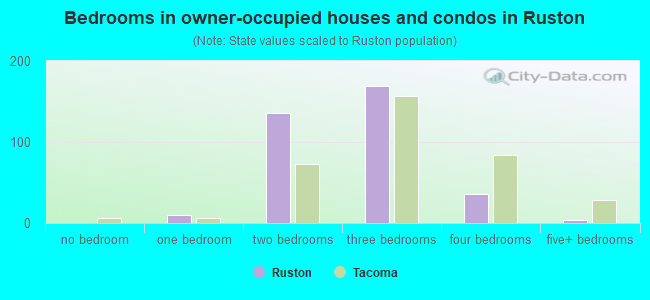
- Bedrooms in owner-occupied houses and condos in Ruston
- 0no bedroom
- 101 bedroom
- 1362 bedrooms
- 1693 bedrooms
- 364 bedrooms
- 45+ bedrooms
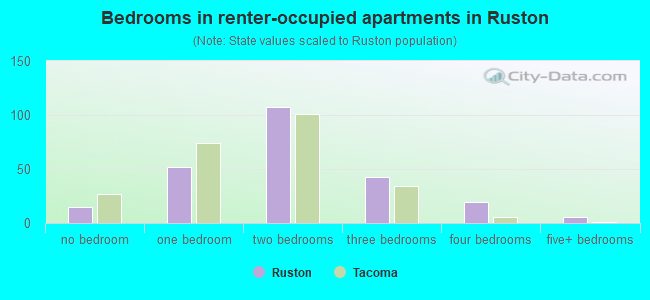
- Bedrooms in renter-occupied apartments in Ruston
- 15no bedroom
- 521 bedroom
- 1072 bedrooms
- 433 bedrooms
- 194 bedrooms
- 65+ bedrooms
Average number of cars or other vehicles available in houses/condos:
Average number of cars or other vehicles available in apartments:
| This neighborhood: | 1.9 |
| Tacoma: | 2.2 |
Average number of cars or other vehicles available in apartments:
| Here: | 1.3 |
| city: | 1.2 |
Percentage of units with a mortgage:
| Ruston: | 66.5% |
| Tacoma: | 72.4% |
Housing prices:
- Average estimated value of detached houses in 2022 (60.1% of all units):
Ruston: $646,137 Washington: $734,307
- Average estimated '22 value of housing units in 5-or-more-unit structures (13.7% of all units):
Ruston: $904,647 Washington: $503,183
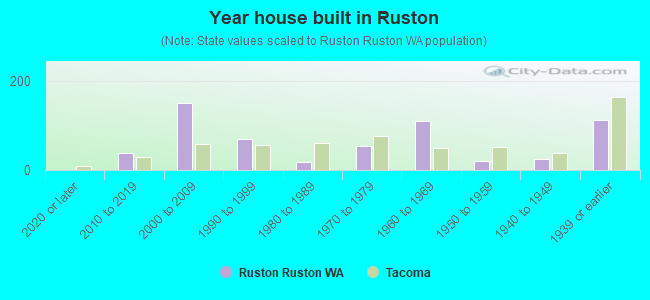
- Year house built in Ruston
- 02020 or later
- 382010 to 2019
- 1512000 to 2009
- 701990 to 1999
- 191980 to 1989
- 551970 to 1979
- 1101960 to 1969
- 211950 to 1959
- 251940 to 1949
- 1121939 or earlier
City-data.com crime index for city in 2020 (higher means more crime):
| City: | 532.7 |
| U.S. average: | 219.5 |
Travel time to work (commute)
![Travel time to work (commute)]()
- 13Less than 5 minutes
- 145 to 9 minutes
- 2810 to 14 minutes
- 5815 to 19 minutes
- 5920 to 24 minutes
- 2925 to 29 minutes
- 5030 to 34 minutes
- 1235 to 39 minutes
- 3340 to 44 minutes
- 5645 to 59 minutes
- 5460 to 89 minutes
- 2090 or more minutes

Means of transportation to work
![Means of transportation to work]()
- 79.9%491Drove a car alone
- 4.6%28Carpooled
- 1.5%9Bus
- 0.7%4Long-distance train or commuter rail
- 1.0%6Bicycle
- 0.7%4Walked
- 0.3%2Other means
- 11.4%70Worked at home

Time leaving home to go to work
![Time leaving home to go to work]()
- 3112:00 a.m. to 4:59 a.m.
- 495:00 a.m. to 5:29 a.m.
- 285:30 a.m. to 5:59 a.m.
- 246:00 a.m. to 6:29 a.m.
- 356:30 a.m. to 6:59 a.m.
- 777:00 a.m. to 7:29 a.m.
- 217:30 a.m. to 7:59 a.m.
- 388:00 a.m. to 8:29 a.m.
- 528:30 a.m. to 8:59 a.m.
- 299:00 a.m. to 9:59 a.m.
- 1310:00 a.m. to 10:59 a.m.
- 211:00 a.m. to 11:59 a.m.
- 1512:00 p.m. to 3:59 p.m.
- 104:00 p.m. to 11:59 p.m.

Occupations of males:
- Percentage of males in management occupations (except farmers):
Here: 26.6% city: 9.1%
- Percentage of males in business and financial operations occupations:
Here: 3.1% city: 5.1%
- Percentage of males in computer and mathematical occupations:
Here: 3.9% city: 4.4%
- Percentage of males in architecture and engineering occupations:
Here: 2.2% city: 2.7%
- Percentage of males in life, physical, and social science occupations:
Here: 1.5% city: 0.7%
- Percentage of males in community and social services occupations:
Here: 6.6% city: 1.7%
- Percentage of males in legal occupations:
Here: 1.6% city: 1.1%
- Percentage of males in education, training, and library occupations:
Here: 4.5% city: 3.2%
- Percentage of males in arts, design, entertainment, sports, and media occupations:
Here: 2.8% city: 1.3%
- Percentage of males in healthcare practitioners and technical occupations:
Here: 4.4% city: 3.5%
- Percentage of males in service occupations:
Here: 11.7% city: 15.1%
- Percentage of males in sales and office occupations:
Here: 10.7% city: 13.9%
- Percentage of males in construction, extraction, and maintenance occupations:
Here: 8.3% city: 9.4%
- Percentage of males in production occupations:
Here: 1.4% city: 6.3%
- Percentage of males in transportation occupations:
Here: 2.7% city: 7.7%
- Percentage of males in material moving occupations:
Here: 5.3% city: 8.1%
Occupations of females:
- Percentage of females in management occupations (except farmers):
Here: 19.7% city: 9.6%
- Percentage of females in business and financial operations occupations:
Here: 8.2% city: 7.0%
- Percentage of females in life, physical, and social science occupations:
Here: 2.9% city: 1.3%
- Percentage of females in community and social services occupations:
Here: 6.0% city: 3.4%
- Percentage of females in legal occupations:
Here: 1.4% city: 1.6%
- Percentage of females in education, training, and library occupations:
Here: 6.8% city: 10.0%
- Percentage of females in arts, design, entertainment, sports, and media occupations:
Here: 1.3% city: 1.8%
- Percentage of females in healthcare practitioners and technical occupations:
Here: 7.9% city: 9.0%
- Percentage of females in service occupations:
Here: 9.0% city: 20.7%
- Percentage of females in sales and office occupations:
Here: 31.7% city: 25.0%
- Percentage of females in transportation occupations:
Here: 2.9% city: 1.7%
Percentage of people 16-64 in Armed Forces:
| Ruston: | 1.2% |
| Tacoma: | 1.4% |
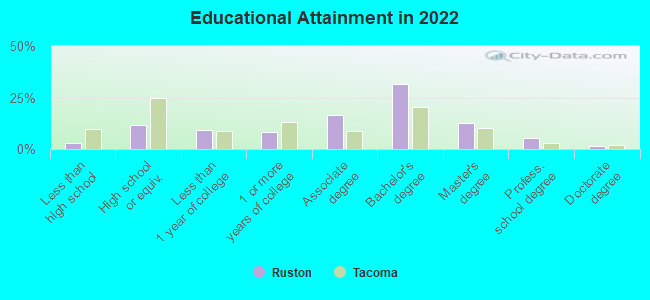
Education in this neighborhood (subdivision or community):
- Percentage of people 3 years and older in K-12 schools:
Ruston: 8.5% Tacoma: 14.0%
- Percentage of people 3 years and older in undergraduate colleges:
Ruston: 3.8% Tacoma: 5.4%
- Percentage of people 3 years and older in grad. or professional schools:
Ruston: 0.8% Tacoma: 1.6%
- Percentage of students K-12 enrolled in private schools:
Ruston: 32.6% Tacoma: 12.6%
Percentage of population below poverty level:
| Ruston: | 9.3% |
| Tacoma: | 14.2% |
Median year owner moved in (as recorded in 2022):
Median year renter moved in (as recorded in 2022):
| Ruston: | 2010 |
| Tacoma: | 2013 |
Median year renter moved in (as recorded in 2022):
| Ruston: | 2018 |
| Tacoma: | 2020 |
Percentage of married-couple families with both working:
| Ruston: | 90.9% |
| Tacoma: | 65.1% |
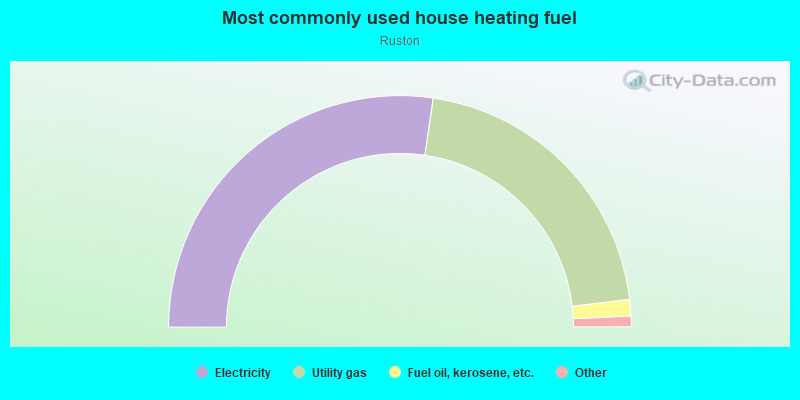
- 54.6%Electricity
- 41.6%Utility gas
- 2.3%Fuel oil, kerosene, etc.
- 0.9%Bottled, tank, or LP gas
- 0.7%Wood
Roads and streets:
N 49th St
Length: 0.65 miles
Direction: E-W
Address range: 4801 to 5623
Direction: E-W
Address range: 4801 to 5623
Rust Way
Length: 0.45 miles
Direction: E-W
Address range: 5443 to 5449
Direction: E-W
Address range: 5443 to 5449
N 51st St
Length: 0.44 miles
Directions: E-W, SW-NE
Address range: 5300 to 5799
Directions: E-W, SW-NE
Address range: 5300 to 5799
N 52nd St
Length: 0.42 miles
Direction: E-W
Address range: 5300 to 5799
Direction: E-W
Address range: 5300 to 5799
N Highland St
Length: 0.38 miles
Direction: N-S
Address range: 4900 to 5299
Direction: N-S
Address range: 4900 to 5299
N Winnifred St
Length: 0.36 miles
Direction: N-S
Address range: 4901 to 5299
Direction: N-S
Address range: 4901 to 5299
N Commercial St
Length: 0.34 miles
Direction: E-W
Address range: 5300 to 5599
Direction: E-W
Address range: 5300 to 5599
N 53rd St
Length: 0.28 miles
Direction: E-W
Address range: 5400 to 5799
Direction: E-W
Address range: 5400 to 5799
N Court St
Length: 0.26 miles
Direction: E-W
Address range: 5300 to 5499
Direction: E-W
Address range: 5300 to 5499
N Bennett St
Length: 0.26 miles
Direction: N-S
Address range: 4850 to 5299
Direction: N-S
Address range: 4850 to 5299
N Baltimore St
Length: 0.24 miles
Direction: N-S
Address range: 4874 to 5131
Direction: N-S
Address range: 4874 to 5131
N Shirley St
Length: 0.20 miles
Direction: N-S
Address range: 4876 to 5299
Direction: N-S
Address range: 4876 to 5299
Gallagher Way
Length: 0.20 miles
Directions: N-S, SE-NW
Address range: 5100 to 5199
Directions: N-S, SE-NW
Address range: 5100 to 5199
N 50th St
Length: 0.17 miles
Directions: E-W, SE-NW
Address range: 5400 to 5799
Directions: E-W, SE-NW
Address range: 5400 to 5799
Ruston Way Tunl
Length: 0.10 miles
Direction: E-W
Direction: E-W
N Orchard St
Length: 0.09 miles
Direction: N-S
Address range: 4874 to 4999
Direction: N-S
Address range: 4874 to 4999
Ruston Way
Length: 0.07 miles
Direction: E-W
Address range: 5072 to 5199
Direction: E-W
Address range: 5072 to 5199
N Winnifred Pl
Length: 0.06 miles
Direction: N-S
Address range: 4900 to 4999
Direction: N-S
Address range: 4900 to 4999
Railroad features:
Union Pacific RR (Burlington Northern Santa Fe Rlwy)
Length: 0.64 miles
Direction: E-W
Direction: E-W